Network scaling effects in graph analytic studies of human resting-state fMRI data
- 1 Department of Psychiatry, Brain Mapping Unit, University of Cambridge, UK
- 2 Melbourne Neuropsychiatry Centre, Department of Psychiatry, University of Melbourne, Melbourne, VIC, Australia
- 3 GSK Clinical Unit Cambridge, Addenbrooke’s Hospital, Cambridge, UK
Graph analysis has become an increasingly popular tool for characterizing topological properties of brain connectivity networks. Within this approach, the brain is modeled as a graph comprising N nodes connected by M edges. In functional magnetic resonance imaging (fMRI) studies, the nodes typically represent brain regions and the edges some measure of interaction between them. These nodes are commonly defined using a variety of regional parcellation templates, which can vary both in the volume sampled by each region, and the number of regions parcellated. Here, we sought to investigate how such variations in parcellation templates affect key graph analytic measures of functional brain organization using resting-state fMRI in 30 healthy volunteers. Seven different parcellation resolutions (84, 91, 230, 438, 890, 1314, and 4320 regions) were investigated. We found that gross inferences regarding network topology, such as whether the brain is small-world or scale-free, were robust to the template used, but that both absolute values of, and individual differences in, specific parameters such as path length, clustering, small-worldness, and degree distribution descriptors varied considerably across the resolutions studied. These findings underscore the need to consider the effect that a specific parcellation approach has on graph analytic findings in human fMRI studies, and indicate that results obtained using different templates may not be directly comparable.
Introduction
Our perceptions, thoughts, emotions and experiences are the product of dynamic interactions occurring between functionally specialized regions of the brain. Thus, a complete understanding of such phenomena will only be possible once we understand how these interactions are organized and coordinated. An important step toward this goal involves developing detailed maps of the brain’s connectivity architecture, the so-called neural connectome (Sporns et al., 2005 ), at either the anatomical or functional level, at varying spatio-temporal resolutions.
Recent work on functional brain networks has focused on characterizing connectivity patterns of spontaneous, low-frequency (<0.1 Hz) fluctuations of the blood-oxygenation-level-dependent (BOLD) signal measured using functional Magnetic Resonance Imaging (fMRI). This followed seminal observations that such fluctuations show a high degree of coherence and spatial organization when participants are not engaged in a specific task; a condition commonly referred to as the resting-state (Biswal et al., 1995 ; Beckmann et al., 2005 ; Fox et al., 2005 ; Salvador et al., 2005a ,b ). The organization of these resting-state networks recapitulates functional networks observed across a range of cognitive, emotional, motor, and perceptual tasks (Fox et al., 2006 ; Vincent et al., 2007 ; Smith et al., 2009 ). They are robust across individuals and time (Damoiseaux et al., 2006 ; Buckner et al., 2009 ; Shehzad et al., 2009 ), can affect task-evoked activity (Fox and Raichle, 2007 ; Hesselmann et al., 2008 ), correlate with behavioral measures (Seeley et al., 2007 ; Kelly et al., 2008 ; van den Heuvel et al., 2009 ), and emerge from underlying neuronal dynamics (Nir et al., 2007 ; Shmuel and Leopold, 2008 ). Such observations have led to the postulate that these so-called resting-state networks represent an intrinsic property of functional brain organization (Fox and Raichle, 2007 ). They therefore provide an attractive means by which to characterize functional connectome properties.
One method for understanding rs-fMRI connectivity at a whole-brain level is graph analysis. Within this framework, the brain is represented as a graph comprising N nodes connected by M edges. In fMRI analyses, the nodes typically correspond to brain regions and the edges to some measure of inter-regional interaction, such as a supra-threshold temporal correlation between regional time series. Representing the brain in this way enables the application of a rich set of mathematical tools and theoretical concepts to understand brain network topology and dynamics (Strogatz, 2001 ; Albert and Barabasi, 2002 ; Newman, 2003 ; Bullmore and Sporns, 2009 ; Rubinov and Sporns, 2009 ). In particular, graph analytic studies of rs-fMRI data have demonstrated that functional brain networks display a small-world topology which provides high communication efficiency for relatively low connection cost, high resilience to random and targeted attack, and a hierarchical modular organization which offers optimal adaptability to varying circumstances (Simon, 1962 ; Achard et al., 2006 ; Achard and Bullmore, 2007 ; Bullmore and Sporns, 2009 ; Meunier et al., 2009 ). These properties can be compromised by disease (Liu et al., 2008 ; He et al., 2009 ; Wang et al., 2009b ), and may therefore provide important connectivity-based markers of neural integrity.
The combination of graph analysis and fMRI offers a powerful means for characterizing brain networks. However, the field is nascent, and several methodological challenges require resolution. One of the most difficult involves the appropriate selection of brain regions to represent the network nodes. The majority of studies have used an a priori anatomical template as the basis for regional parcellation. These templates, such as those included in the Automated Anatomical Labeling (AAL) toolbox (Tzourio-Mazoyer et al., 2002 ), the ANIMAL atlas (Collins et al., 1995 ), or the automated regional parcellation provided with software packages such as Freesurfer (Fischl et al., 2004 ), are generated by manual delineation of distinct brain regions in either a single individual (e.g., AAL) or sample of individuals (e.g., Freesurfer), and then mapped on to the brains of new participants using some spatial normalization routine. The mean time series is then extracted for each region, and pair-wise correlations between regional time series are computed to obtain a functional connectivity matrix. While the approach is straightforward and has proven useful, it is limited for several reasons. First, there is no accepted gold standard for regional parcellation, because, particularly in the cortex, there are no clear macroscopic boundaries that can be used to delineate adjacent regions. Thus, the criteria used are inherently arbitrary and vary from one template to the next. Second, the regions can vary in size from tens to thousands of voxels, which can affect resulting connectivity estimates (Salvador et al., 2008 ). Finally, because the regions are often large, it is likely that they include signals from several different functional sub-regions, which can complicate interpretation of region-specific findings.
More recently, some investigators have used parcellation methods that do not depend on arbitrary regional definitions. For example, Hagmann et al. (2007) used a random-seeding method to parcellate the cortical surface (gray/white matter boundary) into 500–4000 regions of approximately equal size. These regions were then projected out to fill the cortical volume for use with fMRI data in subsequent work (Hagmann et al., 2008 ; Honey et al., 2009 ). In addition, voxel-based approaches have been employed (Eguiluz et al., 2005 ; van den Heuvel et al., 2008 ; Hayasaka and Laurienti, 2010 ). With this approach, each image voxel is treated as a distinct network node. While such methods are computationally intensive, typically requiring analysis of networks of many thousands of nodes and many more edges, they demonstrate that a high degree of spatial specificity is achievable in graph analytic studies.
The range of possible parcellation strategies available for defining network nodes in graph analysis of fMRI data highlights the importance of understanding the degree to which the results of any one study may be contingent on the particular parcellation scheme employed. To our knowledge, three studies have attempted to directly compare the results obtained using different parcellation methods. In one, Zalesky et al. (2010) compared the results obtained from diffusion-MRI derived anatomical connectivity networks when using the AAL (82 regions) and random-seed generated templates comprising 100, 500, 1000, 2000, 3000, and 4000 regions. General decisions about network topology, such as whether the brain is small-world or scale-free, were not affected by parcellation scale, but differences did emerge when topology was quantified in terms of specific organizational parameters such as path length and clustering. However, this study did not investigate inter-individual variability of network metrics and it is unclear whether their results apply to measures computed from resting-state functional connectivity networks. Hayasaka and Laurienti (2010) compared rs-fMRI networks generated at the voxel- and region-wise levels, as well as two intermediate resolutions, and found a trend for increasing small-worldness, scale-freeness, and connectedness at higher resolutions. Wang et al. (2009a) compared the results obtained using two different anatomical parcellations applied to rs-fMRI data–the AAL (90 regions) and ANIMAL (70 regions) templates and reached similar conclusions, although they did not examine spatial scaling effects (i.e., the use of a coarse or fine-grained template). The available literature suggests that there may indeed be some effect of spatial scale on rs-fMRI network topology. For example, studies using coarser templates have concluded that resting-state functional brain organization is characterized by an exponentially truncated degree distribution (Achard et al., 2006 ; Hagmann et al., 2007 ), whereas voxel-based studies suggest the distribution follows a power law and is therefore scale-free (Eguiluz et al., 2005 ; van den Heuvel et al., 2008 ). Such conclusions have important implications for understanding how the brain might respond to disease or damage (Albert et al., 2000 ; Achard et al., 2006 ), and should therefore be methodologically validated.
Our goal in the current study was to examine the effects of parcellation scale on graph analytic measures of resting-state functional brain organization. To this end, we calculated a number of commonly used metrics from functional connectivity matrices generated using parcellation schemes spanning a wide range of spatial scales, and quantified the differences and similarities between them. More specifically, we focused on the following network properties, as these are by far the most commonly studied in the literature: functional connectivity, network connectedness, clustering coefficient, characteristic path length, small-worldness, and degree distribution. These measures are fundamental to most graph analytic studies of network topology and are the basis upon which inferences regarding network small-worldness or scale-freeness are made. Our results draw attention to the potential role different parcellation strategies may have in influencing the findings of graph analytic studies, and should inform interpretation of any findings derived using such methods.
Materials and Methods
Participants
Thirty (19 male) participants took part in the study. The mean age of the sample was 26.77 years (SD = 10.30 years). Five participants were left-handed. All volunteers were free of personal or family history of serious mental illness or neurological disorder, and had no history of substance abuse or head injury. All participants gave written, informed consent in accordance with local ethics committee guidelines.
Imaging Parameters
Scans were acquired at the Magnetic Resonance Imaging and Spectroscopy Unit (MRIS), Addenbrooke’s Hospital, Cambridge, UK, using a GE Signa HDxt system (General Electric, Milwaukee WI, USA) operating at 3 Tesla (3T). For rs-fMRI analyses, 512 echo-planar imaging (EPI) volumes depicting blood oxygen level dependent (BOLD) contrast were acquired of the whole-brain using the following parameters: repetition time (TR) = 1600 ms; echo time (TE) = 35 ms; number of excitations (NEX) = 1; number of slices = 23; slice thickness = 7 mm plus 0 mm interslice gap (spacing between slices = 7mm); Flip Angle (FA) = 90°; field of view (FOV) = 240 mm × 240 mm; image matrix size = 64 × 64; voxel dimensions = 3.75 mm × 3.75 mm.
Image Pre-Processing
For each individual, functional volumes were realigned using a rigid-body transformation to correct for geometric displacements associated with head movements and rotations. Temporal motion correction was then performed by regressing the current and lagged first and second order displacements against the time series of the realigned images. The residuals of this regression were then used for further analysis. These steps were implemented using freely available software 1 . Finally, the realigned, temporally corrected images were spatially normalized to the International Consortium for Brain Mapping echo-planar imaging template supplied with SPM5 2 using a 12-parameter affine transformation (Jenkinson and Smith, 2001 ), as implemented in the FSL toolkit 3 . The accuracy of all normalizations was verified via visual inspection. The images were re-sliced to 2 mm3 voxels during the spatial normalization.
Template Generation
To construct parcellation templates of varying spatial resolution, we used an algorithm adapted from that described by Zalesky et al. (2010) for partitioning the AAL template into N contiguous regions while constraining the ROI volumes to be as uniform as possible. To generate a parcellation of finer scale than the native AAL resolution, each node composing the AAL template was subdivided into a set of micro nodes. Each micro node was constrained to lie within the volume encapsulated by its parent AAL node and each micro node was ensured to be contiguous.
The parcellation was performed using the following algorithm: Let N be the total number of desired nodes (i.e., the number of micro nodes). The number of micro nodes into which an AAL node was subdivided was proportional to its volume. Specifically, if an AAL node encapsulated V% of the total gray-matter volume, it was subdivided into K = VN micro nodes. This constraint promoted uniformity in the volumes encapsulated by micro nodes. To subdivide an AAL node into K micro nodes, K voxels encapsulated by the AAL node were chosen at random. Each of these voxels defined the “origin” of a distinct micro node. The remaining voxels encapsulated by the AAL node were then assigned to one and only one of the K origins. In particular, a voxel was assigned to the origin to which it was closest, as dictated by the shortest Euclidean distance. Any ties in distance were broken randomly. This guaranteed contiguity of each micro node. The allocation procedure was repeated independently for each AAL node. An alternative approach would involve arbitrary parcellation of the binarized AAL mask without respecting the existing divisions of the AAL template (i.e., permit a micro-node to lie across multiple AAL nodes), but this method would permit non-sensical nodes that, for example, include both hemispheres.
The above procedure was repeated six times, for N = 100, 250, 500, 1000, 1500, and 5000. We also generated networks using the original AAL, resulting in a total of seven parcellation scales being studied. Each of these templates was applied to the participants’ functional data to extract regional mean time series. To minimize noise associated with variable acquisition coverage in different individuals, we only retained ROIs where at least 70% of the voxels contained a non-zero signal. ROIs not meeting this criterion in all subjects were excluded from further analysis. This ensured that all networks within a parcellation scale were constructed from the same number of nodes. The final result was seven templates, comprising 84, 91, 230, 438, 890, 1314, and 4320 regions. From hereon, these will be referred to as aal84, parc91, parc230, parc438, parc890, parc1314, and parc4320, respectively. The aal prefix is intended to denote that the ROI boundaries for that template are based on those of the original AAL. The parc prefix denotes that the ROI boundaries have been determined using the algorithm described above. Details about ROI volumes at each parcellation scale are presented in Table 1 .
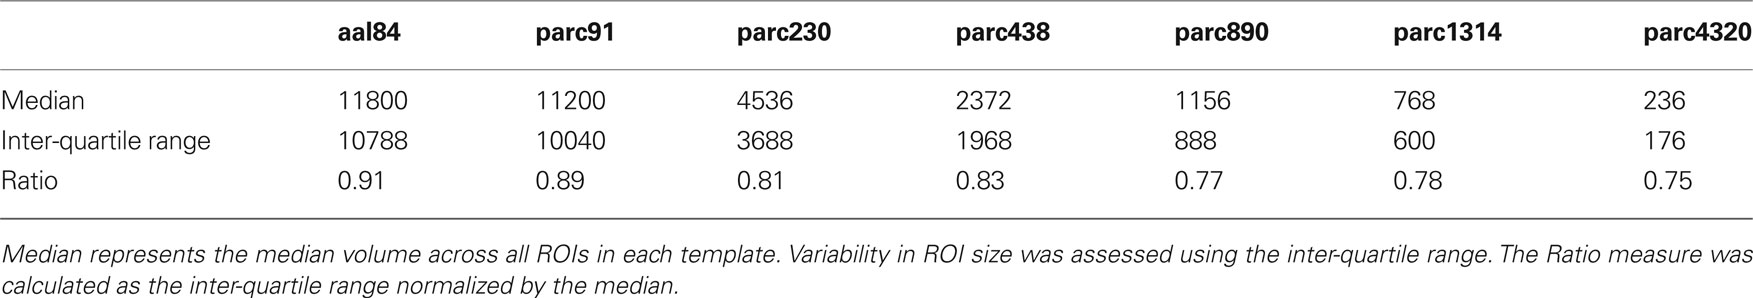
Table 1. Region-of-interest (ROI) volume (mm3) statistics as a function of parcellation scale.
Graph Analysis
Network construction
At each parcellation scale, for each subject, the mean time series of each region was extracted and decomposed into four distinct frequency bands using the maximal overlap discrete wavelet transform (Percival and Walden, 2000 ; Bullmore et al., 2004 ; Achard et al., 2006 ). We used the mean time series of each region, as this is the most commonly used method for estimating regional activity fluctuations. We note that other techniques, such as extracting the principal eigenvector, may also provide a representative sample of regional activity. The four frequency bands identified were: scale 1, 0.16–0.31 Hz; scale 2, 0.08–0.16 Hz; scale 3, 0.04–0.08 Hz; and scale 4, 0.02–0.04 Hz. In the present analysis, we focused on scale 3 of the wavelet decomposition (0.04–0.08 Hz), as this is the band most commonly studied in rs-fMRI analyses and represents a reasonable trade-off between avoiding the physiological noise associated with higher frequency oscillations (Cordes et al., 2001 ) and the measurement error associated with estimating very low frequency correlations from limited time series (Achard et al., 2008 ). To correct for BOLD signal fluctuations of a non-neuronal origin, time series extracted from seed regions placed in the white matter and cerebrospinal fluid were regressed against the wavelet-filtered regional time courses, and the residuals of these regressions were used for further analyses (Fox et al., 2005 ). We did not correct for global signal fluctuations as this step is known to introduce artifactual correlations (Fox et al., 2009 ; Murphy et al., 2009 ), and its effects on whole-brain connectivity networks are as yet unclear.
Correlations between each possible pair of regions were computed using the filtered, corrected regional time courses to generate a N × N functional connectivity matrix for each individual at each parcellation scale. As these connectivity matrices were populated using a continuous association measure (i.e., wavelet correlations), it was necessary to apply a threshold to remove noisy edges and extract an underlying network topology. As the choice of a specific threshold can be arbitrary, we examined network properties across a range of thresholds to test for consistency of the results. These thresholds were expressed as a network connection cost, defined as the proportion of supra-threshold connections relative to the total possible number of connections in the network (Achard and Bullmore, 2007 ). Thus, a network thresholded at a cost of 10% comprised only the highest 10% of correlation values in the matrix. The sign of the correlations in the connectivity matrices was ignored, so that thresholding was based only on the absolute correlation values.
In our analyses, for templates ranging in resolution from aal84 to parc1314, we examined the full range of costs from 5 to 40%. We chose a minimum bound of 5% to avoid excess network fragmentation at sparser thresholds. The upper bound of 40% was chosen because it represents a liberal limit on estimates of cerebral connectivity reported in the literature (Latora and Marchiori, 2003 ; Bassett and Bullmore, 2006 ), and the networks tended toward randomness at higher costs (i.e., estimates of σ, an index of small-worldness, approached those of a random network; see also Figure 6 ). (Note that this approach implicitly assumes that randomness is a spurious property of brain networks.) For parc4320, we only examined costs of 10, 20, 30, and 40% due to the computational time involved in generating network measures for such large networks. After applying each threshold, the matrices were binarized such that supra-threshold connections were assigned to one and sub-threshold connections to zero. These binarized adjacency matrices were then used as a basis for network construction and graph analysis. In total, this procedure resulted in the construction and analysis of 6420 network graphs. A schematic overview of the processing steps using in graph construction is provided in Figure 1 . We used binary, globally thresholded graphs for network characterization because this is the most frequently used approach in the literature. Other methods, such as spectral graph partitioning (see Boccaletti et al., 2006 for an overview), may also provide useful information and warrant further investigation.
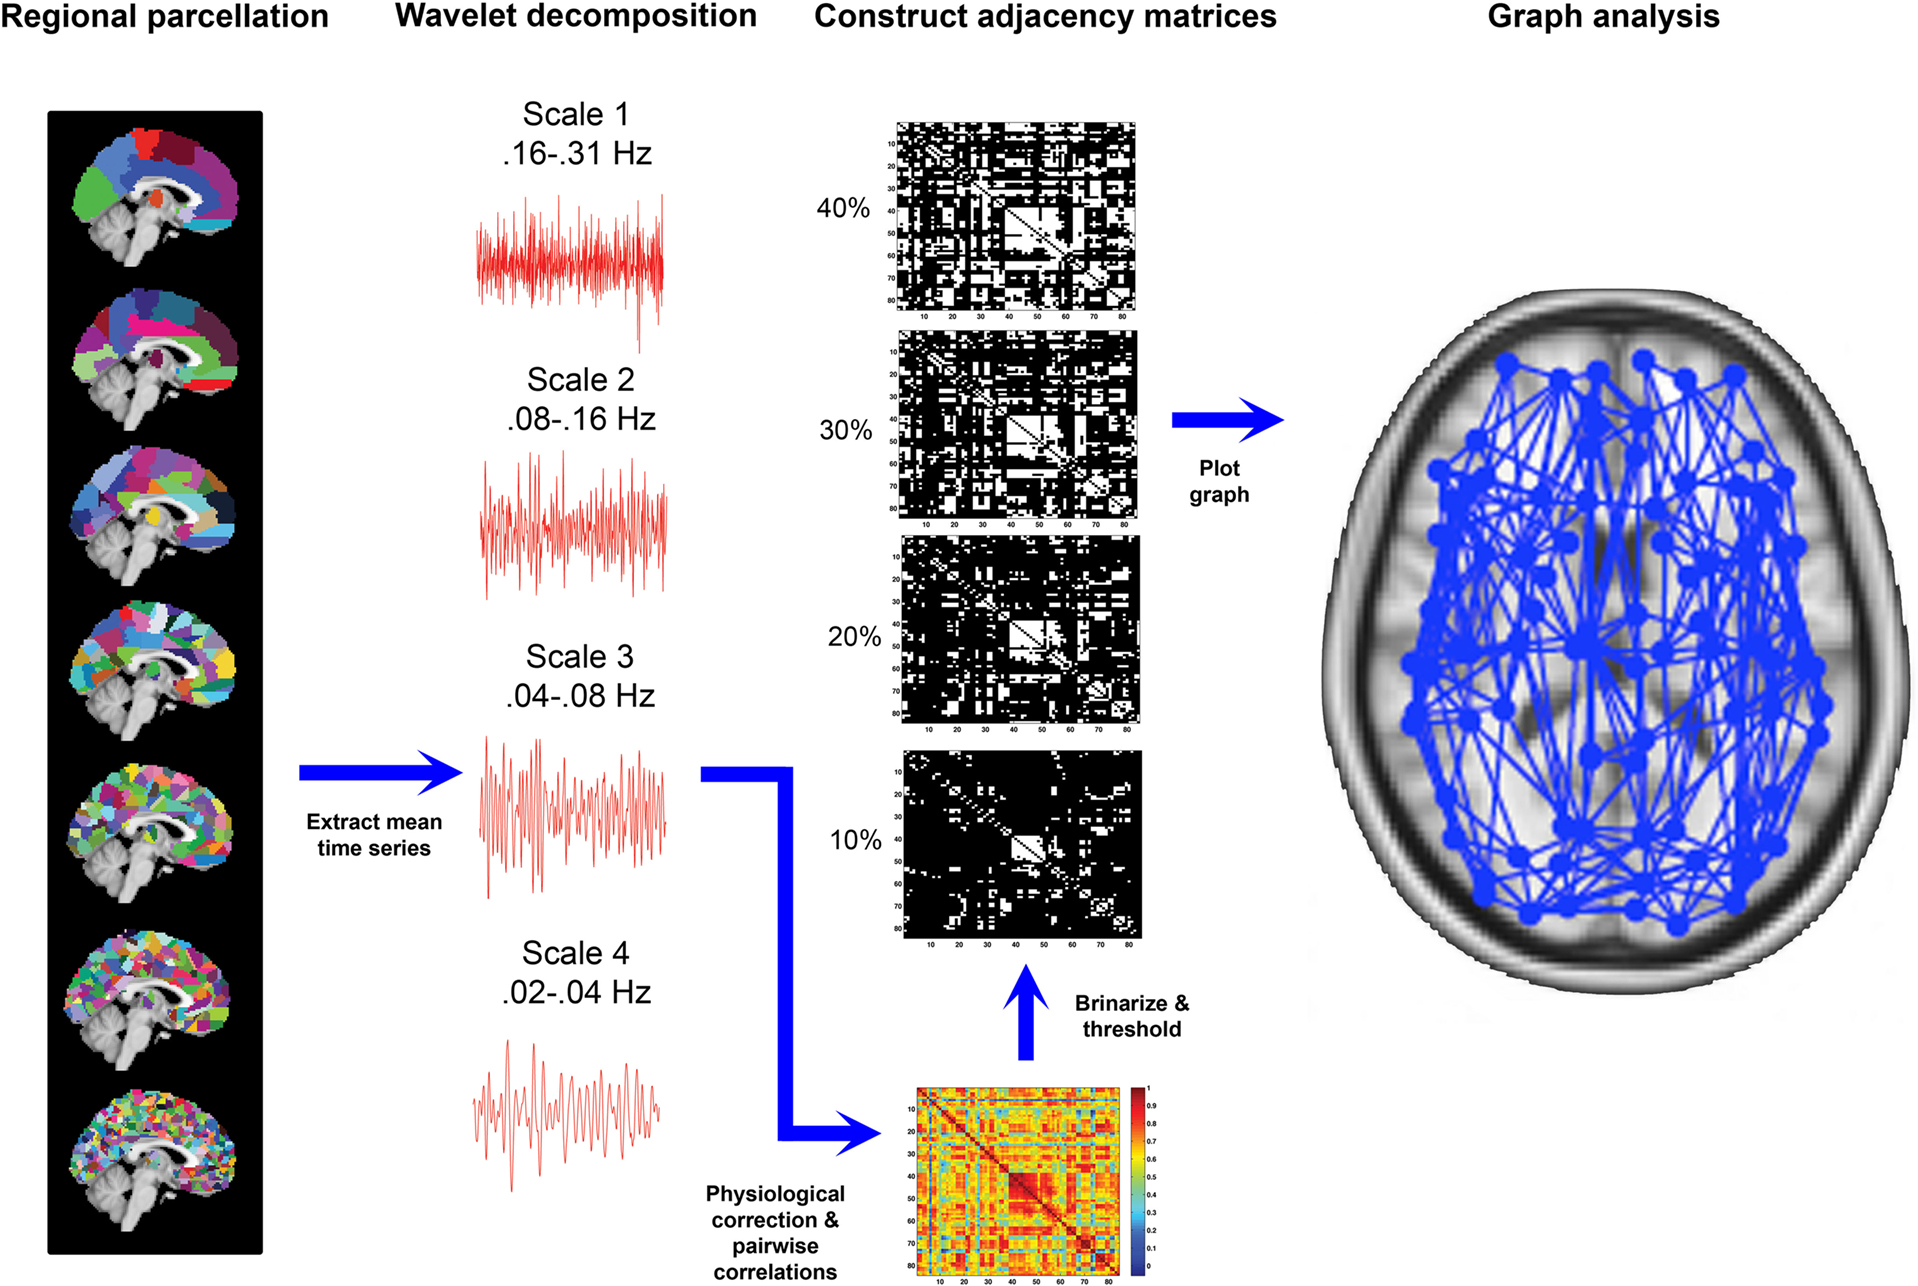
Figure 1. Overview of image processing steps used in generating graph-based representations of whole-brain connectivity network. Far left: seven distinct parcellation templates were generated, which divided the brain into (from top to bottom) 84, 91, 230, 438, 890, 1314, or 4230 regions-of-interest. Middle-left: the templates were applied to each subject’s fMRI volumes and the mean time series of each region were extracted and decomposed into four frequency intervals using a wavelet transform. Middle-right: spontaneous oscillations subtended by the wavelet frequency interval 0.04–0.08 Hz were further corrected for physiological noise signals and temporal correlations between each possible pair of regional corrected time series were calculated to generate a functional connectivity matrix for each template for each participant. These matrices were then thresholded and binarized across a range of connection costs (examples shown are for 10, 20, 30, and 40% costs). Far right: The thresholded, binarized adajacency matrices were used to generate graph-based representations of network connectivity, such that each region was represented as a node and each supra-threshold correlation as a connecting edge. These graphs were used as a basis for calculating graph metrics.
Graph metrics
A number of graph analytic measures can be used to characterize diverse aspects of network organization (reviewed in Rubinov and Sporns, 2009 ). Here, we concentrated on those most frequently used in the literature, and which pertain to the most fundamental properties of the networks: network connectedness, small-worldness, and the degree distribution.
Network connectedness refers to how well connected the network nodes are. If a path can be traced from any node in the network to all others, the network is connected. In thresholded data such as those provided by fMRI, this can be assessed by computing the size of the largest connected component of the graph as a function of cost. As the connectedness of a network increases, the size of the largest connected component will approach N.
Small-worldness was assessed in relation to five parameters: clustering coefficient, mean minimum path length, λ, γ, and σ. The clustering coefficient, Ci, is the proportion of connections present between a node’s neighbors. High values imply that nodes connected to node i are also connected to each other, suggesting node i is situated in a cliquish neighborhood of connectivity. The mean minimum path length, Li, was computed for each node as the average number of edges comprising the shortest path between node i and all other nodes. The characteristic path length of the network, Lnet, was simply the average path length of the entire network. Low values indicate that information can be transferred between nodes with only a few connections, which is indicative of a more efficient topological organization (Latora and Marchiori, 2001 ). In cases where the largest connected component of the network was <N, which typically occurs at low connection costs, we set the path length of disconnected nodes to the maximum observed for the network. This helped avoid computational problems associated with estimating path length for an isolated nodes, which is formally defined as ∞ (see also Zalesky et al., 2010 ). As such, our path length measure was inversely related to the global network efficiency measure proposed elsewhere (Latora and Marchiori, 2001 ), where disconnected nodes are assigned an efficiency of zero. Separate analyses showed that path length and efficiency values were indeed highly negatively correlated (<−0.90 for most costs and templates), and the general pattern of results concerning the effects of different parcellation scales was consistent.
To diagnose small-worldness, Lnet and Cnet were normalized by their corresponding values in comparable random graphs (Lran and Cran, respectively), resulting in estimates of λ = Lnet/Lran and γ = Cnet/Cran, respectively. In small-world networks, λ∼1 and γ > 1. Thus, small-world properties are evident when the scalar summary σ = γ/λ > 1 (Humphries et al., 2006 ). We calculated Lran and Cran using two different methods. One involved using standard analytic approximations for equivalent Erdos–Rényi random graphs (Albert and Barabasi, 2002 ), where Lran = ln(N)/ln(d) and Cran = d/N and d represents the average nodal degree of the ith node. The second method involved using an algorithm that gradually rewired the edges of the thresholded adjacency matrix for each participant to generate a random topology (Maslov and Sneppen, 2002 ). In both cases, the normalization was matched for network size and mean degree, but the rewiring algorithm also matched for degree distribution. From hereon, we will refer to the Erdos–Rényi method as ER-normalization and the rewiring method as RW-normalization. These abbreviations will be appended as subscripts when referring to the normalized measures γ, λ, and σ to denote the normalization method used in their computation.
By definition, RW-normalization requires generation and measurement of surrogate graphs, increasing computation burden relative to ER-normalization. The time difference between the two can be an important consideration when studying large networks over multiple costs. Accordingly, in the current study, we computed normalized measures for costs of 10, 20, 30, and 40%. In the case of the RW-normalization, 20 random graphs were analyzed per subject per cost at each parcellation scale. Consequently, the normalized parameters γ, λ, and σ were only evaluated at these four costs.
To examine the degree distribution of the networks, we plotted nodal degree against nodal rank in log–log coordinates to diagnose scale-freeness. Typically, an approximately linear rank-degree plot is interpreted as evidence of power-law scaling in the degree distribution, although it does not provide conclusive evidence for such properties (Liu et al., 2005 ; Clauset et al., 2009 ). A power-law or scale-free degree distribution suggests that while most nodes possess a low degree, the probability of finding very highly connected nodes (termed network hubs) is higher than expected in a commensurate random network. We used rank-degree plots to avoid the artifacts associated with the binning procedures required for constructing frequency-degree plots (Liu et al., 2005 ). We formally tested for scale-freeness by fitting models describing power-law (scale-free), exponential and exponentially truncated (broad-scale) distributions to the curves for each subject, and compared their goodness of fit using Akaike’s information criterion (AIC). The model with the lowest AIC value was identified as the one providing the best fit to the data. We used simple least squares estimation, consistent with prior work (e.g., Achard et al., 2006 ). Other methods can provide more accurate results when estimating power-law scaling (Bauke, 2007 ; Clauset et al., 2009 ), but may be limited in cases where there is a truncation of the power-law, as in the present data (see below). All graph analyses were performed using Matlab 7.8.0 (MathWorks, Inc) using a combination of freely available tools 4 , 5 , 6 and custom code.
Statistical Analyses
We performed two types of analyses: one focused on mean differences, and the other on individual differences. To test whether there were any mean differences in network parameters as a function of parcellation scale, we ran separate repeated measures analyses of variance at each cost examined, using parcellation scale as the independent variable. This analysis was intended to determine whether mean differences between parcellation scales were of sufficient magnitude to be considered statistically significant. As the analysis was intended to highlight parcellation scales where there may be differences, we adopted an exploratory threshold of α = 0.05, uncorrected.
While different parcellation scales may show mean differences in absolute parameter estimates, they may still preserve the pattern of relative differences between individuals. Such relative differences are generally those of primary interest in correlational or case–control experiments. Thus, to quantify whether relative differences were preserved across scales, we computed the correlation between each pair of scales for each measure at costs of 10, 20, 30, and 40%. Spearman rank correlations were used to account for non-normality of the data.
Results
Parcellation Scale and Functional Connectivity Estimates
Table 2 presents measures of average connectivity, and variability in connectivity, as a function of parcellation scale. There was a general trend for average functional connectivity, as measured by the median correlation in each individual’s connectivity matrix, to decrease with increasing spatial resolution of the template; from the lowest to the highest resolution, there was an approximate decrease of 38% in the mean correlation value. Measures of between-subject variability in mean connectivity, and within-subject variability in connectivity estimates, remained relatively consistent across parcellation scales. Figure 2 presents the sample averaged correlation histograms at each parcellation scale. The shapes of each distribution are highly similar, but their mean value is shifted toward zero with increasing spatial resolution.
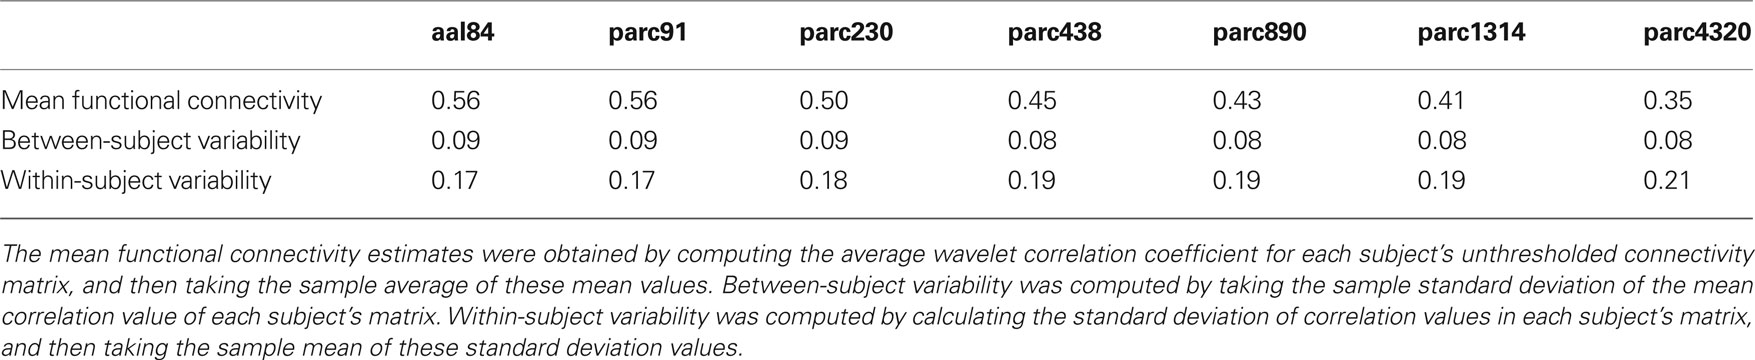
Table 2. Changes in average in functional connectivity, and variability of connectivity estimates, as a function of parcellation scale.
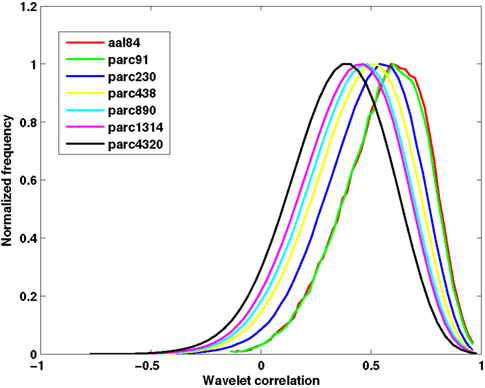
Figure 2. Functional connectivity histograms obtained at each parcellation scale. Each line corresponds to the sample average histogram of correlation values contained in each participant’s unthresholded functional connectivity matrix.
To examine how changes in ROI size associated with each parcellation scale were related to regional functional connectivity estimates, we used the following procedure. At each parcellation scale, for each subject, we calculated the mean correlation value of each brain region. We then correlated these regional mean correlation values with the volume of each region to obtain a correlation value for each participant at each scale reflecting the association between average regional connectivity and ROI size. Figure 3 presents a boxplot of these subject-specific correlation values at each parcellation scale. On average, across all scales, the correlation between ROI size and mean regional connectivity was low (median <0.3), although for some subjects it exceeded 0.5 when coarser templates (i.e., aal84 and parc91) were used. All correlations for more fine-grained templates (i.e., parc890 and higher) were <0.3. This suggests that using more fine-grained templates can reduce the dependence of functional connectivity estimates on ROI size. In addition, Figure 3 indicates that inter-individual variance in the association between ROI size and connectivity estimates is reduced at higher spatial resolutions, which may serve to increase power in statistical analyses of graph measures.
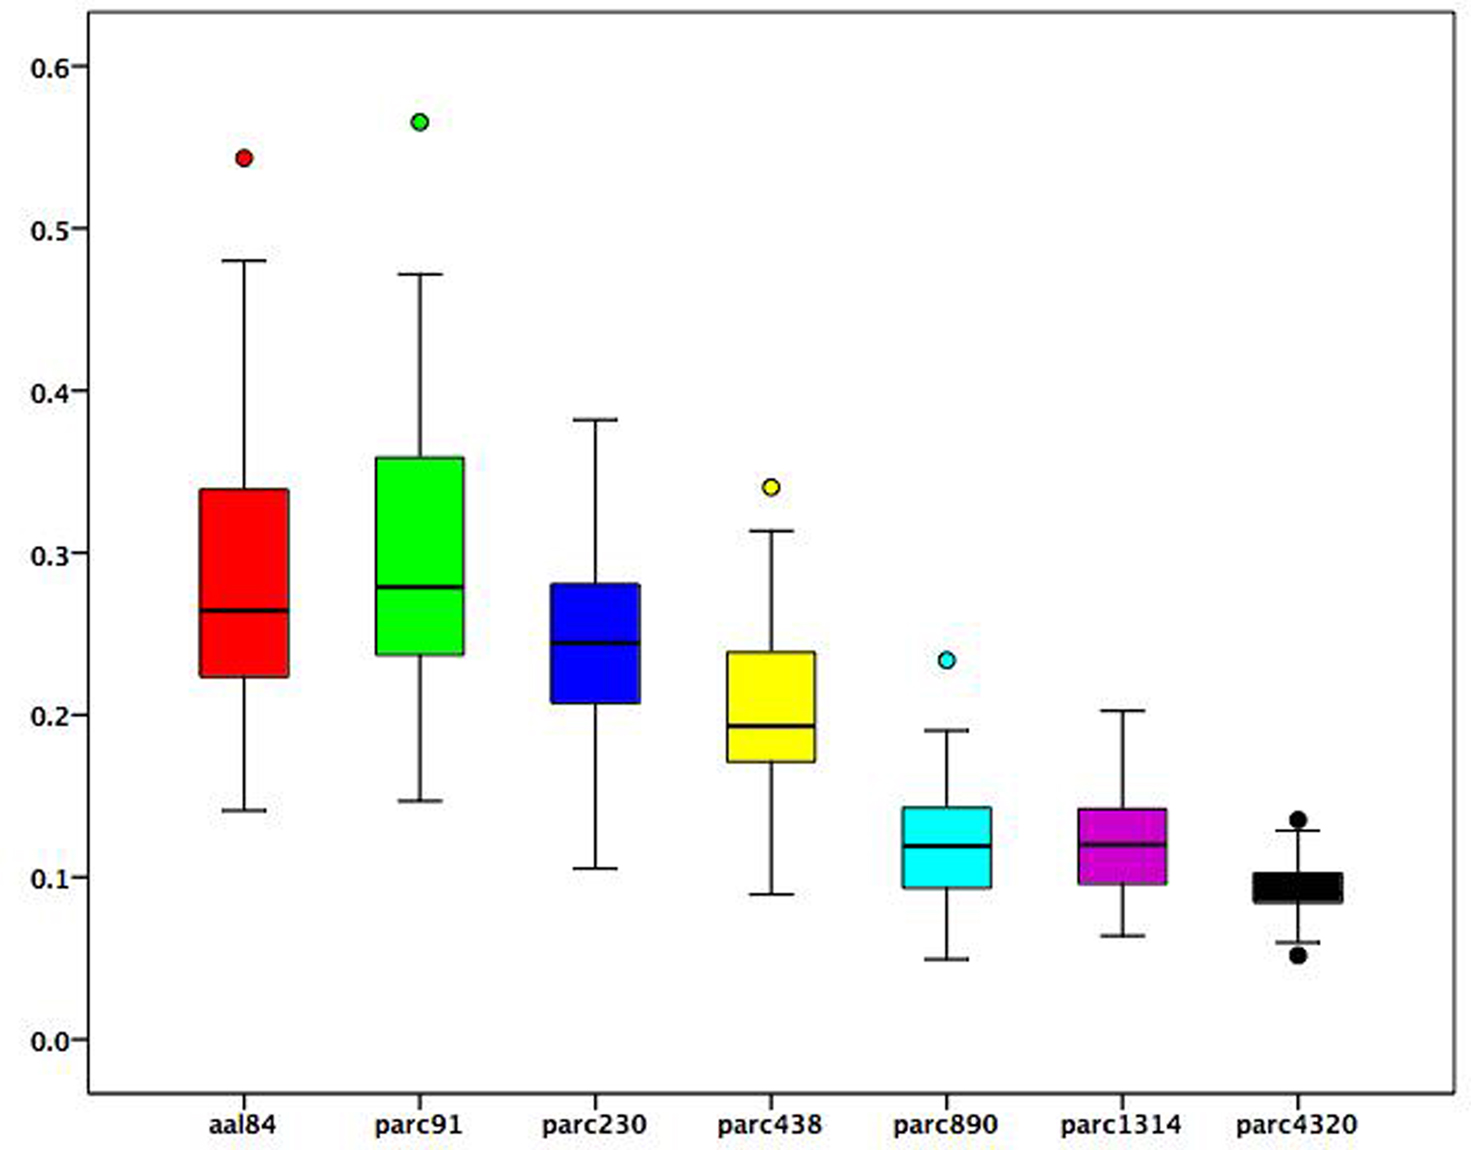
Figure 3. Boxplots of subject-specific correlations between mean regional functional connectivity and regional volumes at each parcellation scale. Boxes represent the inter-quartile range, heavy horizontal lines the median. Whiskers represent the 5th and 95th percentiles. Circles represent values beyond these percentiles.
Parcellation Scale and Graph Metrics
The effects of parcellation scale on network connectedness
To examine how parcellation scale affected network connectedness we calculated the size of the largest connected component, as a proportion of N, for each subject at each parcellation scale across the cost range 5–40%. (This analysis was not possible for parc4320, as only four costs were examined at this scale.) The results are presented in Figure 4 (left). A value of 1 on the y-axis indicates that the largest connected component includes all nodes – the network is connected. As can be seen, increasing spatial resolution was associated with greater connectedness. In particular, the parc890 and parc1314 networks were, on average, connected even when the networks were sparse (i.e., cost <10%). In contrast, lower resolution templates only achieved connectedness at higher costs.
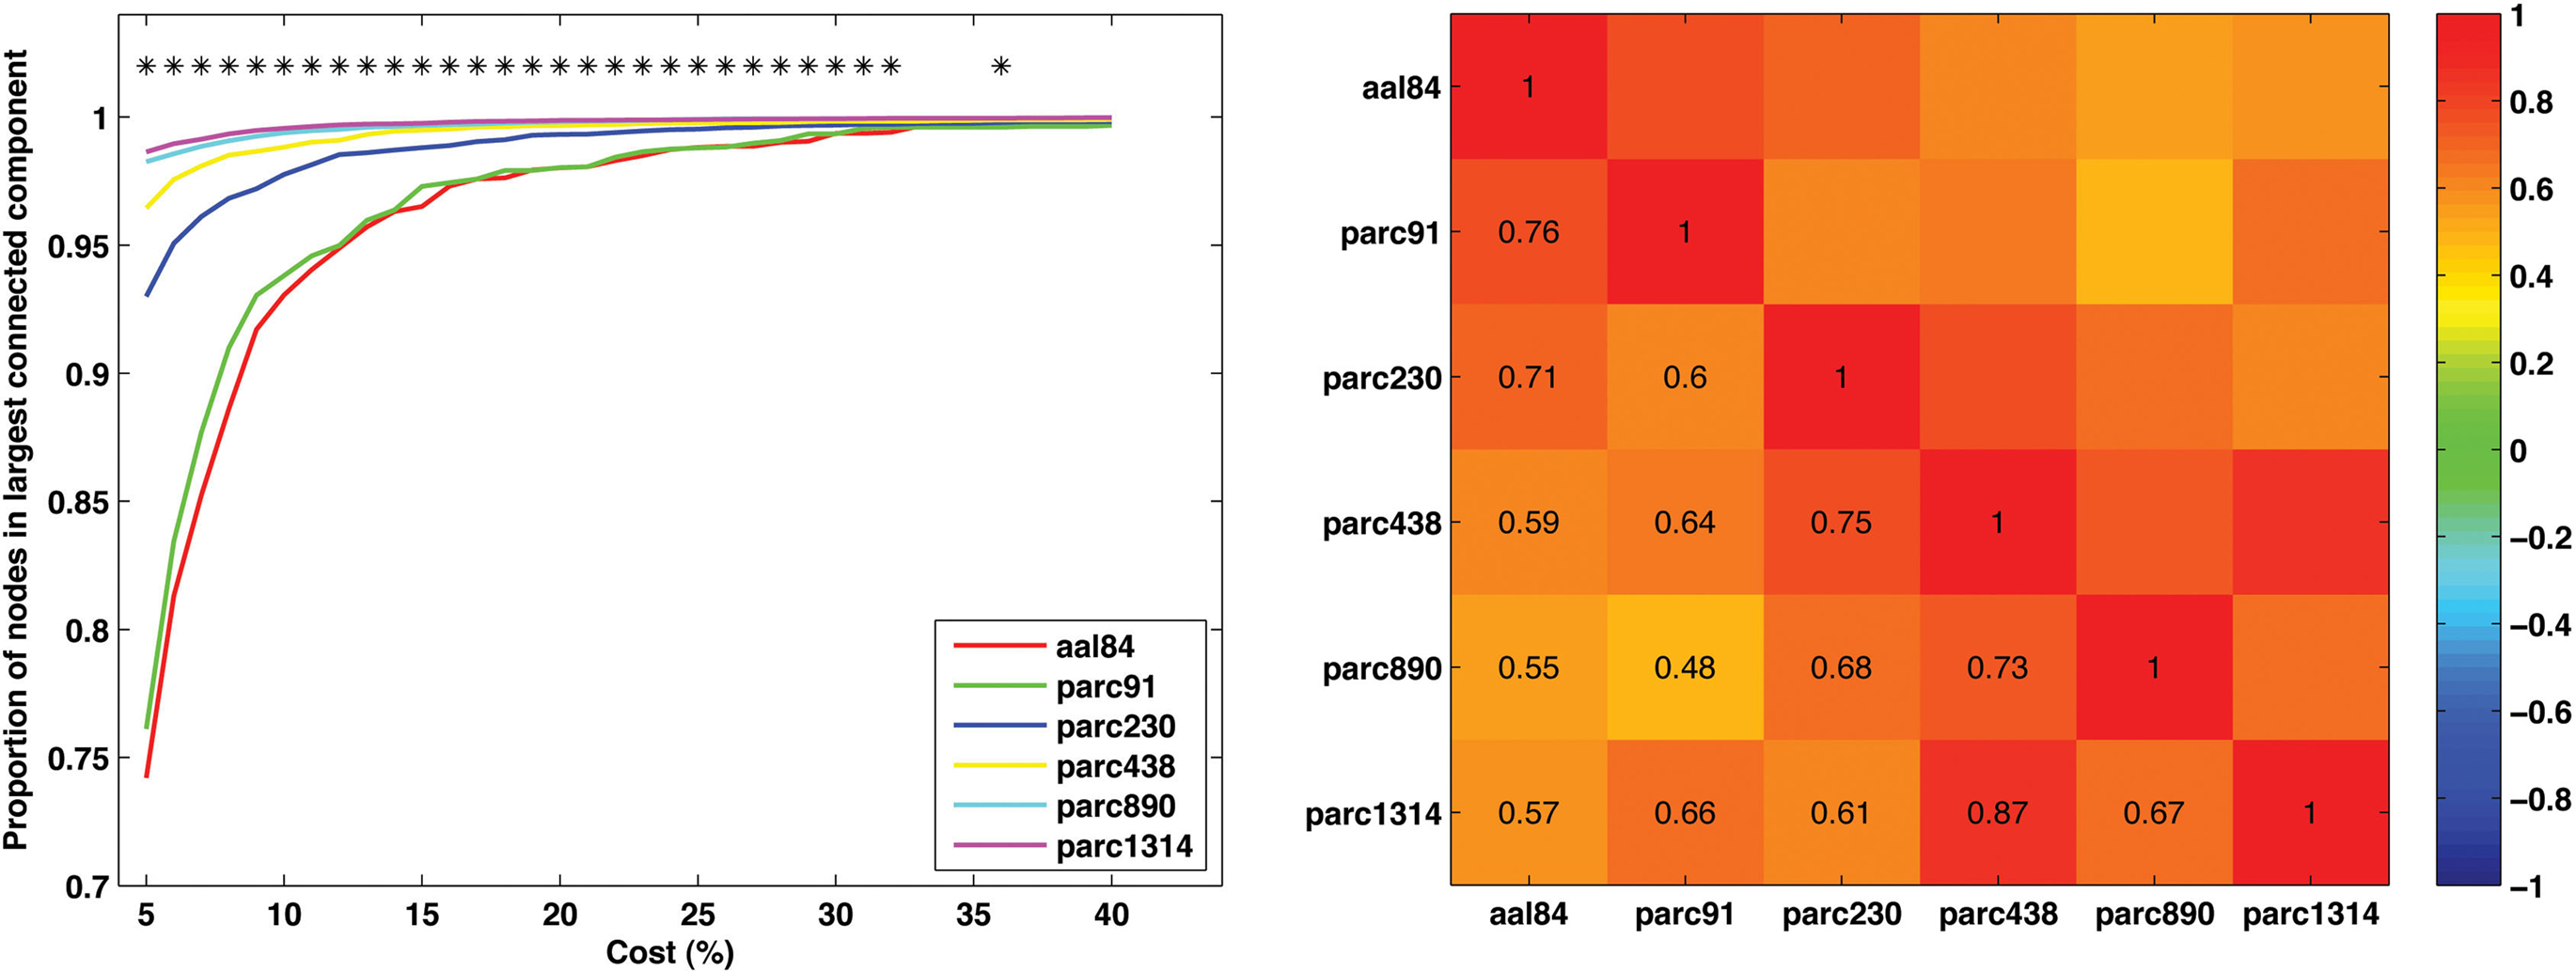
Figure 4. Mean values and individual differences in network connectedness as a function of parcellation scale. Left: Sample mean size of largest connected network component for each parcellation scale across all costs examined (*p < 0.05). Right: correlation matrix of inter-scale associations for the cost at which each individual’s network became connected.
To further quantify the degree of similarity between parcellation scales with respect to network connectedness, we calculated the cost at which each subject’s network became connected for each parcellation scale. We then computed the correlation between these values for each pair of parcellation scales. This correlation matrix is presented in Figure 4 (right). Correlations were generally positive, and were highest for scales with similar resolution. For example, the correlation between parc1314 and parc890 was higher than that for parc1314 and aal84.
The Effects of Parcellation Scale on Network Small-Worldness
Figure 5 plots the sample mean Cnet and Lnet for all parcellations up to parc1314 across costs 5–40%. Figure 6 plots the sample means for Cnet, Lnet, λ, and γ for all parcellations at costs of 10, 20, 30, and 40%. Figure 7 shows the same for σ. Significant mean differences as a function of parcellation scale were apparent for nearly all costs examined. In general, there was trend for networks defined at higher resolutions to be associated with lower Lnet. The dependence of Cnet on parcellation scale varied as a function of cost; higher resolution networks showed increased clustering at costs lower than ∼25%, but this trend reversed for higher costs. This effect likely reflects the aforementioned parcellation-dependent effects on network fragmentation: at lower costs, coarse resolution networks were more fragmented, lowering estimates of Cnet.
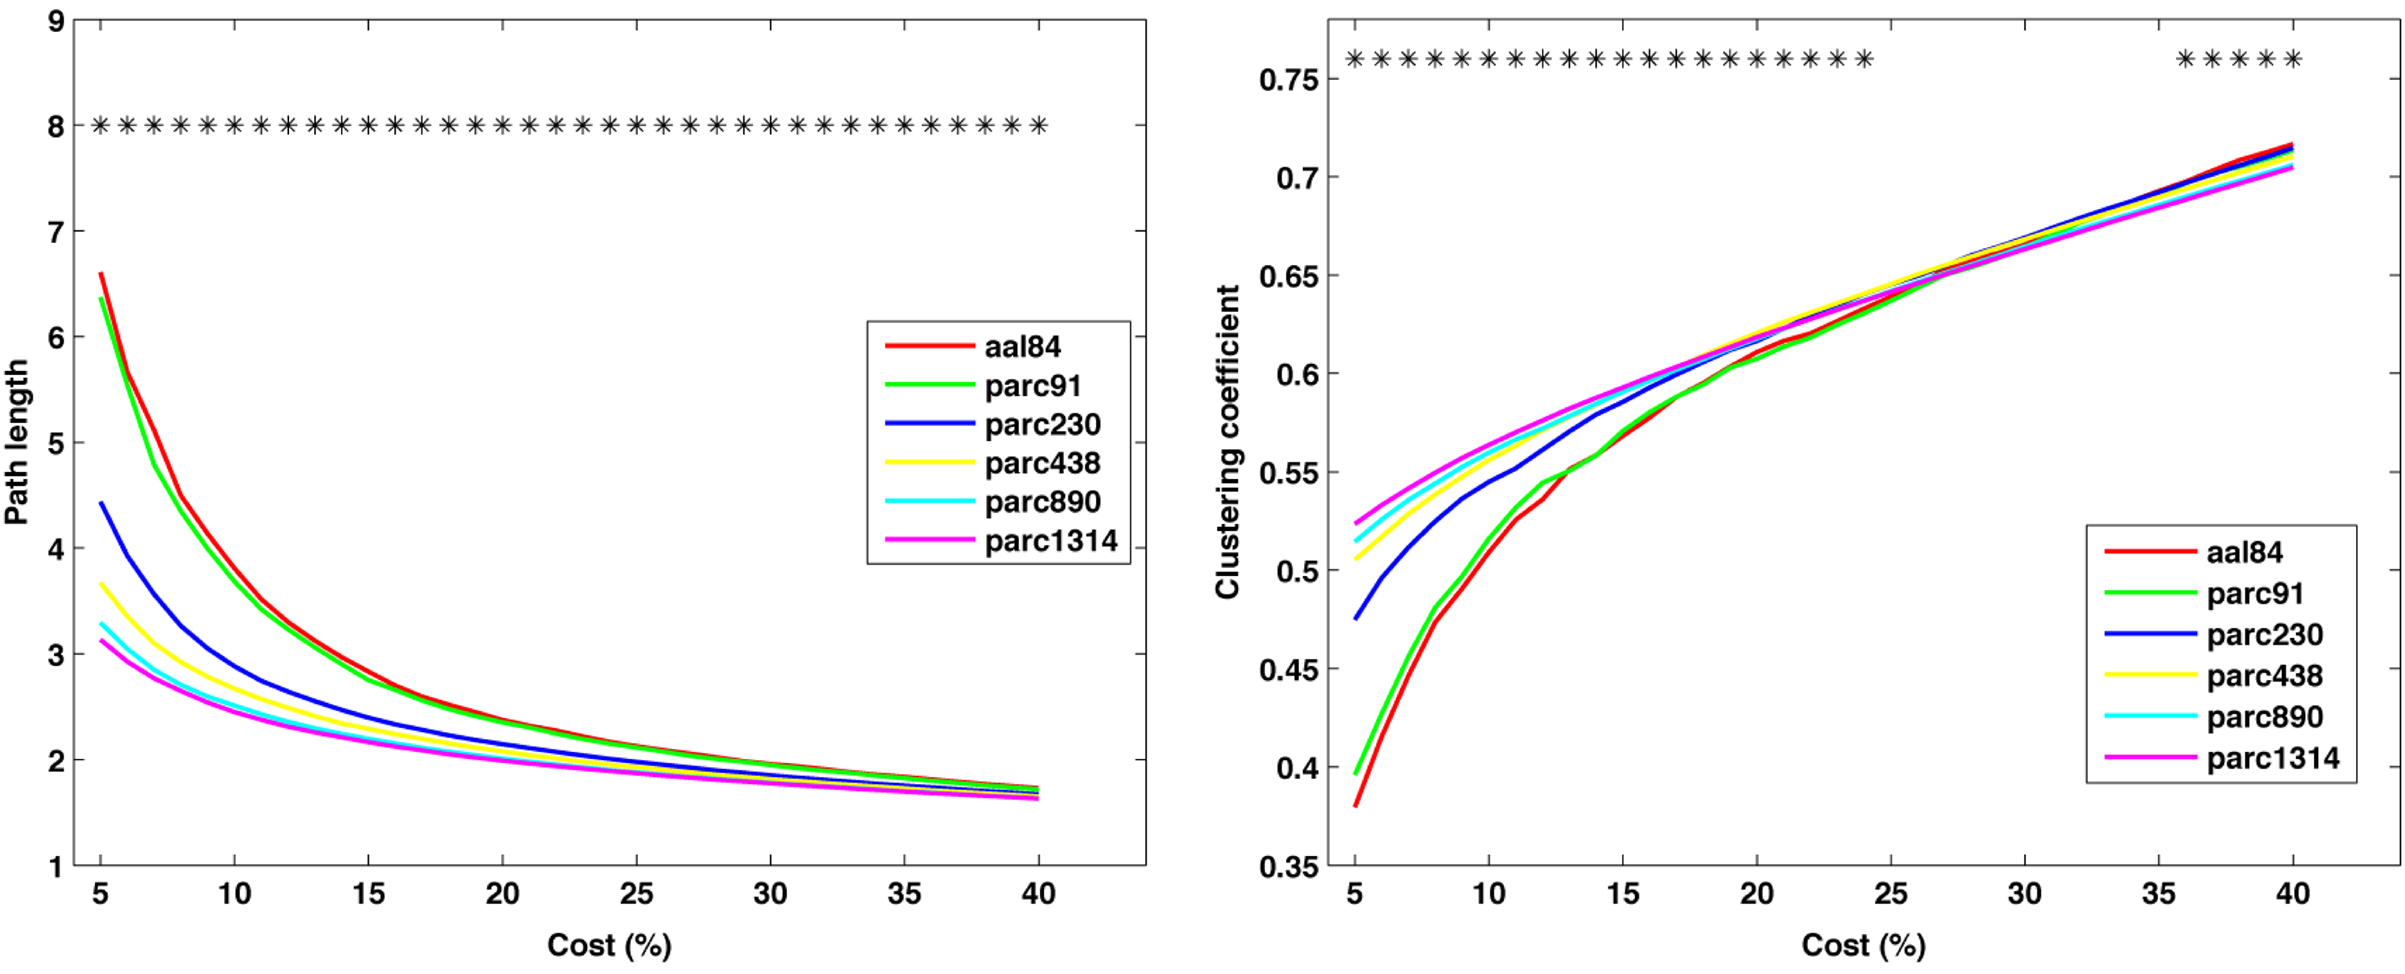
Figure 5. Mean values of global network path length (left) and clustering coefficient (right) at each cost. *p < 0.05.
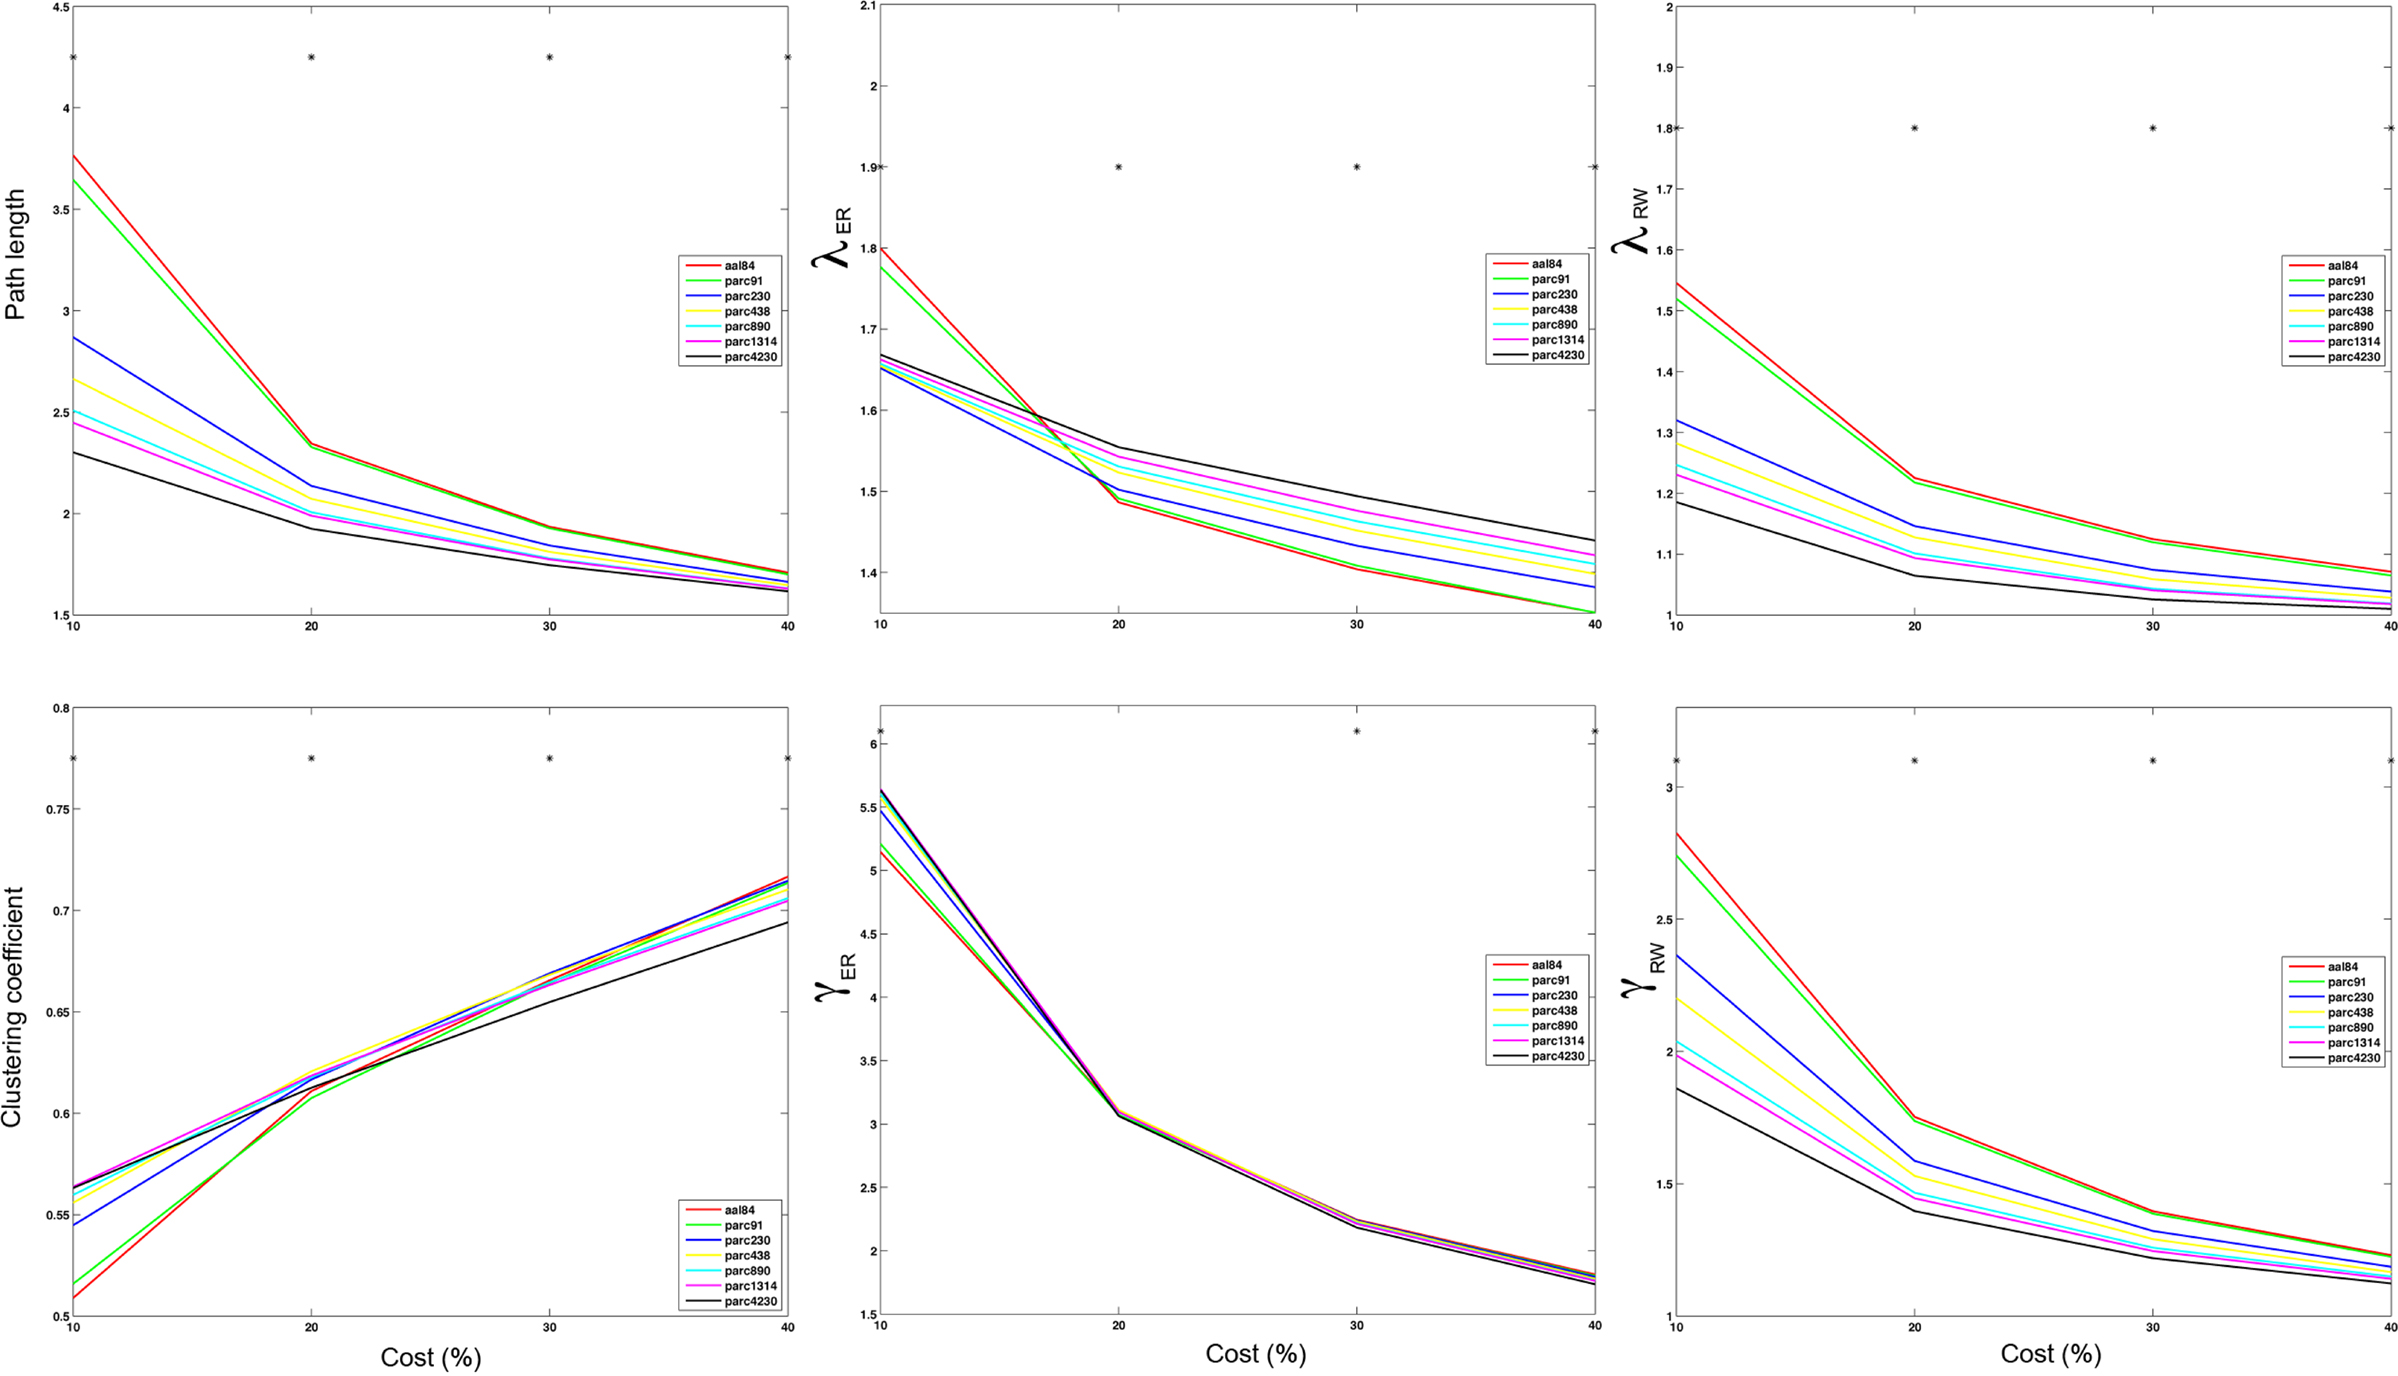
Figure 6. Mean values of global network path length (top left), λER (top middle), λRW (top right), clustering (bottom left), γER (bottom middle) and γRW (bottom right) at costs of 10, 20, 30, and 40% for each parcellation scale. *p < 0.05.
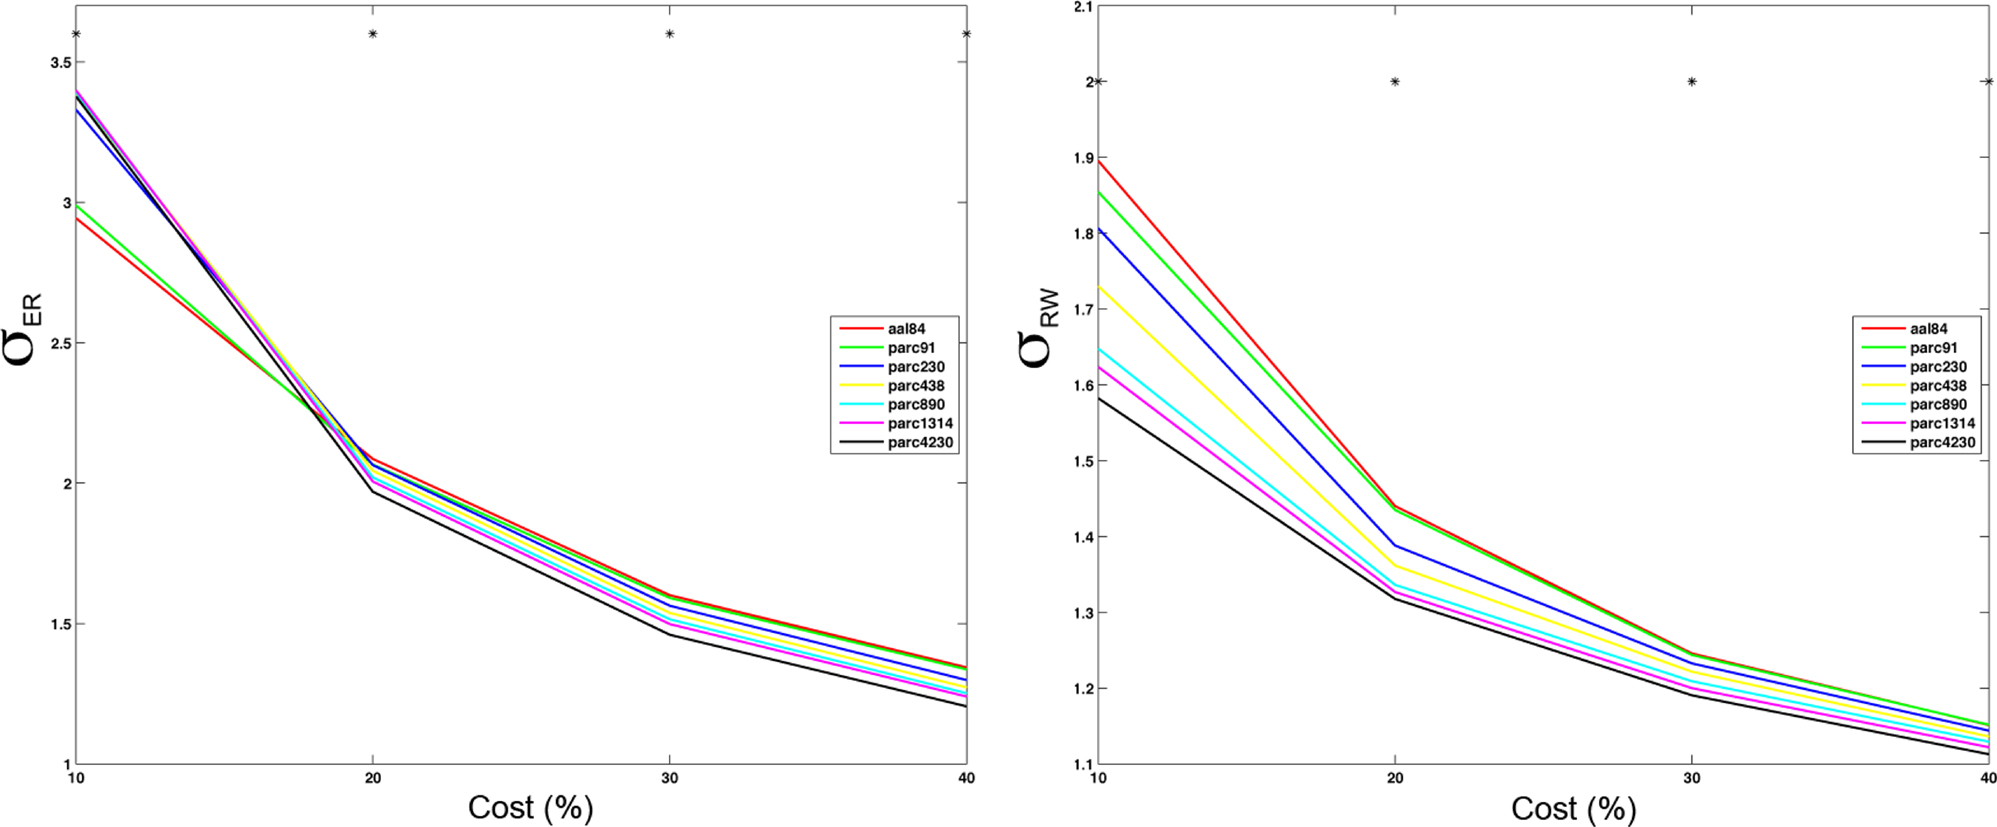
Figure 7. Mean small-worldness (σ) values computing using ER- or RW-normalization (left and right respectively) for each parcellation scale at costs of 10, 20, 30, and 40%. *p < 0.05.
The effects of parcellation scale on normalized measures varied depending on which normalization was used. In general, as parcellation resolution increased λER estimates increased and λRW decreased. The only exception to this trend was λER at 10% cost, where aal84 and parc91 showed the highest path length. Again, this effect likely reflects increased fragmentation in the observed networks at sparser thresholds. Estimates of γRW were consistently higher in high-resolution templates, whereas γER differences also showed a dependence on cost: at 10%, coarser resolutions showed lower values, whereas this effect reversed at higher costs. Similar trends were observed for σ, such that higher resolutions were associated with lower σRW values across all costs examined, whereas σER differences were contingent on cost in a manner that paralleled the pattern observed for γER.
The pair-wise correlations between different parcellation scales for Cnet, Lnet, λRW, γRW, σER, and σRW, are quantified at costs of 10, 20, 30, and 40% in Figure 8 . (Matrices for λER and γER are not shown because they were computed by normalizing λ and γ with a constant value across all individuals, making individual differences in these parameters identical to the non-normalized measures.) In general, most measures were highly positively correlated across scales, suggesting preservation of individual differences. Inter-correlations between the two coarsest templates – aal84 and parc91 – and all other scales were lower at sparser costs, particularly for clustering, likely reflecting increased fragmentation of these lower resolution networks. RW-normalization of Cnet, and Lnet largely preserved individual differences and led to higher inter-scale correlations. The pattern of inter-scale correlations for σ varied depending on whether it was computed using ER- or RW-normalization: all scales were highly positively correlated (all r > 0.70) for RW-normalization, but only pairs of scales similar in size showed high correlations for ER-normalization.
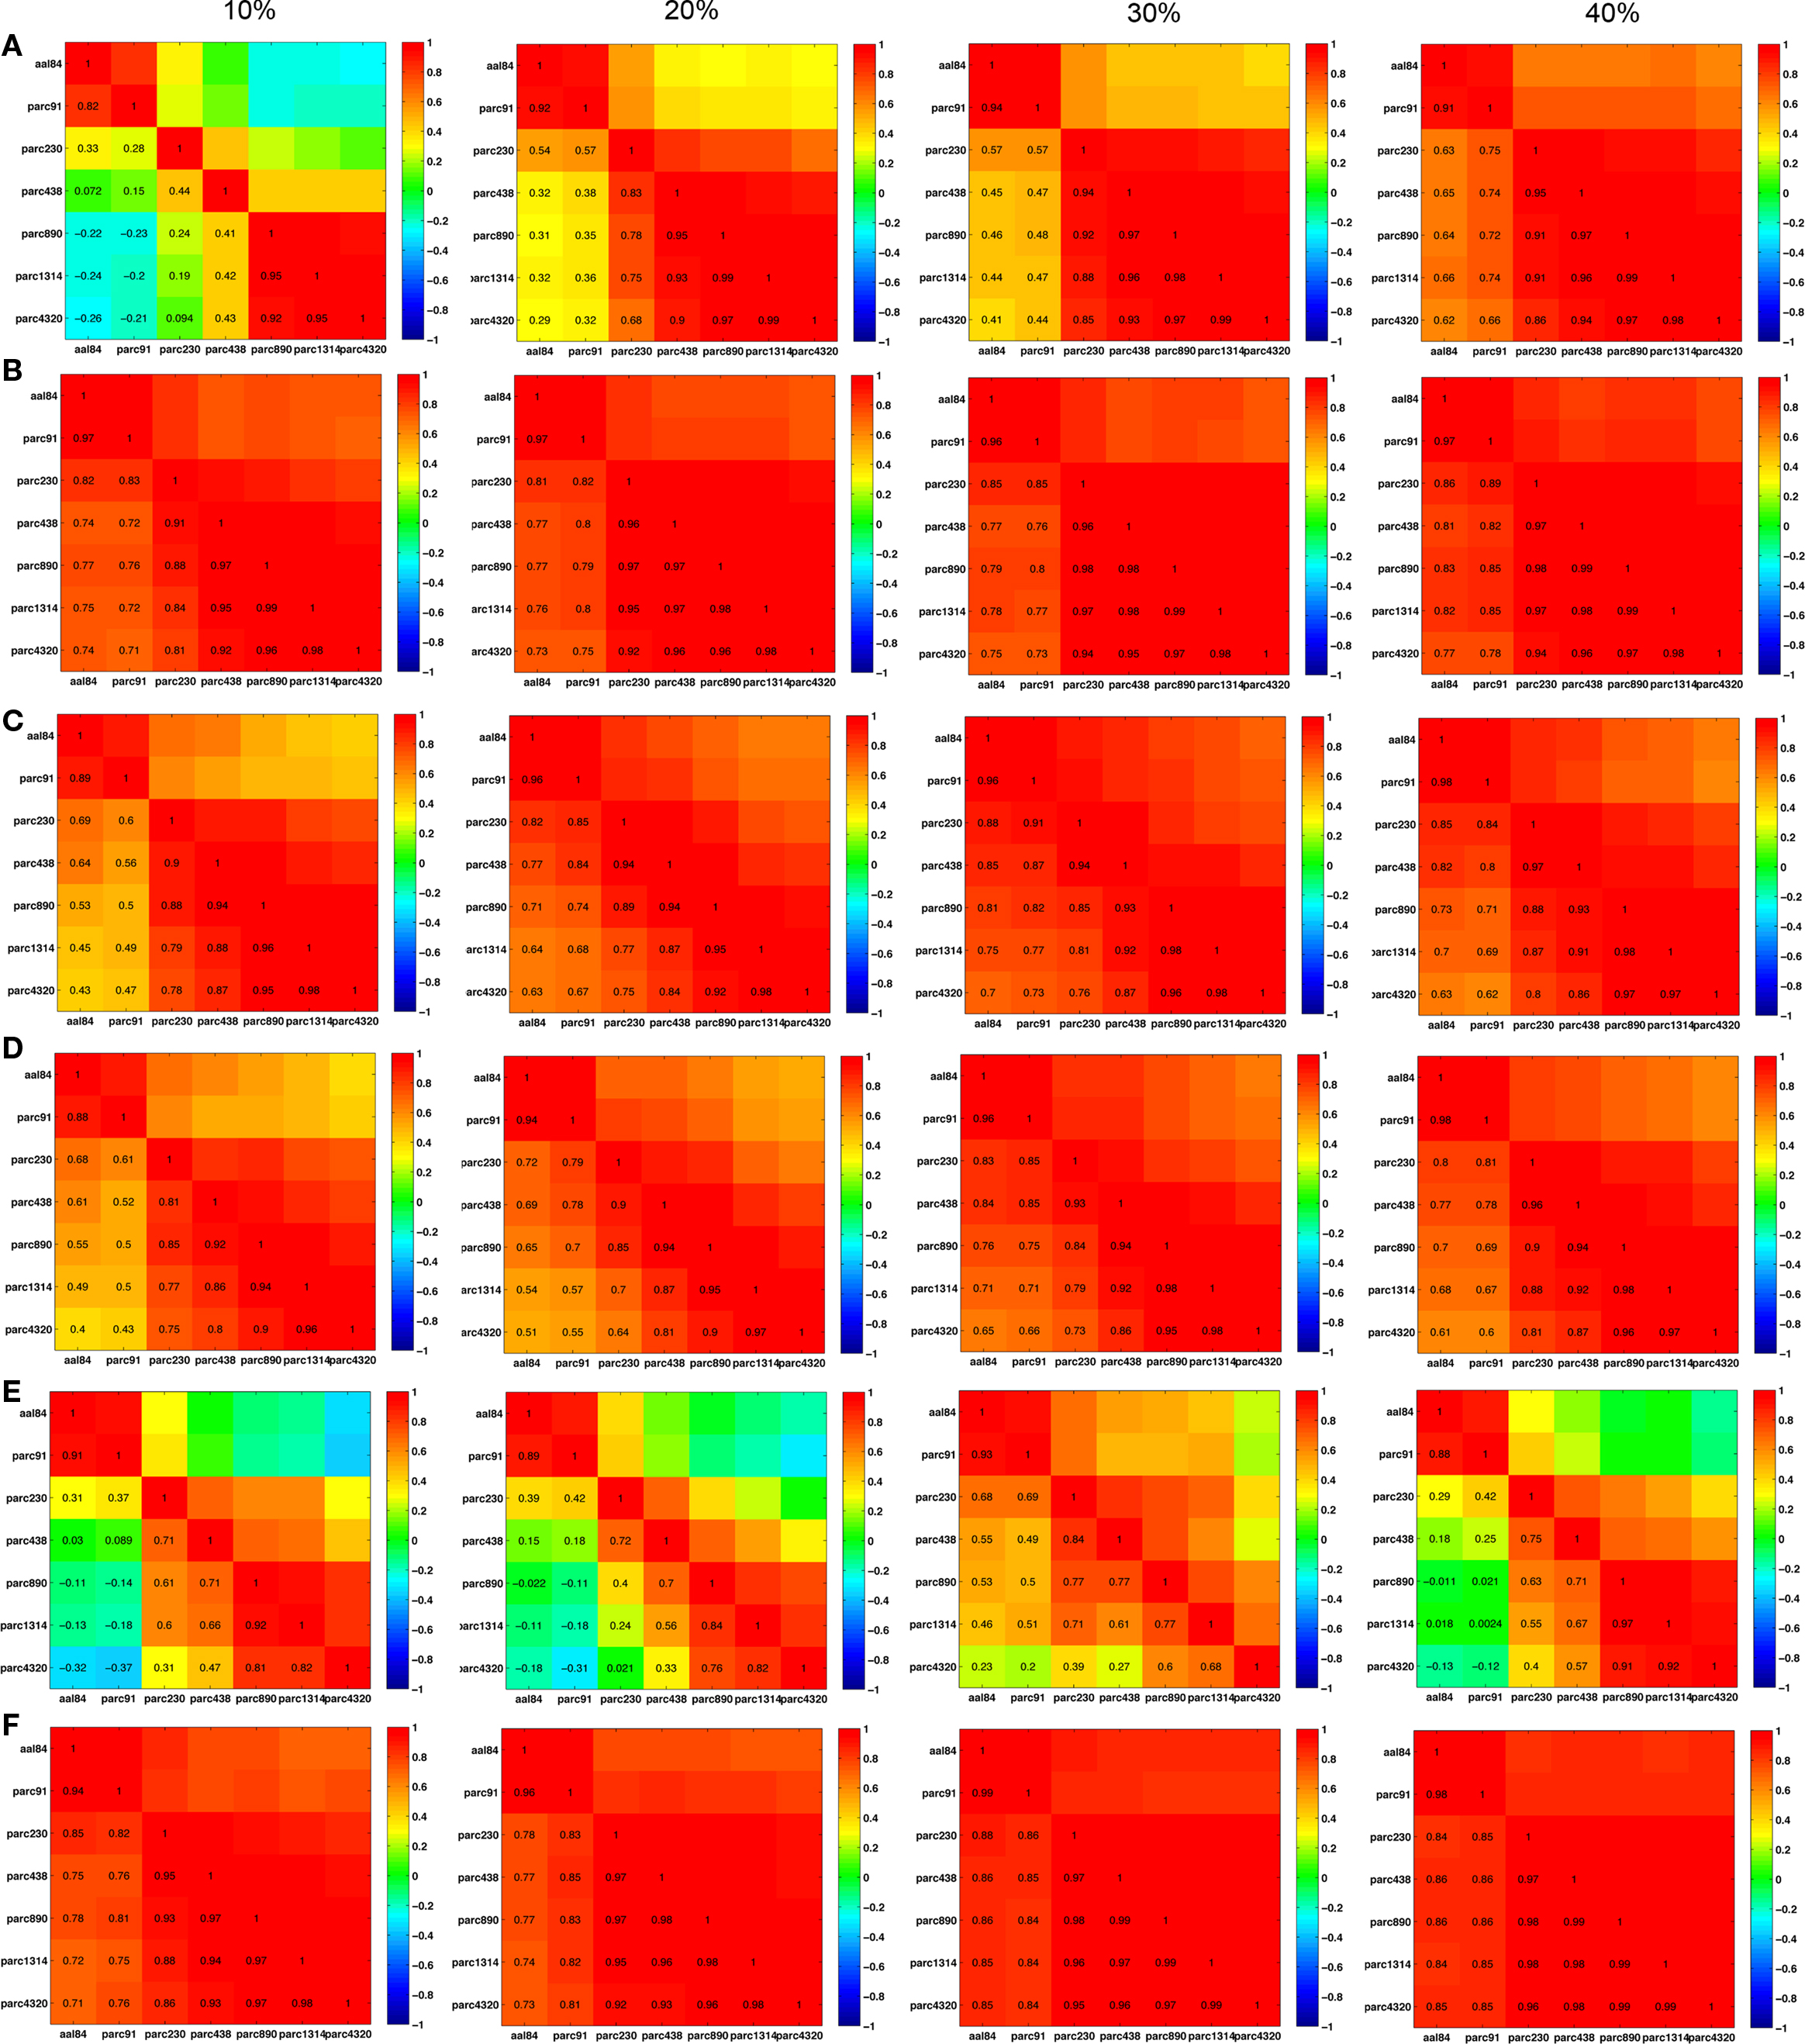
Figure 8. Inter-scale correlations in global network properties at costs of 10, 20, 30, and 40%. (A) Clustering; (B) γRW; (C) path length; (D) λRW; (E) σER; and (F) σRW.
The effects of parcellation scale on network degree distributions
Figure 9 plots the sample mean degree distributions for each parcellation scale at costs of 10, 20, 30, and 40%. The non-linearity of the curves indicates the networks were not scale-free, but rather were characterized by an exponentially truncated power-law function. For all subjects, across all parcellation scales and all costs examined, an exponentially truncated power-law provided a better fit to the data than a power-law or exponential model, as determined using the AIC.
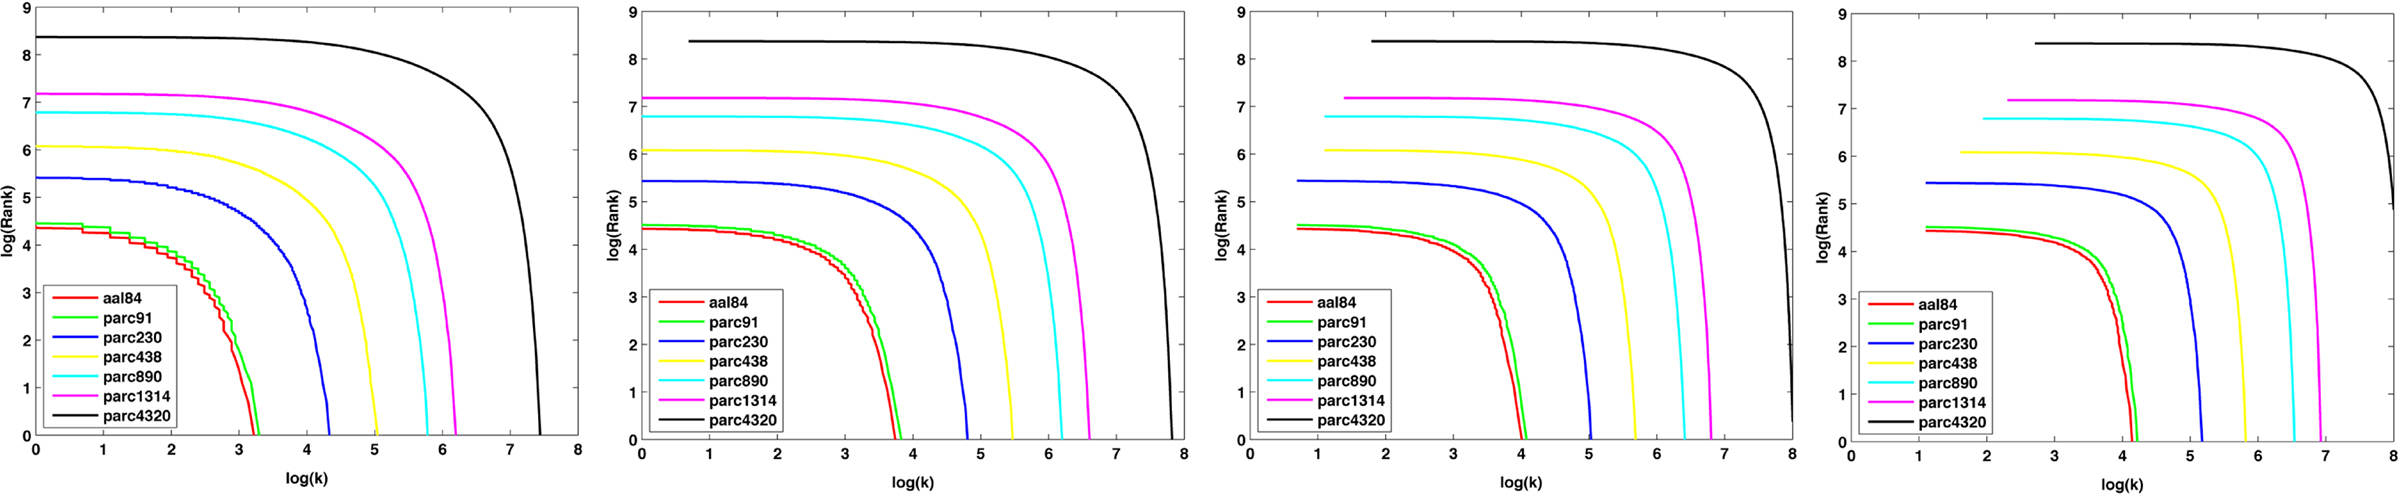
Figure 9. Log–log nodal rank-degree plots for each parcellation scale at costs of 10, 20, 30, and 40%.
The exponentially truncated power-law model fit to the data was defined as  (Achard et al., 2006
). The model was linearized by taking the logarithm of both sides and the parameters α, k, and c were fitted using least squares. The three model parameters can be interpreted as follows: α − 1 is the scaling exponent, k is the degree of the exponential cutoff (i.e., truncation point) above which the power-law becomes dominated by exponential scaling, and c is a normalization constant. The cutoff degree k models potential biological constraints on network size (e.g., head size) that preclude the formation of very rare, but highly connected hub nodes predicted by a pure power-law model. When plotting the nodal distribution function on doubly logarithmic axes, the scaling exponent, α − 1, represents the slope of the distribution over the power-law regime. However, if the cutoff degree is low, the exponential always bears some influence on the power-law, and thus the scaling exponent becomes a poor estimator of slope. This effect was observed in the present study, and so the power-law exponent should be interpreted cautiously.
(Achard et al., 2006
). The model was linearized by taking the logarithm of both sides and the parameters α, k, and c were fitted using least squares. The three model parameters can be interpreted as follows: α − 1 is the scaling exponent, k is the degree of the exponential cutoff (i.e., truncation point) above which the power-law becomes dominated by exponential scaling, and c is a normalization constant. The cutoff degree k models potential biological constraints on network size (e.g., head size) that preclude the formation of very rare, but highly connected hub nodes predicted by a pure power-law model. When plotting the nodal distribution function on doubly logarithmic axes, the scaling exponent, α − 1, represents the slope of the distribution over the power-law regime. However, if the cutoff degree is low, the exponential always bears some influence on the power-law, and thus the scaling exponent becomes a poor estimator of slope. This effect was observed in the present study, and so the power-law exponent should be interpreted cautiously.
As shown in Figure 10 , parcellations with higher spatial resolution were associated with lower values for both α − 1 and k. In particular, a marked discrepancy was evident in the fitted cutoff degree between parc4320 and all other scales. This discrepancy indicates the existence of highly connected hub nodes is less probable as the parcellation scale is made finer. This is also consistent with the finding that the network tends toward a more random topology as the scale is made finer, where nodal degrees are binomially distributed (i.e., evenly dispersed about a mean nodal degree). One interpretational caveat is that the networks differed in size, and so the descriptors of the degree distribution may not be directly comparable. The best way of normalizing such values for differences in network size remains an unresolved issue.
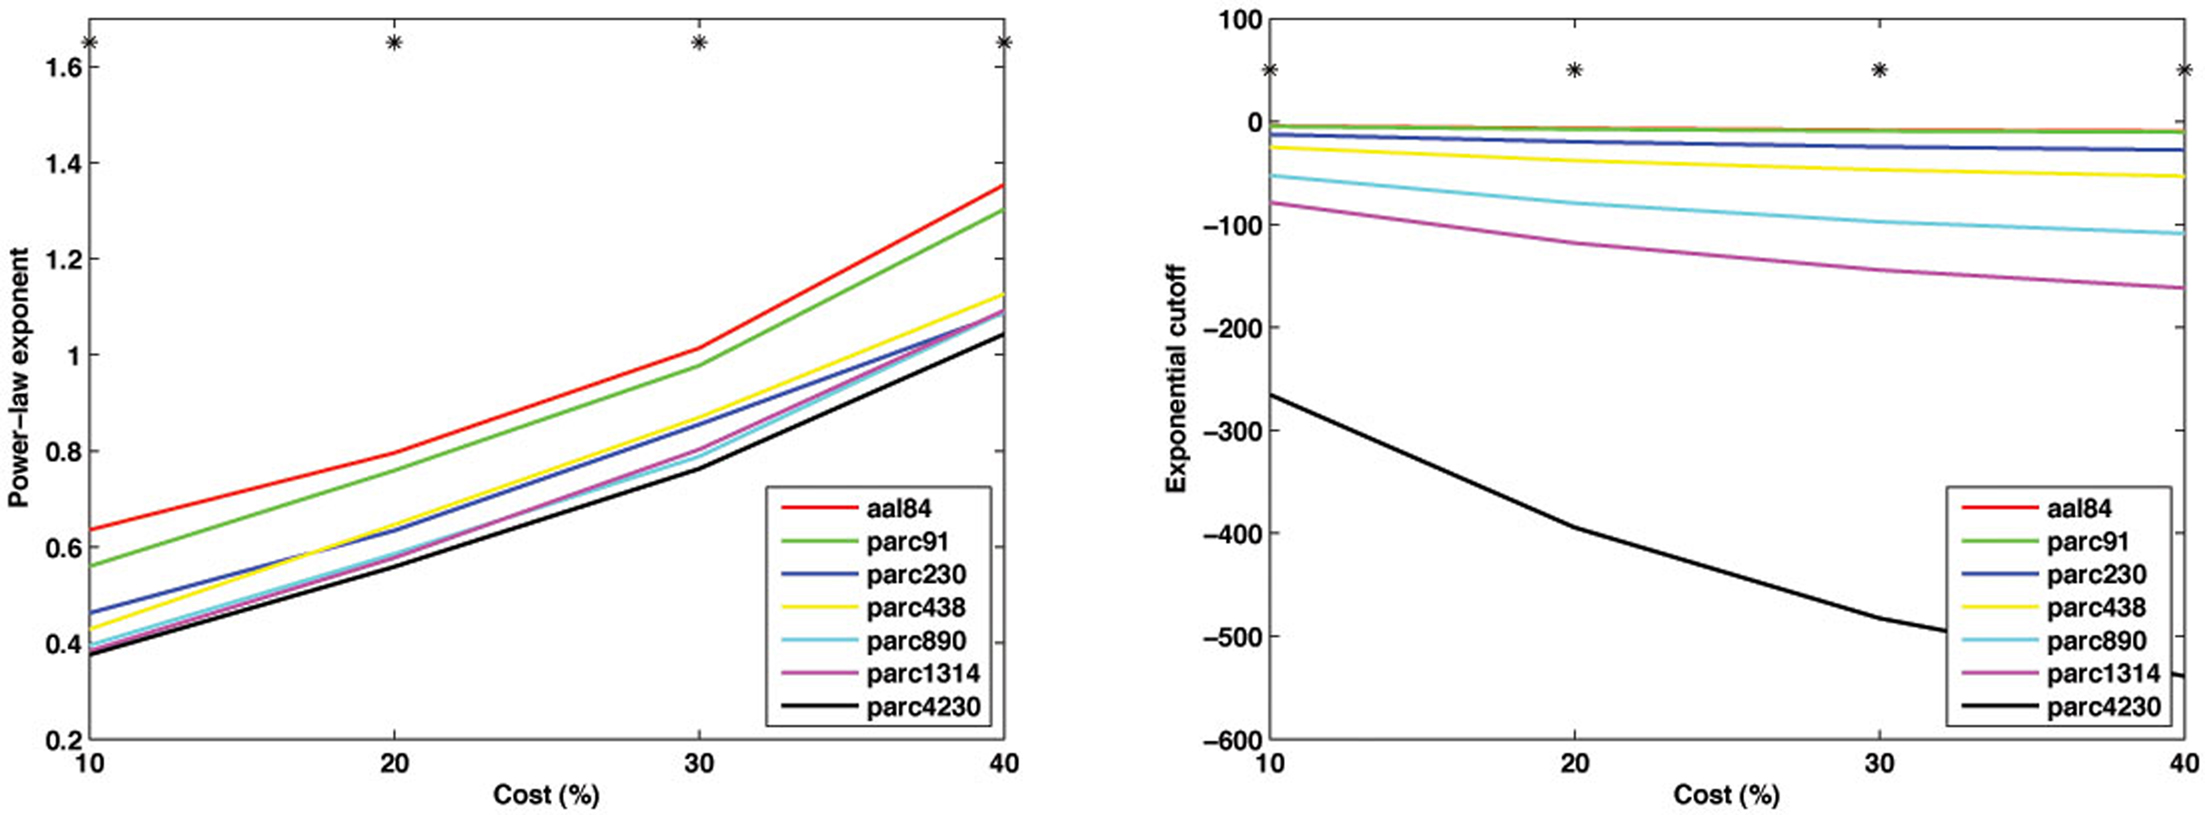
Figure 10. Mean values of the power-law exponent (slope, left) and exponential cutoff (right) of the degree distributions at each parcellation scale for costs of 10, 20, 30 and 40%. *p < 0.05.
Figure 11 plots the inter-scale pair-wise correlations for α − 1 and k. The inter-correlations were all positive and generally high, particularly between parcellations with spatial resolution equal to or greater than parc230. This suggests that, despite there being mean differences in these parameters across scales, inter-individual differences are relatively conserved.
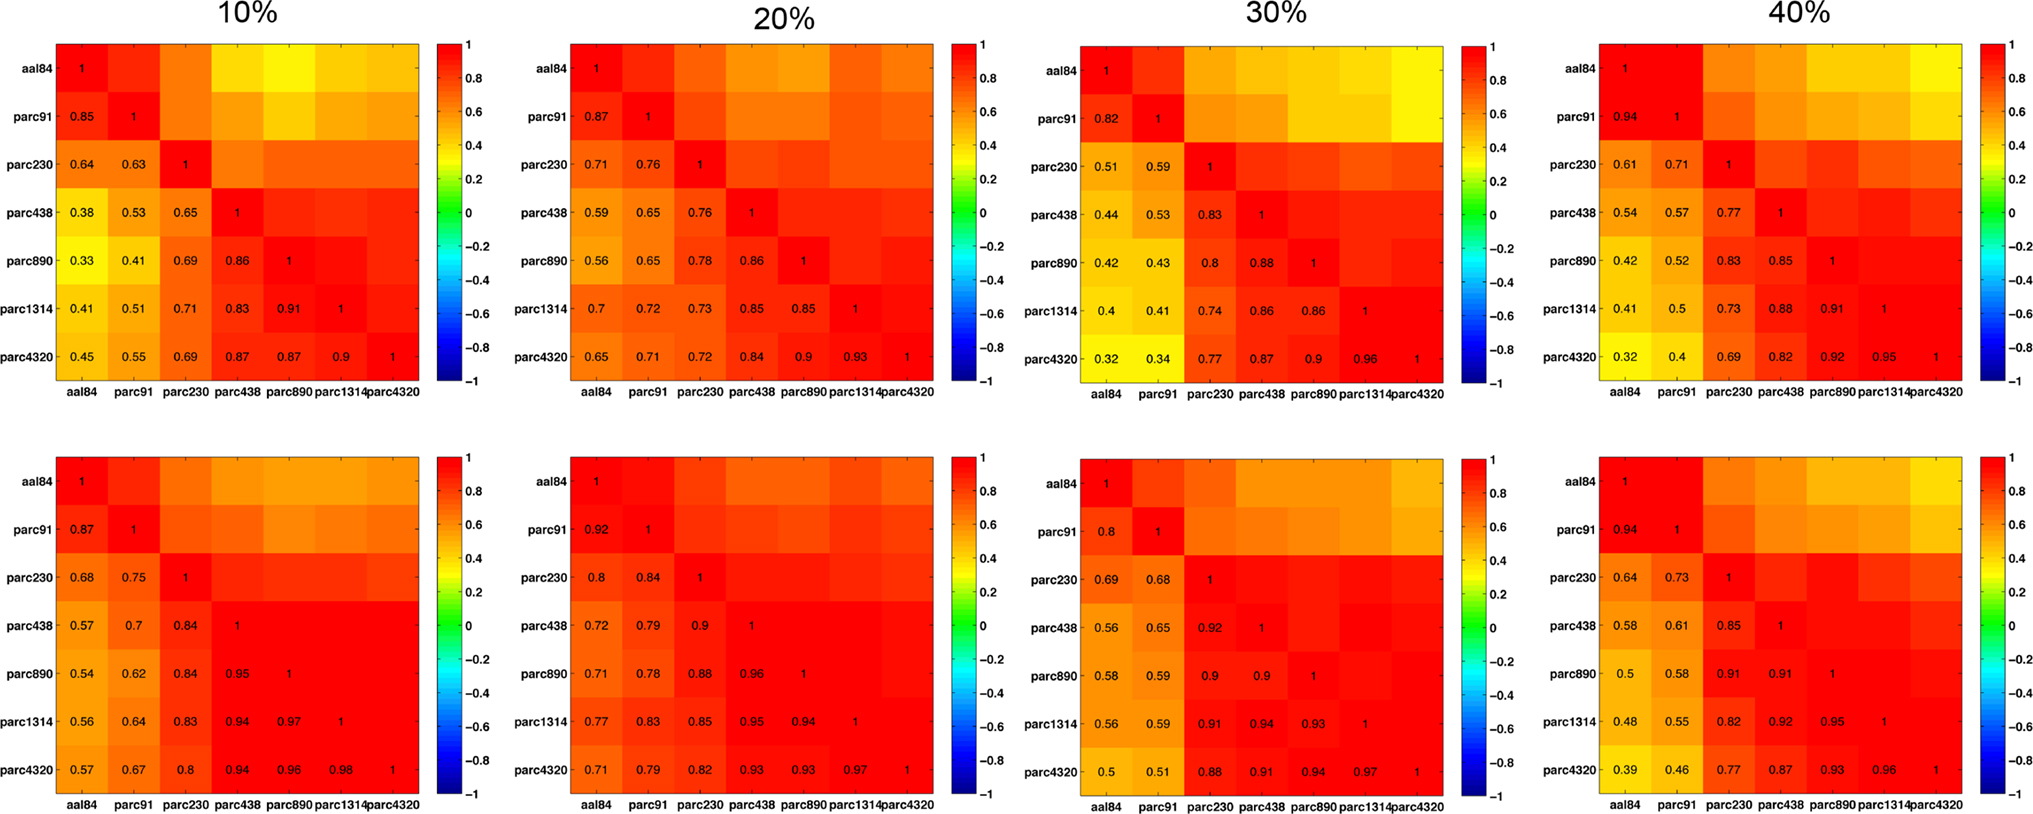
Figure 11. Inter-scale correlations in degree distribution power-law exponents (top row) and exponential cut-off values (bottom row) for costs of 10, 20, 30, and 40% (left to right columns).
The effects of parcellation scale on regional network metrics
Quantitative comparisons of how regional properties vary as a function of parcellation scale are difficult, as there is no one-to-one correspondence between ROI definitions across templates. To get an impression of how parcellation scale affected regional properties, we mapped nodal path length and clustering at each parcellation scale for networks defined at 10% cost (Figure 12 ). The results were broadly consistent across scales. Regions showing the lowest path length were primarily localized to posterior medial parietal and visual cortices, as well as lateral superior parietal, temporal and frontal regions. Regions showing the highest clustering were located in somatomotor cortices, primary visual areas, and lateral temporal and prefrontal regions. Naturally, higher resolutions afforded greater localizing power, and in some cases what seem to be larger regions of homogeneous values split into distinct clusters. For example, the precentral gyrus was one of the regions showing lowest path length at the aal84 scale, but higher resolutions indicated that this effect was mainly driven by a more focal cluster localized to superior portions of this gyrus. Thus, not surprisingly, higher resolutions afforded greater power for localizing focal effects. The results were very consistent across scales greater than parc890 however, suggesting there may be diminishing returns associated with further increases in resolution.
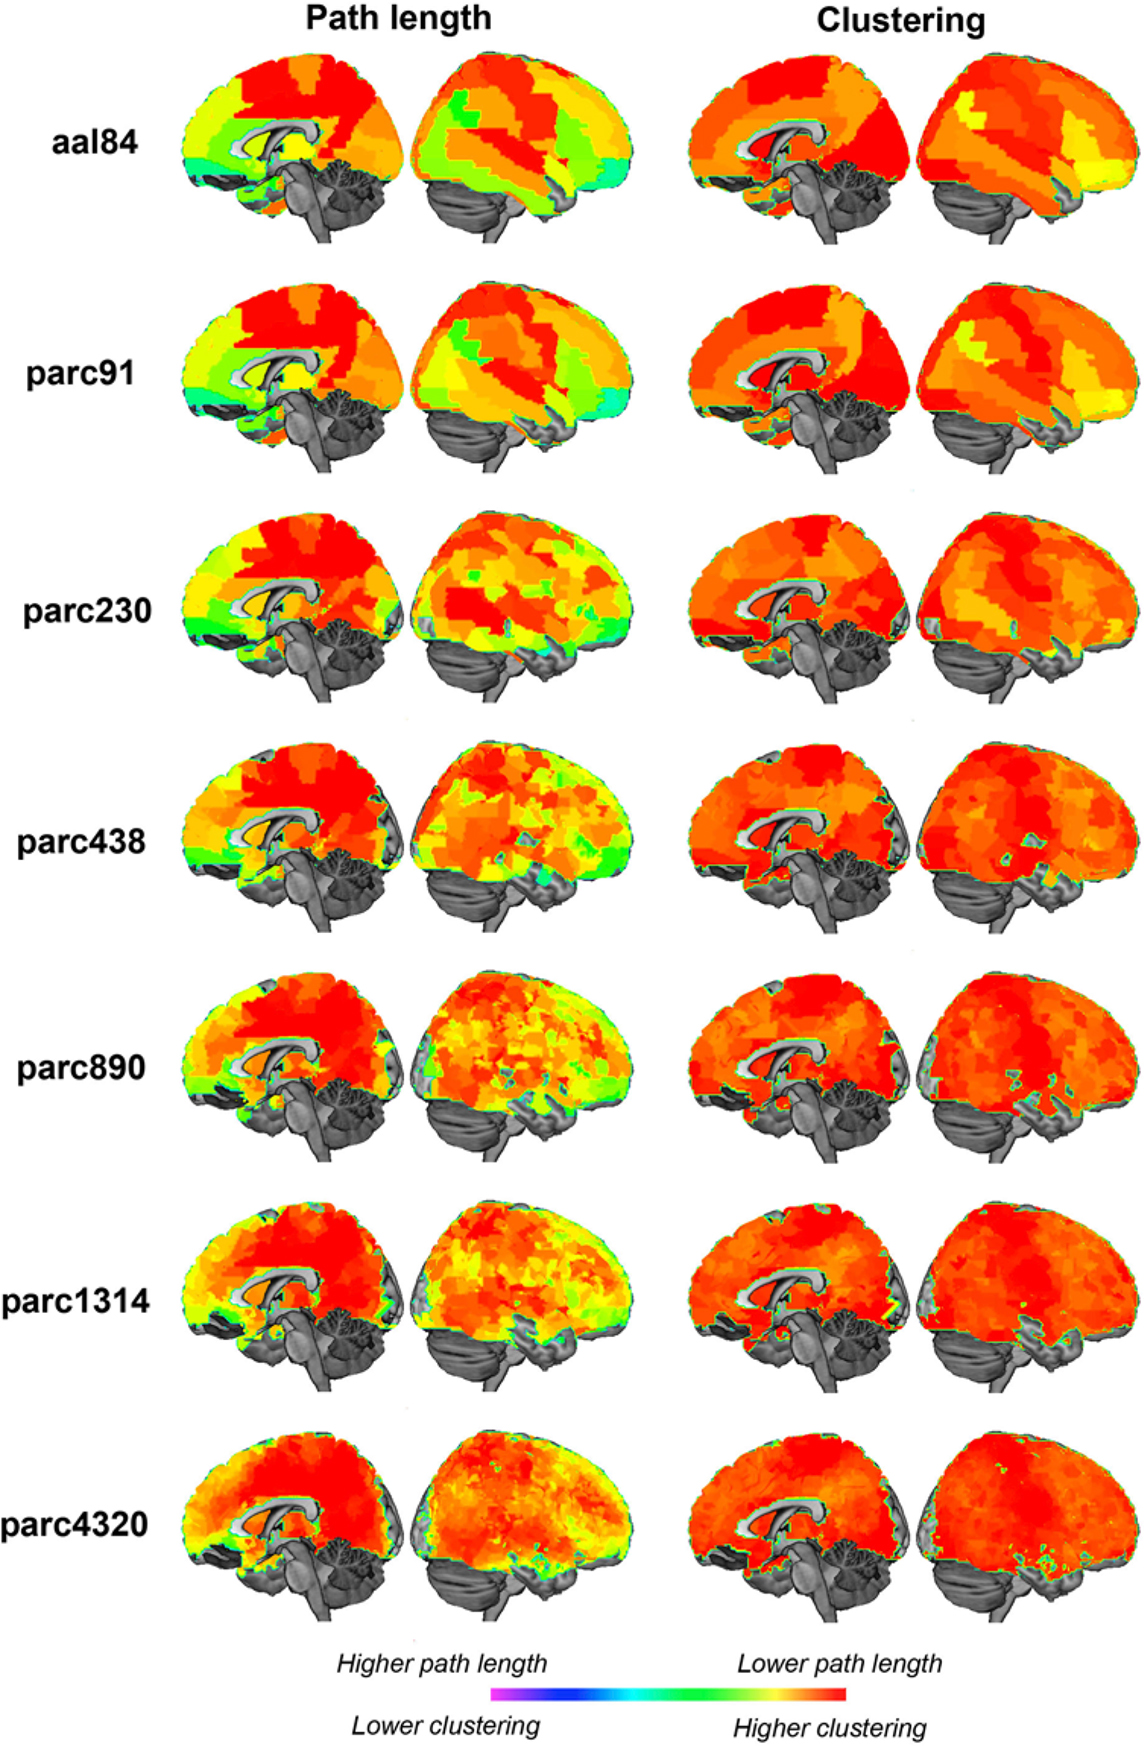
Figure 12. Medial and lateral cortical surface renderings illustrating regional variations in sample mean path length (left) and clustering (right) at each parcellation scale. Path length values have been inverted so that lower values are represented by “hotter” colors.
Discussion
The application of graph analytic techniques to fMRI data has provided researchers with a rich set of tools for characterizing brain network connectivity. An important step when conducting these analyses involves parcellating the brain into distinct regions, which serve as network nodes in graph construction. A variety of different parcellation strategies have been employed in the literature, but the effect of differences in such schemes on the findings has been unclear. In this study, we examined the effects of parcellation scale on some of the most commonly used graph analytic measures. We found that while simple inferences regarding network topology, such as whether the network is small-world or scale-free, are robust to the parcellation strategy adopted, there is considerable variation in the exact values defining key parameters of network organization. In addition, while individual differences are generally preserved across parcellation scales, the method used to generate normalized measures such as γ, λ, and σ can have a major effect. These findings highlight the need to consider the impact that variations in parcellation strategies may have on the reproducibility of findings in graph analytic studies.
The influence of parcellation scale on functional connectivity
Our findings indicate that higher resolutions were associated with lower mean correlation values. The shape of the correlation distribution was remarkably similar across scales, but each increment in spatial precision shifted the mean of the distribution closer to zero. This may reflect greater noise associated with measurements taken from smaller ROIs, which reduces the likelihood of finding strong correlations with other regions. Indeed, secondary analyses indicated that while there was a ∼7% decrease in median covariance between regional time series when moving from the coarsest (aal84) to finest (parc4320) resolution, there was a corresponding ∼38% increase in median variance of regional time series. This increased temporal variability reflects noisier measurements at higher resolutions and will reduce any pair-wise time series correlations, which represent a ratio of temporal covariance to variance. However, one attractive property of higher resolution templates was that they showed negligible correlations between regional variations in volume and functional connectivity. For coarser templates, although the median correlation was small-to-moderate ∼0.28, there was considerable inter-individual variability in the degree to which nodal size was correlated with regional connectivity; in some cases the correlations approached 0.60. This variability can add noise to analyses of group or individual differences, and reduce power to detect significant effects. In contrast, higher resolution templates were associated with both lower median correlations, and much lower inter-individual variability in correlation values, suggesting that inter-regional variations in size are less of a confound at these scales (particularly parc890 and above). These findings suggest that higher resolution templates may provide a desirable alternative to commonly used low-resolution anatomical parcellations, such as the AAL or ANIMAL templates, but these considerations need to be balanced with the increased error associated with estimation of inter-regional temporal correlations.
Inter-scale differences in global network measures
As with previous investigations (Wang et al., 2009a ; Zalesky et al., 2010 ), we found that gross topological inferences about brain networks, such as whether they are small-world or scale-free, are robust to the specific parcellation scheme employed. However, we observed significant effects of parcellation scale on the absolute values of all graph metrics across most of the costs studied, suggesting that varying network spatial resolutions are associated with sizeable changes in the specific values of key network parameters such as path length, clustering and related measures. This result is consistent with a similar analysis of anatomical networks generated using diffusion-weighted imaging (Zalesky et al., 2010 ). Together, these findings suggest that comparisons of specific values obtained by different investigators using distinct parcellation schemes should be done cautiously.
In general, coarser networks were associated with higher path length. They were also associated with reduced clustering at sparse costs, but this trend reversed for costs >25%, likely reflecting parcellation-dependent effects on network connectedness. In a fragmented network, disconnected nodes have Ci = 0, which lowers the global Cnet estimate. Coarser templates were associated with greater fragmentation at low costs, suggesting this may have affected Cnet values.
The effects of parcellation scale on network small-worldness, as indexed by σ, depended on the normalization used to compute the measure. ER-normalization showed a cost-dependent trend paralleling that observed for clustering: coarser resolutions were associated with smaller σER at costs <20%, but larger σER at higher costs. Again, this likely reflects the effects of increased network fragmentation at sparse costs for coarse scales, which would serve to increase path length and decrease clustering, producing a net reduction in small-worldness. In contrast, there was a consistent trend for higher resolutions to be associated with lower small-worldness when σ was calculated using RW-normalization. This discrepancy may reflect the fact that RW-normalization matches the observed networks for degree distribution whereas ER-normalization is comparable to matching only for size and mean degree. Thus, the RW approach normalizes the observed parameters by surrogate measures generated from networks better matched for connectivity properties. With the ER model, the probability of a path existing between a pair of nodes is always non-zero. In contrast, with RW-normalization, it is possible for no paths to exist between a pair of nodes for a particular rewiring, thus yielding an infinite path length. To avoid dealing with such infinite values, either the harmonic mean is used, the computation of path lengths is restricted to the largest connected component, or infinite path lengths are replaced with the maximum finite length. Neither of these three alternatives are consistent with the analytic expression for path length derived for the ER model. Therefore, ER- and RW-normalization differ in the way path length is defined, in addition to whether or not the degree distribution is matched to the observed network.
In contrast to our finding, previous studies examining parcellation scale-dependent effects have reported a trend for greater small-worldness at increasing resolutions, using both rs-fMRI (Hayasaka and Laurienti, 2010 ) and diffusion-imaging (Zalesky et al., 2010 ). Methodological inconsistencies may account for these findings. In their study of anatomical networks, Zalesky et al. (2010) examined relatively sparse networks unmatched for connection cost or connectedness across parcellation scales, making their results difficult to directly compare with ours. Hayasaka and Laurienti (2010) matched networks based on the lower bound for path length rather than connection cost. This lower bound was computed based on the scaling relationship observed for ER-graphs [LER = ln(N)/ln(d)], to avoid assuming a linear relationship between the number of edges and number of nodes in the network. The difficulty with this approach is that there is no guarantee that brain networks will scale similarly to random graphs, which display intrinsically different topological properties. We opted to use cost-based thresholding as it is the most straightforward and widely used method in the literature. However, the best method for thresholding graphs when comparing network parameters is an unresolved issue and requires further investigation.
The trend in our data towards lower values of σ at higher resolutions suggests a tendency towards a more random topology. This trend, combined with the generally lower functional connectivity values and increased temporal variance at these scales suggests higher resolutions may be more susceptible to noise. This contention is also supported by comparing degree distribution parameters across parcellation scales, as the parc4320 template was associated with a lower probability of finding highly connected hubs; that is, connections were distributed more evenly amongst the network nodes, as is characteristic of random graphs.
In traditional, voxel-wise analyses the data are commonly spatially smoothed to increase the signal-to-noise ratio. Smoothing is not a recommended option for graph analytic studies of fMRI data, as it will introduce spuriously high correlations between an index node and its immediate neighbors. Consequently, adopting too high a spatial resolution may be associated with a disproportionate loss in signal-to-noise. Adopting an ROI size that matches the size of the signal one wishes to detect may provide the best trade-off between spatial resolution and signal-to-noise ratio in graph analytic studies of fMRI data, although further work would be necessary to identify the precise relationship between parcellation scale and measurement signal-to-noise. Based on our findings, variations between measures obtained using parc890 and greater were relatively small compared to those obtained using coarser templates and may provide a reasonable spatial scale for exploration of network properties. Another attractive property of higher resolution templates was that they became connected at much lower costs, meaning that analyses of these networks will be less susceptible to the computational problems caused by isolated or disconnected nodes. Greater connectedness with increasing N may be a general property of most complex networks. Random graphs with mean degree (k) > ln(N) are almost surely connected (Albert and Barabasi, 2002 ), a threshold that is reached at much sparser costs in large networks. While brain networks are not equivalent to random graphs, a similar relationship between N and connectedness likely exists, as suggested by our data (see Figure 4 ).
The effects of parcellation scale on individual differences
Our analysis of mean differences suggested that parcellation scale exerted a considerable effect on the absolute values of key network parameters. However, most investigations are less concerned with estimating the absolute value of a given parameter than with assessing the effects of individual differences in these parameters. For example, researchers may want to test whether a certain network property correlates with some behavioral index (van den Heuvel et al., 2009 ), or differs between some patient and control group (Liu et al., 2008 ). Thus, if individual differences across parcellation scales are preserved, then mean differences between them become less important.
To examine how parcellation scale related to individual differences in these measures, we quantified the associations between each pair of scales for each measure at costs of 10, 20, 30, and 40%. Our findings indicated that these inter-scale associations varied depending on the specific network property and cost being studied. Estimates of path length were positively correlated between all scales and across all costs, although the correlations were greater for more densely connected networks. The explanation for this is intuitive: as more connections are added to the network, the topologies begin to resemble each other until cost = 100%, where they yield identical values across individuals. Inter-correlations between scales parc230 and higher were all >0.75, the correlations being >0.90 for scales greater than parc890. The two coarsest scales, aal84 and parc92, were highly correlated with each other, but showed lower correlations with the other scales, suggesting the results obtained at resolutions <200 regions may be less consistent with those obtained at higher resolutions. Raw clustering values were less correlated than path length, although inter-correlations between scales higher than parc890 remained high (i.e., >0.90). This likely reflects the aforementioned differences in network fragmentation. The correlations increased at higher costs suggesting that the topologies converge as more connections are added to the network. Inter-correlations for small-worldness were again dependent on the normalization method, with correlations generally being higher following RW-normalization. A corollary of these findings is that RW-normalization may lead to more reproducible findings.
Together, these data indicate that individual differences are largely preserved for scales greater than ∼200 regions, and are particularly reproducible between scales around and exceeding 1000 regions. An implication of the higher inter-correlations between scales higher than parc890 is that there may be little gain in increasing network resolution much beyond 1000 regions. That is, the values obtained at these higher scales will be highly correlated, but the time taken to compute them will be considerably longer.
Methodological considerations
Many different pre-processing steps are implemented to generate network measures in rs-fMRI analyses, each of which can affect the findings. One under-studied variation regards the choice of temporal filter to isolate the frequency band of interest. We used wavelets because they are well-suited to non-stationary processes such as BOLD signal fluctuations (Bullmore et al., 2004 ), whereas other authors have used Fourier-based approaches (Salvador et al., 2005a ; Liu et al., 2008 ). We examined the consistency between the approaches by computing intra-subject correlations between frequency-specific functional connectivity values obtained by our approach and those obtained after using a Butterworth filter (cut-offs: 0.04–0.08 Hz). Across subjects and parcellation scales, the median correlation value was 0.95, and all correlations were >0.90, suggesting good agreement between the two approaches. Nonetheless, more detailed comparison of the effects of various temporal filtering approaches may be warranted in the future.
Other methodological variations that may affect the findings include methods for correcting regional time series for physiological fluctuations, particularly as regards the so-called global correction procedure (see Birn et al., 2006 ; Fox et al., 2009 ; Murphy et al., 2009 ; Weissenbacher et al., 2009 ). An investigation of these methods was beyond the scope of this paper, but may be related to differences between ours and previous findings (Hayasaka and Laurienti, 2010 ).
We constrained all parcellation scales to fit within the grey matter mask defined by the AAL template as it promoted comparability between the different parcellation schemes used in this study. However, the AAL mask is relatively diffuse and often includes portions of white matter. This may have a more pronounced effect at higher spatial resolutions, as smaller ROIs may be entirely contained within the white matter for some individuals. While we corrected regional time series for white matter signal fluctuations, the problem posed by ROIs contained completely in the white matter is difficult to address without their removal from the network, which would alter the parts of the brain sampled across parcellation scales and result in networks constructed from differing numbers of nodes across individuals. In addition, while the AAL template is widely used in the literature, different templates may differentially sample various parts of gray matter, which may affect the results. While we expect that our findings concerning the effects of varying spatial resolution should be insensitive to the particular initial parcellation template used, this conjecture needs to be verified through further experimentation. Such work would also benefit from comparing the effects of using standard templates (e.g., AAL, ANIMAL) with more recently developed hierarchical parcellation strategies (Thirion et al., 2006 ; Pohl et al., 2007 ).
We only generated one template for each spatial scale, as the primary goal of our analysis was to investigate the effects of varying spatial resolution on different network measures. A separate question concerns the robustness of the measures across different parcellations at each scale. We have previously shown that variations in network measures generated using different parcellations at the same scale are very small, being <3% on average (Zalesky et al., 2010 ), suggesting our findings are generalizable to other parcellations at similar resolutions. In our data, this was also evident in the similar values obtained for all network measures calculated using the aal84 and parc91 templates. Despite the former being defined anatomically and the latter using our random-seeding approach, and slight differences in the number of nodes they comprise, they showed very similar values for all network properties studied. Together, these findings indicate that our results are insensitive to the specific parcellation strategy used at a given parcellation scale.
Across the range of parcellation scales examined, we found consistent evidence that functional brain networks are characterized by an exponentially truncated, so-called broad-scale degree distribution (Amaral et al., 2000 ), rather than a scale-free topology. While several authors have reported similar findings (Achard et al., 2006 ; Hagmann et al., 2007 ), scale-free properties have also been observed, particularly when networks are analyzed at voxel-wise resolution (Eguiluz et al., 2005 ; van den Heuvel et al., 2008 ). Hayasaka and Laurienti (2010) found evidence for an exponentially truncated degree distribution in their voxel-based analysis of rs-fMRI networks, suggesting this resolution will not always reveal scale-free properties. However, the degree distribution of their voxel-based network was more scale-free than that of networks studied at lower resolutions. They ascribed this trend to under-representation of low degree nodes at lower resolutions. Whether these low-degree nodes represent a biologically valid characteristic of functional brain networks, or simply reflect a limitation on signal-to-noise at this resolution, remains open to further investigation.
One criticism of using a priori templates for network node definition, as used in the current study, is that they may reduce one’s sensitivity to identifying highly connected, yet spatially focal (e.g., voxel-sized) hubs. This is because the topological dominance of such hubs may be obscured when they are grouped as part of a larger region with other voxels (Fraiman et al., 2009 ; Hayasaka and Laurienti, 2010 ), reducing sensitivity to identify power-law scaling. The typical ROI volume for the higher resolution templates used in this study was much smaller than the average volume of a typical cytoarchitectonic region, widely regarded as the primary parcellation unit of the cortex, but we still found no evidence for scale-free properties. Highly connected hubs and scale-free topologies may emerge at the resolution of cortical columns, which may be better approximated by voxel-wise approaches (van den Heuvel et al., 2008 ; Hayasaka and Laurienti, 2010 ). However, at these resolutions, limitations on the signal-to-noise of current fMRI techniques must be considered, as discussed above. Both broad-scale and scale-free properties have been observed in voxel-based imaging (van den Heuvel et al., 2008 ; Hayasaka and Laurienti, 2010 ) and microscopic functional neuronal networks (Yu et al., 2008 ; Bonifazi et al., 2009 ), suggesting further work is required to understand the conditions under which scale-free topologies emerge.
A final point worth noting is that rs-fMRI networks, by virtue of being generated from inter-regional correlations in BOLD signal fluctuations, represent a somewhat abstract basis for network definition. While correlated with underlying anatomical connectivity, additional functional connections are often present, likely reflecting the existence of polysynaptic interactions (Vincent et al., 2007 ; Honey et al., 2009 ). As such, the precise meaning of some topological properties of functional networks remains unclear and may require further validation. In addition, while it is often assumed that resting-state dynamics are stable and enduring (Damoiseaux et al., 2006 ; Shehzad et al., 2009 ), and that any topological properties measured in this state should therefore inform us about the intrinsic functional organization of the brain (Fox and Raichle, 2007 ), there is evidence to suggest rs-fMRI measures can be modulated by current or preceding psychological states (Albert et al., 2009 ; Barnes et al., 2009 ; Lewis et al., 2009 ), suggesting these measures may also index a more dynamic component of brain activity (Fornito and Bullmore, 2010 ). Thus, further investigation into the robustness of these measures is warranted.
Conclusions
In this study we examined the effects of different parcellation scales on measures of brain network organization derived from the application of graph analytic techniques to human rs-fMRI data. We found that gross topological inferences about the small-worldness or scale-freeness of the networks are robust to parcellation scale, but that the absolute values of relevant network parameters show considerable sensitivity to the spatial resolution employed. Importantly, individual differences in these measures were largely conserved when using more than 250 regions, and particularly for templates employing around 1000 regions, suggesting this scale may provide a reasonable trade-off between increased spatial resolution and attentuated signal-to-noise ratio. In addition, the confounding effects of inter-regional variations in volume were largely reduced at higher resolutions, further supporting their use in future studies. There may be diminishing returns on increasing the resolution beyond a certain point however, as reductions in signal-to-noise ratio may affect some network properties. These findings highlight the need to consider the potential impact of the methods used to generate brain networks on the findings of graph analytic studies of rs-fMRI data.
Conflict of Interest Statement
The authors declare that the research was conducted in the absence of any commercial or financial relationships that could be construed as a potential conflict of interest.
Footnotes
References
Achard, S., Bassett, D. S., Meyer-Lindenberg, A., and Bullmore, E. (2008). Fractal connectivity of long-memory networks. Phys. Rev. E. Stat. Nonlin. Soft Matter Phys. 77, 036104.
Achard, S., and Bullmore, E. (2007). Efficiency and cost of economical brain functional networks. PLoS Comput. Biol. 3, e17. doi:10.1371/journal.pcbi.0030017.
Achard, S., Salvador, R., Whitcher, B., Suckling, J., and Bullmore, E. (2006). A resilient, low-frequency, small-world human brain functional network with highly connected association cortical hubs. J. Neurosci. 26, 63–72.
Albert, N. B., Robertson, E. M., and Miall, R. C. (2009). The resting human brain and motor learning. Curr. Biol. 19, 1023–1027.
Albert, R., and Barabasi, A. L. (2002). Statistical mechanics of complex networks. Rev Modern Phys. 74, 47–97.
Albert, R., Jeong, H., and Barabasi, A. L. (2000). Error and attack tolerance of complex networks. Nature 406, 378–382.
Amaral, L. A., Scala, A., Barthelemy, M., and Stanley, H. E. (2000). Classes of small-world networks. Proc. Natl. Acad. Sci. U.S.A. 97, 11149–11152.
Barnes, A., Bullmore, E. T., and Suckling, J. (2009). Endogenous human brain dynamics recover slowly following cognitive effort. PLoS ONE 4, e6626. doi:10.1371/journal.pone.0006626.
Bauke, H. (2007). Parameter estimation for power-law distributions by maximum likelihood methods. Eur. Phys. J. B 58, 167–173.
Beckmann, C. F., DeLuca, M., Devlin, J. T., and Smith, S. M. (2005). Investigations into resting-state connectivity using independent component analysis. Philos. Trans. R. Soc. Lond. B Biol. Sci. 360, 1001–1013.
Birn, R. M., Diamond, J. B., Smith, M. A., and Bandettini, P. A. (2006). Separating respiratory-variation-related fluctuations from neuronal-activity-related fluctuations in fMRI. Neuroimage 31, 1536–1548.
Biswal, B., Yetkin, F. Z., Haughton, V. M., and Hyde, J. S. (1995). Functional connectivity in the motor cortex of resting human brain using echo-planar MRI. Magn. Reson. Med. 34, 537–541.
Boccaletti, S., Latora, V., Moreno, Y., Chavez, M., and Hwang, D.-U. (2006). Complex networks: structure and dynamics. Phys. Rep. 424, 175–308.
Bonifazi, P., Goldin, M., Picardo, M. A., Jorquera, I., Cattani, A., Bianconi, G., Represa, A., Ben-Ari, Y., and Cossart, R. (2009). GABAergic hub neurons orchestrate synchrony in developing hippocampal networks. Science (New York, NY) 326, 1419–1424.
Buckner, R. L., Sepulcre, J., Talukdar, T., Krienen, F. M., Liu, H., Hedden, T., Andrews-Hanna, J. R., Sperling, R. A., and Johnson, K. A. (2009). Cortical hubs revealed by intrinsic functional connectivity: mapping, assessment of stability, and relation to Alzheimer’s disease. J. Neurosci. 29, 1860–1873.
Bullmore, E., Fadili, J., Maxim, V., Sendur, L., Whitcher, B., Suckling, J., Brammer, M., and Breakspear, M. (2004). Wavelets and functional magnetic resonance imaging of the human brain. Neuroimage 23(Suppl. 1), S234–S249.
Bullmore, E., and Sporns, O. (2009). Complex brain networks: graph theoretical analysis of structural and functional systems. Nat. Rev. Neurosci. 10, 186–198.
Clauset, A., Shalizi, C. R., and Newman, M. E. J. (2009). Power-law distributions in empirical data. SIAM Rev. 51, 661–703.
Collins, D. L., Holmes, C., Peters, T., and Evans, A. (1995). Automatic 3D model-based neuroanatomical segmentation. Hum. Brain Mapp. 3, 190–208.
Cordes, D., Haughton, V. M., Arfanakis, K., Carew, J. D., Turski, P. A., Moritz, C. H., Quigley, M. A., and Meyerand, M. E. (2001). Frequencies contributing to functional connectivity in the cerebral cortex in “resting-state” data. AJNR Am. J. Neuroradiol. 22, 1326–1333.
Damoiseaux, J. S., Rombouts, S. A., Barkhof, F., Scheltens, P., Stam, C. J., Smith, S. M., and Beckmann, C. F. (2006). Consistent resting-state networks across healthy subjects. Proc. Natl. Acad. Sci. U.S.A. 103, 13848–13853.
Eguiluz, V. M., Chialvo, D. R., Cecchi, G. A., Baliki, M., and Apkarian, A. V. (2005). Scale-free brain functional networks. Phys. Rev. Lett. 94, 018102.
Fischl, B., van der Kouwe, A., Destrieux, C., Halgren, E., Ségonme, F., Salat, D. H., Busa, E., Seidman, L. J., Goldstein, J. M., Kennedy, D., Caviness, V., Makris, N., Rosen, B., and Dale, A. M. (2004). Anatomically parcellating the human cerebral cortex. Cereb. Cortex 14, 11–22.
Fornito, A., and Bullmore, E. T. (2010). What can spontaneous fluctuations of the blood oxygenation-level-dependent signal tell us about psychiatric disorders? Curr. Opin. Psychiatry 23, 239–249.
Fox, M. D., and Raichle, M. E. (2007). Spontaneous fluctuations in brain activity observed with functional magnetic resonance imaging. Nat. Rev. Neurosci. 8, 700–711.
Fox, M. D., Snyder, A. Z., Vincent, J. L., Corbetta, M., Van Essen, D. C., and Raichle, M. E. (2005). The human brain is intrinsically organized into dynamic, anticorrelated functional networks. Proc. Natl. Acad. Sci. U.S.A. 102, 9673–9678.
Fox, M. D., Snyder, A. Z., Zacks, J. M., and Raichle, M. E. (2006). Coherent spontaneous activity accounts for trial-to-trial variability in human evoked brain responses. Nat. Neurosci. 9, 23–25.
Fox, M. D., Zhang, D., Snyder, A. Z., and Raichle, M. E. (2009). The global signal and observed anticorrelated resting state brain networks. J. Neurophysiol. 101, 3270–3283.
Fraiman, D., Balenzuela, P., Foss, J., and Chialvo, D. R. (2009). Ising-like dynamics in large-scale functional brain networks. Phys. Rev. E. Stat. Nonlin. Soft Matter Phys. 79, 061922.
Hagmann, P., Cammoun, L., Gigandet, X., Meuli, R., Honey, C. J., Wedeen, V. J., and Sporns, O. (2008). Mapping the structural core of human cerebral cortex. PLoS Biol. 6, e159. doi:10.1371/journal.pcbi.1000748.
Hagmann, P., Kurant, M., Gigandet, X., Thiran, P., Wedeen, V. J., Meuli, R., and Thiran, J. P. (2007). Mapping human whole-brain structural networks with diffusion MRI. PLoS ONE 2, e597. doi:10.1371/journal.pone.0000597.
Hayasaka, S., and Laurienti, P. J. (2010). Comparison of characteristics between region-and voxel-based network analyses in resting-state fMRI data. Neuroimage 50, 499–508.
He, Y., Dagher, A., Chen, Z., Charil, A., Zijdenbos, A., Worsley, K., and Evans, A. (2009). Impaired small-world efficiency in structural cortical networks in multiple sclerosis associated with white matter lesion load. Brain 132, 3366–3379.
Hesselmann, G., Kell, C. A., Eger, E., and Kleinschmidt, A. (2008). Spontaneous local variations in ongoing neural activity bias perceptual decisions. Proc. Natl. Acad. Sci. U.S.A. 105, 10984–10989.
Honey, C. J., Sporns, O., Cammoun, L., Gigandet, X., Thiran, J. P., Meuli, R., and Hagmann, P. (2009). Predicting human resting-state functional connectivity from structural connectivity. Proc. Natl. Acad. Sci. U.S.A. 106, 2035–2040.
Humphries, M. D., Gurney, K., and Prescott, T. J. (2006). The brainstem reticular formation is a small-world, not scale-free, network. Proc. Biol. Sci. 273, 503–511.
Jenkinson, M., and Smith, S. (2001). A global optimisation method for robust affine registration of brain images. Med. Image Anal. 5, 143–156.
Kelly, A. M., Uddin, L. Q., Biswal, B. B., Castellanos, F. X., and Milham, M. P. (2008). Competition between functional brain networks mediates behavioral variability. Neuroimage 39, 527–537.
Latora, V., and Marchiori, M. (2001). Efficient behavior of small-world networks. Phys. Rev. Lett. 5,198701.
Latora, V., and Marchiori, M. (2003). Economic small-world behavior in weighted networks. Eur. Phys. J. B 32, 249–263.
Lewis, C. M., Baldassarre, A., Committeri, G., Romani, G. L., and Corbetta, M. (2009). Learning sculpts the spontaneous activity of the resting human brain. Proc. Natl. Acad. Sci. U.S.A. 106, 17558–17563.
Liu, L., Alderson, D., Doyle, J. C., and Willinger, W. (2005). Towards a theory of scale-free graphs: definitions, properties and implications. Internet Math. 2, 431–523.
Liu, Y., Liang, M., Zhou, Y., He, Y., Hao, Y., Song, M., Yu, C., Liu, H., Liu, Z., and Jiang, T. (2008). Disrupted small-world networks in schizophrenia. Brain 131, 945–961.
Maslov, S., and Sneppen, K. (2002). Specificity and stability in topology of protein networks. Science (New York, NY) 296, 910–913.
Meunier, D., Lambiotte, R., Fornito, A., Ersche, K. D., and Bullmore, E. T. (2009). Hierarchical modularity in human brain functional networks. Front. Neuroinformatics 3, 37. doi:10.3389/neuro.11.037.2009.
Murphy, K., Birn, R. M., Handwerker, D. A., Jones, T. B., and Bandettini, P. A. (2009). The impact of global signal regression on resting state correlations: are anti-correlated networks introduced? Neuroimage 44, 893–905.
Nir, Y., Fisch, L., Mukamel, R., Gelbard-Sagiv, H., Arieli, A., Fried, I., and Malach, R. (2007). Coupling between neuronal firing rate, gamma LFP, and BOLD fMRI is related to interneuronal correlations. Curr. Biol. 17, 1275–1285.
Percival, D. B., and Walden, A. T. (2000). Wavelet Methods for Time Series Analysis. Cambridge: Cambridge University Press.
Pohl, K. M., Bouix, S., Nakamura, M., Rohlfing, T., McCarley, R. W., Kikinis, R., Grimson, W. E. L., Shenton, M. E., and Wells, W. M. (2007). A hierarchical algorithm for MR brain image parcellation. IEEE Trans. Med. Imaging 26, 1201–1212.
Rubinov, M., and Sporns, O. (2009). Complex network measures of brain connectivity: uses and interpretations. Neuroimage. [Epub ahead of print].
Salvador, R., Martinez, A., Pomarol-Clotet, E., Gomar, J., Vila, F., Sarro, S., Capdevila, A., and Bullmore, E. (2008). A simple view of the brain through a frequency-specific functional connectivity measure. Neuroimage 39, 279–289.
Salvador, R., Suckling, J., Coleman, M. R., Pickard, J. D., Menon, D., and Bullmore, E. (2005a). Neurophysiological architecture of functional magnetic resonance images of human brain. Cereb. Cortex 15, 1332–1342.
Salvador, R., Suckling, J., Schwarzbauer, C., and Bullmore, E. (2005b). Undirected graphs of frequency-dependent functional connectivity in whole brain networks. Philos. Trans. R. Soc. Lond. B Biol. Sci. 360, 937–946.
Seeley, W. W., Menon, V., Schatzberg, A. F., Keller, J., Glover, G. H., Kenna, H., Reiss, A. L., and Greicius, M. D. (2007). Dissociable intrinsic connectivity networks for salience processing and executive control. J. Neurosci. 27, 2349–2356.
Shehzad, Z., Kelly, A. M., Reiss, P. T., Gee, D. G., Gotimer, K., Uddin, L. Q., Lee, S. H., Margulies, D. S., Roy, A. K., Biswal, B. B., Petkova, E., Castellanos, F. X., and Milham, M. P. (2009). The resting brain: unconstrained yet reliable. Cereb. Cortex 19, 2209–2229.
Shmuel, A., and Leopold, D. A. (2008). Neuronal correlates of spontaneous fluctuations in fMRI signals in monkey visual cortex: Implications for functional connectivity at rest. Hum. Brain Mapp. 29, 751–761.
Smith, S. M., Fox, P. T., Miller, K. L., Glahn, D. C., Fox, P. M., Mackay, C. E., Filippini, N., Watkins, K. E., Toro, R., Laird, A. R., and Beckmann, C. F. (2009). Correspondence of the brain’s functional architecture during activation and rest. Proc. Natl. Acad. Sci. U.S.A. 106, 13040–13045.
Sporns, O., Tononi, G., and Kotter, R. (2005). The human connectome: a structural description of the human brain. PLoS Comput. Biol. 1, e42. doi:10.1371/journal.pcbi.0010042.
Thirion, B., Flandin, G., Pinel, P., Roche, A., Ciuciu, P., and Poline, J. B. (2006). Dealing with the shortcomings of spatial normalization: multi-subject parcellation of fMRI datasets. Hum. Brain Mapp. 27, 678–693.
Tzourio-Mazoyer, N., Landeau, B., Papathanassiou, D., Crivello, F., Etard, O., Delcroix, N., Mazoyer, B., and Joliot, M. (2002). Automated anatomical labeling of activations in SPM using a macroscopic anatomical parcellation of the MNI MRI single-subject brain. Neuroimage 15, 273–289.
van den Heuvel, M. P., Stam, C. J., Boersma, M., and Hulshoff Pol, H. E. (2008). Small-world and scale-free organization of voxel-based resting-state functional connectivity in the human brain. Neuroimage 43, 528–539.
van den Heuvel, M. P., Stam, C. J., Kahn, R. S., and Hulshoff Pol, H. E. (2009). Efficiency of functional brain networks and intellectual performance. J. Neurosci. 29, 7619–7624.
Vincent, J. L., Patel, G. H., Fox, M. D., Snyder, A. Z., Baker, J. T., Van Essen, D. C., Zempel, J. M., Snyder, L. H., Corbetta, M., and Raichle, M. E. (2007). Intrinsic functional architecture in the anaesthetized monkey brain. Nature 447, 83–86.
Wang, J., Wang, L., Zang, Y., Yang, H., Tang, H., Gong, Q., Chen, Z., Zhu, C., and He, Y. (2009a). Parcellation-dependent small-world brain functional networks: a resting-state fMRI study. Hum. Brain Mapp. 30, 1511–1523.
Wang, L., Zhu, C., He, Y., Zang, Y., Cao, Q., Zhang, H., Zhong, Q., and Wang, Y. (2009b). Altered small-world brain functional networks in children with attention-deficit/hyperactivity disorder. Hum. Brain Mapp. 30, 638–649.
Weissenbacher, A., Kasess, C., Gerstl, F., Lanzenberger, R., Moser, E., and Windischberger, C. (2009). Correlations and anticorrelations in resting-state functional connectivity MRI: a quantitative comparison of preprocessing strategies. Neuroimage 47, 1408–1416.
Yu, S., Huang, D., Singer, W., and Nikolic, D. (2008). A small world of neuronal synchrony. Cereb. Cortex 18, 2891–2901.
Keywords: spontaneous, BOLD, complex, cortex
Citation: Fornito A, Zalesky A and Bullmore ET (2010) Network scaling effects in graph analytic studies of human resting-state fMRI data. Front. Syst. Neurosci. 4:22. doi: 10.3389/fnsys.2010.00022
Received: 29 January 2010;
Paper pending published: 27 February 2010;
Accepted: 19 May 2010;
Published online: 17 June 2010
Edited by:
Lucina Q. Uddin, Stanford University, USAReviewed by:
Mika Rubinov, The University of New South Wales, AustraliaJason Bohland, Boston University, USA
Dante R. Chialvo, Northwestern University, USA
Copyright: © 2010 Fornito, Zalesky and Bullmore. This is an open-access article subject to an exclusive license agreement between the authors and the Frontiers Research Foundation, which permits unrestricted use, distribution, and reproduction in any medium, provided the original authors and source are credited.
*Correspondence: Alex Fornito, Melbourne Neuropsychiatry Centre, Levels 2 & 3, 161 Barry St, Carlton South, Victoria, 3053 Australia. e-mail: af397@cam.ac.uk