


Abstract
Background. Pre-school children are frequent users of health services, but little contemporary data are available describing their symptoms or why they consult.
Objective. To describe symptom and consultation prevalence in pre-school children and to identify the socio-demographic factor or factors associated with consultations for those symptoms.
Methods. Prospective cohort study of 13 617 pre-school children living in south-west England. Parents completed questionnaires asking about symptoms and consultations for those symptoms at six, 18, 30, 42 and 57 months.
Results. During the pre-school years, all children experienced one or more symptoms, most commonly cold, cough, high temperature, vomiting or diarrhoea. Ninety seven percent consulted a doctor at least once, most commonly for cough, high fever and/or earache. Lower parity was most strongly and consistently associated with higher consultation rates.
Conclusions. Fever, respiratory and gastro-intestinal symptoms are a normal part of pre-school life. Research of acute conditions in young children could focus on the most common symptoms leading to consultation, namely cough, fever and earache. Efforts to support parents' help seeking decision making might usefully be targeted at first time parents.
Hay AD, Heron J, Ness A and the ALSPAC study team. The prevalence of symptoms and consultations in pre-school children in the Avon Longitudinal Study of Parents and Children (ALSPAC): a prospective cohort study. Family Practice 2005; 22: 367–374.
Introduction
Pre-school children suffer frequent episodes of illness leading to more primary care consultations than any other age group.1 Two previous studies have reported the reasons for consultation by diagnosis.1,2 However, GPs are inconsistent in their use of diagnostic labels,3,4 and precise diagnoses can often only be made in retrospect. Therefore, leading investigators have called for research of acute problems in primary care to be based on presenting symptoms rather than disease categories.4,5 Studies which have examined the frequency of symptom presentations include one that described clinical practice thirty years ago6 and two more recent studies that investigated symptoms in 300 children for two years from birth7 and 1805 children aged 0 to 14 years over a three week period.8 Previous studies that have examined the relationship between symptoms and consultations and identified the factors (independent of symptoms) that lead to consultations have shown conflicting results regarding the relationship between socio-economic deprivation and higher consultations.9,10 Clarification is required if the health service is to better manage demand and for researchers to prioritise the symptoms to investigate. We therefore aimed to describe symptom and consultation prevalence and identify the socio-demographic factors associated with consultations for those symptoms, during the pre-school years in a large community based cohort of children in south-west England.
Methods
Data collection
The Avon Longitudinal Study of Parents and Children (ALSPAC) enrolled pregnant women resident in Avon with an expected date of delivery between 1st April 1991 and 31st December 1992.11 Mothers were informed about the study in a number of ways: posters were displayed in chemist shops, libraries, mother and toddler groups, and pre-school playgroups, GP waiting-rooms, antenatal clinics and any other area where a mother was likely to be in early pregnancy. In addition, ALSPAC staff approached mothers when they attended hospital for their routine ultrasound scan, information was sent by the hospital with the women's booking information, and local community midwives discussed the study when meeting each expectant woman for the first time. 14 541 women were enrolled and 13 617 had singleton offspring surviving at 12 months. At enrolment and prior to delivery, questionnaires were administered that measured socio-demographic variables including the mother's parity, the mother's highest educational attainment and housing tenure. Symptom and consultation prevalence were measured using postnatal questionnaires sent when the child was six, 18, 30, 42 and 57 months old. Attrition was minimised using a number of measures including raising the study profile in the national and local media, sending parents newsletters every four months and sending children birthday cards.11 Each questionnaire (see Fig. 1) listed 14 symptoms (diarrhoea, blood in stools, vomiting, cough, high temperature, snuffles/cold, ear ache, ear discharge (pus not wax), convulsions/fits, colic/stomach ache, rash, wheezing, breathlessness, episodes of stopping breathing) and a free text ‘other’ question. Parent/guardians were asked whether the child had experienced each symptom in the period since the previous questionnaire and if a doctor had been seen as a result. Responses to the 14 questions were used from the first two questionnaires and an additional response (headache) was taken from the latter three. The question on colic in the six and 18-month questionnaires was replaced with stomach-ache in the later ones. We examined the free text ‘other’ responses to ensure we were not overlooking another common symptom not appearing among the 14 requested symptoms. Further details of the study aims and design are available on http://www.alspac.bris.ac.uk/. The ALSPAC law and ethics and the local research ethics committees approved the data collection.
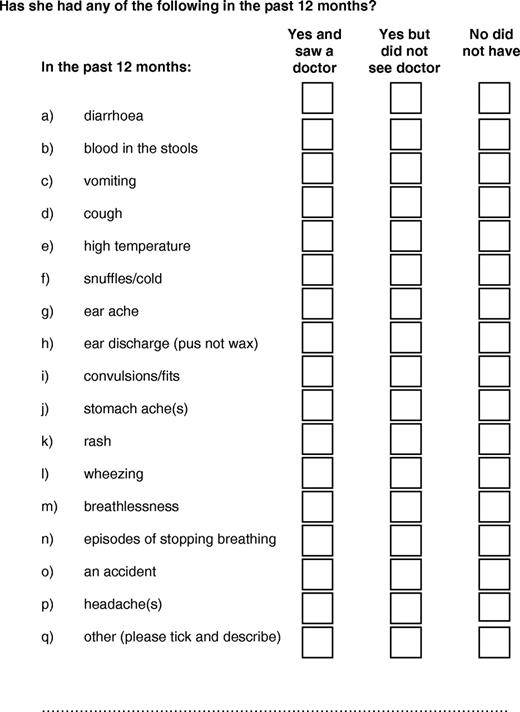
Example questionnaire at 42 months
Data analysis
We used SPSS version 12 to analyse these data. Symptoms for each age group were ranked by prevalence as was the proportion of the total population who consulted. For each age group, and for the five-year interval as a whole, variables were then derived showing whether any of the symptoms had been reported and whether this had resulted in a consultation. These summary measures were used to build a picture of a typical pre-school child describing the number of symptoms and consultations. Since attrition is known to be related to deprivation11 and deprivation may be related to both symptom and consultation prevalence, we sought to examine the effect of attrition on our estimates of symptom and consultation rates, specifically to see if attrition was associated with an underestimation of symptoms and consultations in our sample of 7727 with complete data. To test this, the respondents at 30 months (9933 cases) were divided into groups determined by the number of other symptom questionnaires they completed, and the groups compared for the mean number of symptoms, consultations and the prevalence of each symptom and their associated consultations.
Finally, we explored the relationship between consultations for those symptoms and the socio-demographic variables measured during the antenatal period and the child's gender and mother's age at delivery. Since some of these factors (for example mother's age and parity at delivery) are likely to be correlated, multivariable logistic regression was used to examine the independent relationship between each factor and the outcome following adjustment for the remaining factors.
Results
Response rates
The sample of 13 617 children (singleton births alive at one year) was taken as the eligible cohort for these analyses. Response rates were 11 193 (82%) at the six-month questionnaire, 10 836 (80%) at 18 months, 9933 (73%) at 30 months, 9819 (72%) at 42 months and 9289 (68%) for the 57-month questionnaire. A total of 7865 (57.8%) returned all five questionnaires. Most attrition was temporary, where non-responding parents accepted an invitation to rejoin the study, but less commonly children died or moved out of the study area. Among questionnaires returned, responses were not always complete. For example, 92% of those who completed the six-month questionnaire gave us 14 full answers and 94% for the 57-month questionnaire. To improve on this, non-completion was assumed to indicate the absence of the symptom, provided at least one question was answered. Since the scale of this imputation was small compared to the amount of data that would have been lost had we eliminated partially completed questionnaires, we believe it is more likely to give a true representation of actual prevalence. This procedure increased the completion rate to 98% within each questionnaire. The final number with compete data across all five questionnaires was 7727.
Symptom and consultation prevalence
Table 1 shows the proportion of children experiencing each symptom for each age group. In order of prevalence, the symptoms cold, cough, high fever, colic/stomach ache, diarrhoea and vomiting were very common symptoms occurring in at least half of children during at least one age group. The symptoms rash, earache, wheeze and headache were common affecting at least 20% of children during at least one age group, while shortness of breath, ear discharge, blood in the stools, stopped breathing and convulsions were less common, affecting no more than 10% of children in any age group. As a proportion of all respondents to the questionnaires at six, 18, 30, 42 and 57 months there were free text responses respectively in 14%, 7%, 9%, 11% and 9%. The most common problem reported was chicken pox, which as a proportion of all respondents was reported in 1.1%, 1.4%, 1.6%, 2.8% and 1.8% respectively, suggesting our original 14 questions did not overlook another common symptom. Table 2 shows the proportion of all children presenting to doctors with each symptom. At least 25% of all children consulted with cough, high fever, earache, rash, cold or diarrhoea in at least one age group.
The proportion (%) of all children in the Avon Longitudinal Study of Parents and Children (ALSPAC) with symptoms reported in the periods up to 6 months, 6 to 17, 18 to 29, 30 to 41 and 42 to 57 monthsa
| Symptom | <6 months | 6 to 17 months | 18 to 29 months | 30 to 41 months | 42 to 56 months |
|---|---|---|---|---|---|
| Cold | 88% | 95% | 94% | 94% | 96% |
| Cough | 65% | 84% | 86% | 88% | 92% |
| Colic/stomach ache | 40% | 8% | 27% | 35% | 52% |
| High temperature | 39% | 68% | 67% | 63% | 74% |
| Rash | 38% | 45% | 37% | 23% | 27% |
| Diarrhoea | 33% | 61% | 56% | 44% | 59% |
| Vomited | 31% | 56% | 61% | 54% | 70% |
| Wheeze | 22% | 24% | 20% | 16% | 16% |
| Earache | 10% | 33% | 32% | 31% | 41% |
| Breathlessness | 6% | 8% | 8% | 8% | 8% |
| Blood in stools | 4% | 3% | 3% | 2% | 2% |
| Ear discharge | 3% | 7% | 6% | 5% | 7% |
| Stopped breathing | 2% | 2% | 2% | 1% | 1% |
| Convulsions | 1% | 2% | 2% | 1% | 2% |
| Headache | 7% | 15% | 32% |
Time periods cannot be compared due to differing questionnaire intervals.
Proportion (%) of all children in the Avon Longitudinal Study of Parents and Children (ALSPAC) consulting by symptom in the periods up to 6 months, 6 to 17, 18 to 29, 30 to 41 and 42 to 57 monthsa
| Symptom | <6 months | 6 to 17 months | 18 to 29 months | 30 to 41 months | 42 to 56 months |
|---|---|---|---|---|---|
| Cough | 40% | 42% | 34% | 27% | 29% |
| Cold | 34% | 21% | 14% | 12% | 9% |
| Rash | 22% | 29% | 22% | 11% | 14% |
| High temperature | 20% | 39% | 33% | 25% | 27% |
| Wheeze | 17% | 19% | 15% | 11% | 11% |
| Diarrhoea | 16% | 27% | 17% | 8% | 9% |
| Vomited | 16% | 25% | 19% | 11% | 11% |
| Colic/stomach ache | 11% | 3% | 6% | 5% | 6% |
| Earache | 9% | 30% | 28% | 25% | 31% |
| Breathlessness | 5% | 7% | 7% | 6% | 7% |
| Ear discharge | 2% | 6% | 5% | 5% | 6% |
| Blood in stools | 2% | 2% | 1% | 1% | 1% |
| Stopped breathing | 2% | 1% | 1% | 0% | 1% |
| Convulsions | 1% | 2% | 2% | 1% | 1% |
| Headache | 1% | 2% | 4% |
Time periods cannot be compared due to differing questionnaire intervals.
Table 3 shows the proportion of all children who experienced at least one symptom and consulted for at least one symptom within and across all time periods. In order to generate a summary measure of consultations and symptoms across the whole pre-school period, we restricted our sample to those with complete data (n = 7727). Across all age groups, that is up to the age of 4 ¾ years, all children (100%) were reported to have experienced at least one symptom and nearly all children (97.4%) consulted a doctor. Within age groups, at least 97% of children experienced one or more symptoms, the median number of different symptoms being four to six. Between 63% and 80% of children consulted, with medians of one or two different symptoms leading to consultations.
The proportion of all pre-school children in the Avon Longitudinal Study of Parents and Children (ALSPAC) with at least one symptom and consulting for at least one symptom and the median (interquartile range) number of different symptoms leading to consultations
| <6 months | 6 to 17 months | 18 to 29 months | 30 to 41 months | 42 to 56 months | 0 to 56 monthsa | |||||||
|---|---|---|---|---|---|---|---|---|---|---|---|---|
| Symptoms | ||||||||||||
| Proportion (%) of all children with at least one symptom | 97.7% | 99.5% | 99.4% | 99.0% | 99.2% | 100.0% | ||||||
| Number of different symptoms: Median (IQRb) | 4 (2 to 5) | 5 (4 to 6) | 5 (4 to 6) | 5 (3 to 6) | 6 (4 to 7) | 8 (7 to 10) | ||||||
| Consultations | ||||||||||||
| Proportion (%) of all children consulting for at least one symptom | 71.6% | 79.4% | 69.8% | 57.2% | 63.0% | 97.4% | ||||||
| Number of different symptoms leading to consultations: Median (IQRb) | 2 (0 to 3) | 2 (1 to 4) | 2 (0 to 3) | 1 (0 to 2) | 1 (0 to 3) | 5 (3 to 7) | ||||||
Derived from children with complete data across all age groups (n = 7727).
Interquartile range.
Attrition
With regard to our estimation of the effect of attrition, the number in each of the five groups (determined by the number of other symptom questionnaires they completed at 30 months) was as follows: 56 (0.6%) subjects responded to no other questionnaire, 217 (2.2%) completed one other questionnaire, 628 (6.3%) two others, 1305 (13.1%) three others, and 7727 (77.8%) completed all the other questionnaires. First, for symptoms, there was no evidence of a difference in the mean number of reported symptoms: means were 5.18, 5.18, 5.10, 5.18 and 5.05, respectively, (Kruskall–Wallis chi-square (4 d.f.) = 4.9, P = 0.299). The prevalence of each symptom reported for the period 18 to 29 months was compared using a series of chi-square trend-tests, combining the groups of 56 and 217 to reduce the number of small cells. This showed that there was some evidence of a relationship between symptom reporting and answering of questionnaires, but that this was inconsistent. For six out of the 15 symptoms (ear discharge, convulsion, stomach ache, wheezing, breathlessness, stopping breathing) attrition was positively associated with symptom reports (all at P < 0.01), for two (cough and cold) attrition was negatively associated with symptom reporting (all P < 0.01), and for the other seven symptoms, there was no evidence of a relationship between attrition and symptom prevalence (all P > 0.1). Second, for reports of consultation, the mean number of consultations differed between groups: 2.7, 2.6, 2.5, 2.3 and 2.0 respectively, (Kruskall–Wallis chi-square (4 d.f.) = 64.7, P < 0.001) and there was a significant relationship between attrition and increasing consultation for 11 out of the 15 symptoms with all but blood in stools, earache, rash and headache attaining a P value of 0.05 or less.
Socio-demographic factors associated with consultation
Table 4 shows the univariable odds ratios for consultations among children with any symptom consulting a doctor by the child's gender and the mother's parity, age at delivery of study child, educational attainment and housing tenure. Factors associated with higher and more consistent (across age groups) odds of consultation were younger maternal age, lower parity and rented or council house accommodation. Table 5 shows the multivariable odds ratios for consultations by the same factors following adjustment for the remaining variables. This shows that following adjustment for the other factors, lower parity did not attenuate and was most consistently and strongly associated with seeing a doctor for symptoms of early childhood. Between six and 56 months, the adjusted odds of consulting with symptoms were between 29% and 48% lower among mothers of three or more children compared with first time mothers (all P < 0.001).
Univariable odds ratios [95% confidence interval] for consultations among children in the Avon Longitudinal Study of Parents and Children (ALSPAC) with any symptom by child's gender and mother's parity, age, educational attainment and housing tenure
| <6 months | 6 to 17 months | 18 to 29 months | 30 to 41 months | 42 to 46 months | ||||||
|---|---|---|---|---|---|---|---|---|---|---|
| Parity (ref = first child) | ||||||||||
| Second | 1.03 [0.93, 1.14] | 0.60 [0.54, 0.68] | 0.76 [0.69, 0.84] | 0.78 [0.71, 0.86] | 0.73 [0.66, 0.80] | |||||
| Third or later | 0.97 [0.86, 1.10] | 0.52 [0.45, 0.59] | 0.57 [0.51, 0.65] | 0.72 [0.64, 0.81] | 0.63 [0.56, 0.71] | |||||
| P = 0.645 | P < 0.001 | P < 0.001 | P < 0.001 | P < 0.001 | ||||||
| Tenure (ref = mort/owned) | ||||||||||
| Other rented | 1.19 [1.02, 1.38] | 1.24 [1.05, 1.48] | 1.30 [1.11, 1.53] | 1.20 [1.04, 1.38] | 1.17 [1.00, 1.36] | |||||
| Council | 1.79 [1.52, 2.12] | 1.21 [1.02, 1.43] | 1.39 [1.18, 1.63] | 1.27 [1.10, 1.47] | 1.21 [1.04, 1.42] | |||||
| P < 0.001 | P = 0.008 | P < 0.001 | P = 0.001 | P = 0.011 | ||||||
| Gender (ref = female) | ||||||||||
| Male | 1.30 [1.19, 1.43] | 1.21 [1.10, 1.34] | 1.09 [1.00, 1.20] | 1.04 [0.96, 1.13] | 0.94 [0.86, 1.03] | |||||
| P < 0.001 | P < 0.001 | P = 0.059 | P = 0.353 | P = 0.187 | ||||||
| Education (ref = >O level) | ||||||||||
| O level | 1.28 [1.15, 1.42] | 1.11 [0.99, 1.24] | 1.05 [0.95, 1.17] | 1.05 [0.95, 1.16] | 1.09 [0.98, 1.20] | |||||
| <O level | 1.60 [1.42, 1.80] | 1.21 [1.06, 1.37] | 1.12 [1.00, 1.26] | 1.13 [1.01, 1.25] | 1.19 [1.06, 1.33] | |||||
| P < 0.001 | P = 0.014 | P = 0.161 | P = 0.100 | P = 0.012 | ||||||
| Maternal age (ref = 30+) | ||||||||||
| 20–29 | 1.33 [1.22, 1.46] | 1.35 [1.22, 1.50] | 1.36 [1.24, 1.49] | 1.15 [1.06, 1.25] | 1.22 [1.11, 1.33] | |||||
| Teen | 2.77 [1.93, 3.98] | 2.22 [1.52, 3.25] | 1.85 [1.34, 2.54] | 1.65 [1.25, 2.18] | 2.09 [1.49, 2.93] | |||||
| P < 0.001 | P < 0.001 | P < 0.001 | P < 0.001 | P < 0.001 | ||||||
Reference categories for explanatory variables are shown in brackets.
Multivariableaodds ratios [95% confidence interval] for consultations among children in the Avon Longitudinal Study of Parents and Children (ALSPAC) with any symptom by child's gender and mother's parity, age, educational attainment and housing tenure.
| <6 months | 6 to 17 months | 18 to 29 months | 30 to 41 months | 42 to 56 months | ||||||
|---|---|---|---|---|---|---|---|---|---|---|
| Parity (ref = first child) | ||||||||||
| Second | 1.06 [0.95, 1.18] | 0.61 [0.54, 0.69] | 0.78 [0.70, 0.86] | 0.78 [0.71, 0.86] | 0.73 [0.66, 0.81] | |||||
| Third or later | 0.97 [0.85, 1.11] | 0.52 [0.45, 0.59] | 0.58 [0.51, 0.66] | 0.71 [0.62, 0.80] | 0.62 [0.55, 0.71] | |||||
| P = 0.342 | P < 0.001 | P < 0.001 | P < 0.001 | P < 0.001 | ||||||
| Tenure (ref = mort/owned) | ||||||||||
| Other rented | 1.07 [0.92, 1.25] | 1.07 [0.90, 1.28] | 1.17 [1.00, 1.38] | 1.11 [0.96, 1.29] | 1.05 [0.90, 1.23] | |||||
| Council | 1.46 [1.22, 1.75] | 1.24 [1.03, 1.49] | 1.47 [1.24, 1.75] | 1.29 [1.11, 1.52] | 1.22 [1.04, 1.44] | |||||
| P < 0.001 | P = 0.065 | P < 0.001 | P = 0.004 | P = 0.057 | ||||||
| Gender (ref = female) | ||||||||||
| Male | 1.31 [1.19, 1.43] | 1.23 [1.11, 1.36] | 1.11 [1.01, 1.21] | 1.05 [0.96, 1.14] | 0.95 [0.87, 1.04] | |||||
| P < 0.001 | P < 0.001 | P = 0.031 | P = 0.281 | P = 0.254 | ||||||
| Education (ref = >O level) | ||||||||||
| O level | 1.18 [1.06, 1.31] | 1.07 [0.95, 1.20] | 0.99 [0.89, 1.11] | 1.03 [0.93, 1.13] | 1.06 [0.96, 1.18] | |||||
| <O level | 1.37 [1.20, 1.55] | 1.18 [1.03, 1.36] | 1.05 [0.93, 1.19] | 1.08 [0.97, 1.22] | 1.17 [1.03, 1.32] | |||||
| P < 0.001 | P = 0.058 | P = 0.655 | P = 0.396 | P = 0.047 | ||||||
| Maternal age (ref = 30+) | ||||||||||
| 20–29 | 1.23 [1.11, 1.36] | 1.14 [1.02, 1.27] | 1.18 [1.06, 1.30] | 1.04 [0.95, 1.14] | 1.07 [0.97, 1.18] | |||||
| Teen | 2.14 [1.47, 3.12] | 1.38 [0.92, 2.05] | 1.24 [0.88, 1.73] | 1.21 [0.90, 1.63] | 1.45 [1.02, 2.07] | |||||
| P < 0.001 | P = 0.037 | P = 0.006 | P = 0.413 | P = 0.081 | ||||||
Reference categories for explanatory variables are shown in brackets.
Adjusted for the remaining four socio-demographic factors.
Discussion
Summary of main results
This study quantifies the extent of symptoms reported in pre-school children in the community and leading to medical consultations. Within any given time period, the vast majority of children experienced symptoms and the majority consulted a doctor. This study shows that the respiratory symptoms cough, cold, earache and high temperature are the most common symptoms to present to medical services. The fewer the number of children, the more likely a mother was to consult a doctor.
Interpretation
Parents should be aware that these symptoms are extremely common in pre-school children. Knowing when to consult a health professional is a key parenting skill and health care providers might wish to concentrate their efforts on supporting first time parents. This is important as small changes in the percentage of children consulting for symptoms could lead to large changes in workload. Two results suggest parents' confidence in managing symptoms without medical support may increase with experience. First, although the prevalence of cough and cold symptoms increased or remained static, the proportion of children consulting for these symptoms fell as the child grew older and second, higher parity was independently associated with lower consultation rates. Research into the diagnosis, prognosis and treatment of acute conditions in pre-school children should prioritise the symptoms cough, high fever, earache, cold and diarrhoea.
Where this fits in with other research
Our study is the largest to date to confirm the high consultation prevalence of cough and fever,2,6 and the first to demonstrate the importance of earache. We found that in any given time period, 30% to 40% of children with cough consulted a doctor. This is not dissimilar to another study which reported 50% of children with cough consulted their GP.12 Our study suggests that parity may be a more important determinant of consultation than socio-economic deprivation, which may help clarify why previous studies have disagreed,9,10 and complements the findings of another study,13 that showed that children were more likely to visit their GP if their parents were frequent attenders or had high levels of health anxiety. Previous work from ALSPAC has shown that lower maternal educational attainment is associated with consultation for cough and the use of cough medication.14
Limitations
Whilst ours is the largest study examining symptom and consultation prevalence to date, parents were not asked to record the number of times symptoms or consultations took place or, when the child consulted, the presence of other symptoms. We are therefore unable to present symptom or consultation rates, adjust the data for the differing questionnaire intervals or assess if increasing numbers of different symptoms led to higher consultation rates. Response rates fell from 82% to 68% between the first and last questionnaire. Bias caused by attrition from this cohort has been described previously: better educated, older mothers living in their own property were more likely to complete questionnaires, mirroring the original recruitment bias of parents into the cohort.11 Our analyses suggest that attrition had less effect on the reporting of symptoms than the reporting of consultations and that the effect on the latter was to underestimate the mean number of consultations. Questionnaires were administered at 12-month intervals except for the first (up to six months) and last (42 to 57 months) questionnaires. This has two implications. First, the interval duration means recall bias could have led to reporting of only the most severe or recent symptoms and consultations. The effect of this bias is difficult to assess as reporting of only severe symptoms could underestimate prevalence, while recall of severe events outside the questionnaire time periods could overestimate prevalence. Unfortunately, it was beyond the resources of this study to validate reported symptoms against symptom diaries or consultations documented in medical records. Nevertheless, our data reflect the parental perspective of their child's illness and we think recall bias would be unlikely to materially alter the symptom and consultation prevalences, which are very high. Second, the differing questionnaire intervals mean comparisons between age groups must be limited to the three middle data collection points. In any case, it is possible that differences exist in the reporting of symptoms for children of different ages. For example, younger children may not be able to complain of pain and parents may vary in their interpretation of symptoms such as headache, colic and earache.
As parents were not asked to specify, we have not made any assumptions about whether consultations took place in primary or secondary care. However, it is likely that the majority of contacts were with GPs, especially for the more common, minor symptoms such as cough, cold, rash, high temperature, diarrhoea, vomiting and earache. The data collection took place between 1991 and 1997, prior to the advent of NHS Direct in 1998 or Walk-in-Centres in 2000. Neither change in the organisation of primary care services is likely to materially alter our results.15,16 Consultations for more serious, and less common symptoms, such as convulsions, stopping breathing and blood in stools are more likely to have taken place in a combination of primary and secondary care.
Finally, we cannot make inferences regarding the appropriateness of parents' consultation decisions. Although associated with socio-demographic factors, this remains a complex judgement, which is also based on other factors such as the severity of the symptom and associated behaviour change.12
Conclusions
Pre-school children experience symptoms and frequently consult doctors, particularly for respiratory problems. Our results suggest that research into the diagnosis, prognosis and management of young children could focus on the most common reasons for consultation, which are cough, fever and earache. Efforts to support the appropriate use of health services might usefully be targeted at first time parents.
Declaration
Funding: this study could not have been undertaken without the financial support of the Medical Research Council, the Wellcome Trust, the UK Department of Health, the Department of the Environment, and DfEE, the National Institutes of Health, a variety of medical research charities and commercial companies. The ALSPAC study is part of the WHO initiated European Longitudinal Study of Pregnancy & Childhood.
Ethical approval: the ALSPAC law and ethics and the local research ethics committees approved the data collection.
Conflicts of interest: none.
We are extremely grateful to all the mothers who took part and to the midwives for their cooperation and help in recruitment. The whole ALSPAC study team comprises interviewers, computer technicians, laboratory technicians, clerical workers, research scientists, volunteers and managers who continue to make the study possible. AH and AN conceived the idea for the study. AH and JH planned the analysis, JH analysed the data and all authors contributed to the paper. AH holds a postdoctoral award from the National Co-ordinating Centre for Research Capacity Development (NCCRCD), Department of Health. The views and opinions expressed in this paper do not necessarily reflect those of the NCCRCD or the Department of Health.
References
McCormick A, Fleming D, Charlton J. Morbidity statistics from general practice. Fourth national study 1991–1992. London: HMSO;
Okkes M, Oskam SK, Lamberts H. The Probability of Specific Diagnoses for Patients Presenting with Common Symptoms to Dutch Family Physicians.
Howie JG, Richardson IM, Gill G, Durno D. Respiratory illness and antibiotic use in general practice.
Stocks N, Fahey T. Labelling of acute respiratory illness: evidence of between- practitioner variation in the UK.
Medical Research Council. Primary Health Care Research Review. London: Medical Research Council. MRC Topic Review;
Holme CO. Incidence and prevalence of non-specific symptoms and behavioural changes in infants under the age of two years.
Bruijnzeels MA, Foets M, van der Wouden JC, van den Heuvel WJ, Prins A. Everyday symptoms in childhood: occurrence and general practitioner consultation rates.
Saxena S, Majeed A, Jones M. Socioeconomic differences in childhood consultation rates in general practice in England and Wales: prospective cohort study.
Cooper H, Smaje C, Arber S. Use of health services by children and young people according to ethnicity and social class: secondary analysis of a national survey.
Golding J, Pembrey M, Jones R. ALSPAC-the Avon Longitudinal Study of Parents and Children. I. Study methodology.
Wyke S, Hewison J, Russell IT. Respiratory illness in children: what makes parents decide to consult?
Little P, Somerville J, Williamson I, Warner G, Moore M, Wiles R et al. Family influences in a cross-sectional survey of higher child attendance.
Dewey CR, Hawkins NS, ALSPAC Study Team. The relationship between the treatment of cough during early infancy and maternal education level, age and number of other children in the household. ALSPAC Study Team. Avon Longitudinal Study of Pregnancy and Childhood.
Munro J, Nicholl J, O'Cathain A, Knowles E. Impact of NHS direct on demand for immediate care: observational study.
Author notes
aAcademic Unit of Primary Health Care, Department of Community Based Medicine, University of Bristol, Cotham House, Cotham Hill, Bristol BS6 6JL and bUnit of Paediatric and Perinatal Epidemiology, Department of Community Based Medicine, University of Bristol, 26 Tyndall Avenue, University of Bristol, Bristol BS8 1TQ, UK
