


Abstract
Ion channel mutations can cause distinct neuropsychiatric diseases. We first studied the biophysical and neurophysiological consequences of four mutations in the human Na+ channel gene SCN8A causing either mild (E1483K) or severe epilepsy (R1872W), or intellectual disability and autism without epilepsy (R1620L, A1622D). Only combined electrophysiological recordings of transfected wild-type or mutant channels in both neuroblastoma cells and primary cultured neurons revealed clear genotype–phenotype correlations. The E1483K mutation causing mild epilepsy showed no significant biophysical changes, whereas the R1872W mutation causing severe epilepsy induced clear gain-of-function biophysical changes in neuroblastoma cells. However, both mutations increased neuronal firing in primary neuronal cultures. In contrast, the R1620L mutation associated with intellectual disability and autism—but not epilepsy—reduced Na+ current density in neuroblastoma cells and expectedly decreased neuronal firing. Interestingly, for the fourth mutation, A1622D, causing severe intellectual disability and autism without epilepsy, we observed a dramatic slowing of fast inactivation in neuroblastoma cells, which induced a depolarization block in neurons with a reduction of neuronal firing. This latter finding was corroborated by computational modelling. In a second series of experiments, we recorded three more mutations (G1475R, M1760I, G964R, causing intermediate or severe epilepsy, or intellectual disability without epilepsy, respectively) that revealed similar results confirming clear genotype–phenotype relationships. We found intermediate or severe gain-of-function biophysical changes and increases in neuronal firing for the two epilepsy-causing mutations and decreased firing for the loss-of-function mutation causing intellectual disability. We conclude that studies in neurons are crucial to understand disease mechanisms, which here indicate that increased or decreased neuronal firing is responsible for distinct clinical phenotypes.
Introduction
The genetics and pathophysiological mechanisms of epilepsies, intellectual disability and autism spectrum disorders (ASD) are increasingly recognized in the era of next generation sequencing. Beside inherited mutations in more mildly affected families, de novo mutations detected in severely affected children of healthy parents play a major role (Sanders et al., 2012; Epi4K Consortium et al., 2013). Severe epilepsies are often accompanied by intellectual disability or ASD, but intellectual disability and autism can also appear without seizures. These distinct groups of symptoms can occur with mutations in the same gene, but the underlying mechanisms are largely unknown. Many of such mutations have been identified in voltage- or ligand-gated ion channels (Lerche et al., 2013), and particularly mutations in two genes encoding voltage-gated Na+ channels, SCN2A and SCN8A, have been described to cause either benign forms of epilepsy alone (mainly inherited mutations in families but also some de novo mutations), combinations of severe epilepsy with intellectual disability and other neuropsychiatric features, or intellectual disability or ASD without seizures (de novo mutations in the latter groups) (Veeramah et al., 2012; Meisler et al., 2016; Wolff et al., 2017; Gardella et al., 2018). Mutations in SCN2A with a gain-of-function mechanism usually cause early onset seizures, whereas loss-of-function mutations tend to be associated with later onset seizures or neurodevelopmental phenotypes without epilepsy (Wolff et al., 2017). Similarly, previous publications suggested that mutations in SCN8A causing epilepsy lead to a gain of channel function (Veeramah et al., 2012; Estacion et al., 2014; Blanchard et al., 2015; Barker et al., 2016; Wagnon et al., 2016), whereas a few loss-of-function mutations were described causing intellectual disability or ASD without seizures (Trudeau et al., 2006; Wagnon et al., 2017, 2018). Two mutations with a loss-of-function effect were also described to cause intellectual disability in combination with epilepsy (de Kovel et al., 2014; Blanchard et al., 2015).
The biophysical consequences of mutations in ion channel genes can be studied using heterologous expression systems that are not contaminated by endogenous channels. While this is advantageous to disentangle detailed mechanisms of ion channel dysfunction, such studies only allow theoretical predictions as to how neuronal behaviour might be changed by the mutations. Therefore, we here used a neuroblastoma cell line (ND7/23) and primary neuronal cultures to study both the biophysical and neuronal properties of four different missense mutations in SCN8A associated with distinct clinical phenotypes. One inherited mutation causes a mild epilepsy syndrome in three independent families (Gardella et al., 2016), one is a recurring de novo mutation causing a severe epileptic encephalopathy (Ohba et al., 2014; Larsen et al., 2015; Gardella et al., 2018), and two more to date unpublished mutations that also occurred de novo cause intellectual disability or autism without seizures. Three more mutations causing intermediate or severe epilepsy, or intellectual disability without epilepsy, were studied later to corroborate results of the first series of experiments. We used the human SCN8A gene and engineered a resistance to tetrodotoxin (TTX) (Leffler et al., 2005). This enabled us to silence endogenous Na+ channels and to compare (i) the detailed biophysical properties of mutant and wild-type channels in a neuronal cellular background in neuroblastoma cells; and (ii) to study their influence on intrinsic neuronal firing properties in primary neurons, both in presence and absence of endogenous channels.
Materials and methods
Electrophysiological analyses were performed and compared to the wild-type channel for different SCN8A mutations to correlate their functional effects to the associated phenotypic features. We chose the first four mutations on the following criteria: one recurrent mutation previously reported by us (Gardella et al., 2016) is associated with a mild epilepsy and normal cognition (E1483K), one recurrent mutation is associated with a severe epileptic encephalopathy (R1872W) (Ohba et al., 2014; Larsen et al., 2015; Gardella et al., 2018) and two unpublished mutations were associated with intellectual disability and autism without epilepsy (R1620L, A1622D). The second series of three mutations was selected on the basis of a similar clinical spectrum from intermediate to severe epilepsy or intellectual disability without epilepsy.
Mutagenesis
The human Nav1.6 channel construct was purchased from Origene and modified to introduce TTX resistance by a known point mutation (c.1112A > G, p.Y371C) (Leffler et al., 2005). The wild-type open reading frame included the canonical SCN8A coding sequence with a C-terminus Myc-DDK tag (total length of 6063 bp). The SCN8A coding sequence (5940 bp) contained the splice isoform 5 N of exon 5. Apart from the TTX resistance change and the stop codon, it was identical to the coding sequences of RefSeq transcript NM_014191.3, Ensembl transcript ENST00000354534.10 and Consensus Coding Sequence Database transcript CCDS44891.1. To engineer the TTX-resistance and the disease-associated missense mutations into the human Nav1.6 channel, site-directed mutagenesis was performed using PCR with Pfu polymerase (Promega; mutagenic primers are available upon request). All mutations were verified and further mutations were excluded by sequencing the whole SCN8A cDNA prior to using the clones for physiological experiments.
Transfection and expression in ND7/23 cells
ND7/23 is a hybrid cell line derived from neonatal rat dorsal root ganglia neurons fused with mouse neuroblastoma cells (Wood et al., 1990). It was purchased from Sigma Aldrich and cultured in Dulbecco’s modified Eagle nutrient medium (Invitrogen) supplemented with 10% foetal calf serum (PAN-Biothech) and 1% l-glutamine 200 mM (Biochrom) at 37°C, with 5% CO2 humidified atmosphere. ND7/23 cells were plated in 35 mm petri dishes following the standard protocol for Lipofectamine™ 2000 (Invitrogen) transfections. Transfections of wild-type or mutant human SCN8A cDNAs, encoding the Nav1.6 channel α-subunit with an engineered TTX resistance, were then performed together with the human β1- and β2-subunits of voltage-gated Na+ channels in the pCLH vector, which were kindly provided by GlaxoSmithKline and which had been modified by us previously to express either enhanced green fluorescent protein (pCLH-hb1-EGFP) or a CD8 marker (pCLH-hb2-CD8) to label cells expressing both subunits (Liao et al., 2010). For co-expression of α- and both β-subunits, 4.4 µg of cDNA were used (4 µg of the α-subunit and 0.2 µg of each of the two β-subunits). Electrophysiological recordings were performed 48 h after transfection only from cells expressing all three subunits, which were recognized by (i) a TTX-resistant Na+ current (α-subunit); (ii) anti-CD8 antibody coated microbeads (Dynabeads M450, Dynal) on the cell surface (β1-subunit); and (iii) a green fluorescence (β2-subunit).
Primary neuronal cultures and transfections
Animal protocols for primary cell culture were approved by the local Animal Care and Use Committee (Regierungspraesidium Tuebingen, Tuebingen, Germany). Hippocampal neurons were isolated from embryonic Day 18 (E18) C57BL/6NCrl mouse pups as previously described (Hedrich et al., 2014). Details were provided in the Supplementary material.
Transfection for expression of TTX-resistant wild-type or mutant Nav1.6 channels in cultured hippocampal neurons was performed following the standard protocol of Optifect™ (Invitrogen) at 6–7 DIV (days in vitro) (after initiating the culture). Briefly, 4 µl Optifect™ reagent was mixed with 100 µl Opti-MEM™ and incubated at room temperature for 5 min. Complementary DNA [1.1 µg, comprising 1 µg of the plasmid containing the human SCN8A cDNA and 0.1 µg of a plasmid containing cDNA encoding IRES-GFP under the CMV/β actin promotor (a generous gift from J.D. Macklis, Harvard University)] was added and the whole mixture was incubated at room temperature for 20 min before adding it to the neuronal medium of the hippocampal culture. After 48 h, electrophysiological recordings were performed from transfected neurons with green fluorescence.
Electrophysiology
For recordings from ND7/23 cells, 500 nM TTX was added to the bath solution to block all endogenous Na+ currents. Standard whole-cell voltage clamp recordings were performed using an Axopatch 200B amplifier, a Digitata 1440 A digitizer and Clampex 10.2 data acquisition software (Axon Instruments) as described previously (Liao et al., 2010). Leakage and capacitive currents were automatically subtracted using a prepulse protocol (−P/4). Cells were held at −100 mV. Currents were filtered at 5 kHz and digitized at 20 kHz. Cells were visualized using an inverted microscope (Axio-Vert.A1; Zeiss). All recordings in transfected ND7/23 cells were performed 10 min after establishing the whole-cell configuration at room temperature to avoid larger shifts in voltage dependence (Liao et al., 2010). Borosilicate glass pipettes had a final tip resistance of 1.8–2.5 MΩ when filled with internal recording solution (see below). We carefully checked that the maximal voltage error due to residual series resistance after up to 90% compensation was always <5 mV. The pipette solution contained (in mM): 10 NaCl, 1 EGTA, 10 HEPES, 140 CsF (pH was adjusted to 7.3 with CsOH, osmolarity was adjusted to 310 mOsm/kg with mannitol). The bath solution contained (in mM): 140 NaCl, 3 KCl, 1 MgCl2, 1 CaCl2, 10 HEPES, 20 TEACl (tetraethylammonium chloride), 5 CsCl and 0.1 CdCl2 (pH was adjusted to 7.3 with CsOH, osmolarity was adjusted to 320 mOsm/kg with mannitol).
Experiments with hippocampal neurons were performed either in the absence or in the presence of 500 nM TTX, which was added to the bath solution. This allowed us on one hand to mimic a heterozygous expression of TTX-resistant Nav1.6 channels, and on the other hand to study neuronal properties only in the presence of the transfected wild-type or mutant channels. Standard whole-cell voltage-clamp and current-clamp recordings were performed in transfected neurons (which were visualized with a Leica DM IL LED microscope) using an Axopatch 200B amplifier, a Digitata 1440 A digitizer and Clampex 10.2 data acquisition software. Cells were held at −70 mV. Na+ currents (which were only recorded to estimate the amplitude for specific experiments) were filtered at 5 kHz and digitized at 20 kHz for voltage-clamp recordings. For current-clamp recordings, signals were low-pass filtered at 10 kHz and sampled at 100 kHz. All recordings were performed at room temperature of 21–23°C.
Borosilicate glass pipettes had a resistance of 2–3 MΩ. The pipette solution contained (in mM): 5 KCl, 4 ATP-Mg, 10 phosphocreatine, 0.3 GTP-Na, 10 HEPES, 125 K-gluconate, 2 MgCl2 and 10 EGTA (pH adjusted to 7.2 with KOH, osmolarity was adjusted to 290 mOsm/kg with mannitol). The bath solution contained (in mM): 125 NaCl, 25 NaHCO3, 2.5 KCl, 1 MgCl2, 2 CaCl2, 1.25 NaH2PO4 and 10 glucose (pH 7.4, bubbled with 95% O2/5% CO2, osmolarity was adjusted to 305 mOsm/kg with mannitol). The liquid junction potential was not corrected.
Data recording and statistical analysis
For the voltage-clamp recordings in ND7/23 cells, the biophysical parameters of human wild-type and mutant Nav1.6 channels were obtained as previously described (Liao et al., 2010). Detailed descriptions are provided in the Supplementary material.
The input resistance of transfected hippocampal neurons was determined by the slope of a linear regression fit to corresponding steady state voltage responses plotted versus a series of current injections ranging from −110 to −10 pA with 10 pA increments. For recording action potentials, only events with a voltage peak amplitude surpassing 0 mV were regarded as action potentials. The first evoked action potential was used to determine single action potential parameters. The action potentials followed by a depolarization block in neurons transfected with A1622D mutant channels were regarded as a single event and used for analysis. The peak amplitude of an action potential was measured from the baseline to the peak and the half-width was determined at 50% of the peak amplitude (Supplementary Fig. 4). As shown in Supplementary Fig. 4B, the plateau current in neurons transfected with A1622D channels did not influence the action potential half-width, since the depolarization block occurred at a voltage below the 50% of the peak amplitude. The threshold of an action potential was determined as the voltage at which the first derivative dV/dt reached 50 V/s (Kole and Stuart, 2008). When the maximal dV/dt did not reach 50 V/s in a few transfected neurons in the presence of TTX, the threshold was determined as 50% of the maximal dV/dt.
All data were analysed using Clampfit software of pClamp 10.6 (Axon Instruments), Microsoft Excel (Microsoft Corporation, Redmond, WA, USA), or Igor Pro (Wavemetrics, Portland, OR, USA). Statistics were performed using Graphpad software (Graphpad prism, San Diego, CA, USA). All data were tested for normal distribution. For comparison of multiple groups, one-way ANOVA with Dunnett’s post hoc test was used for normally distributed data and ANOVA on ranks with Dunn’s post hoc test was used for not normally distributed data. All data are shown as mean ± standard error of the mean (SEM), n indicates the number of cells. Box-and-whisker plots show means (plus sign), the 25th, 50th and 75th percentiles, minima and maxima. For all statistical tests, significance compared to controls is indicated on the figures using the following symbols: *P < 0.05, **P < 0.01, ***P < 0.001.
A single-compartment conductance-based model was used to qualitatively simulate the neurophysiological consequences of the A1622D mutation. The detailed parameters and settings were provided in Supplementary material.
Data availability
The data that support the findings of this study are available from the corresponding author, upon reasonable request.
Results
Clinical descriptions
The E1483K mutation has been associated with benign familial infantile seizures (BFIS) and a later onset paroxysmal movement disorder, whereas the R1872W mutation causes an early onset epileptic encephalopathy, severe intellectual disability and motor manifestations including hypotonia and dystonia (this study) (Ohba et al., 2014; Larsen et al., 2015; Gardella et al., 2016, 2018). The A1622D and the R1620L mutations were found in patients without epilepsy but with developmental delay, hypotonia, fasciculations and chorea-like movements for the A1622D mutation, and intellectual disability, autism, attention deficit hyperactivity disorder (ADHD), congenital adrenal hyperplasia, hyperreflexia and choreiform movements for the R1620L mutation.
The G1475R mutation has been reported in several patients with variable phenotypic expressivity from treatable epilepsy and normal intelligence or mild intellectual disability to epileptic encephalopathies with comorbid intellectual disability, hypotonia and motor manifestations including dyskinesia and ataxia (this study, see Supplementary material) (Parrini et al., 2017; Wang et al., 2017; Gardella et al., 2018; Xiao et al., 2018). The M1760I mutation was found in a patient with an intrauterine onset of seizures developing then epileptic encephalopathy, severe intellectual disability, hypotonia and blindness (this study). The G964R mutation has previously been published in a patient with mild intellectual disability, ADHD, receptive-expressive language disorder but no epilepsy (Wagnon et al., 2017).
Only the E1483K mutation was inherited in three independent families, whereas the other mutations arose de novo. More detailed descriptions of the clinical and genetic results are given in the Supplementary material.
Functional characterization of SCN8A mutations in ND7/23 cells
All four SCN8A mutations that we characterized in this study cause changes in highly conserved protein regions that are critical for Na+ channel function (Fig. 1A and Supplementary Fig. 1A). TTX-resistant Nav1.6 wild-type (WT) or mutant channels were transfected into ND7/23 cells. TTX and caesium fluoride (CsF) were used to block endogenous Na+ and K+ channels.
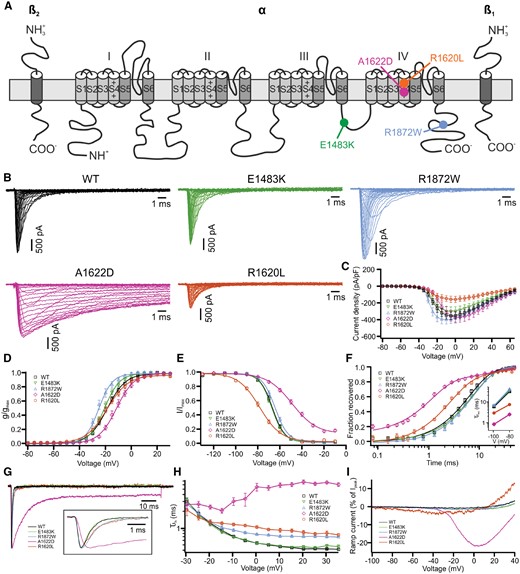
Functional studies of Nav1.6 wild-type and mutant channels in the rodent neuroblastoma cell line ND7/23. Wild-type (WT) or mutant Nav1.6 channels were transfected into ND7/23 cells. Na+ currents were recorded in the presence of TTX to block the endogenous Na+ channels. (A) Localization of all four mutations in the human Nav1.6 channel. (B) Representative Na+ current traces from SCN8A wild-type (black), E1483K (green), R1872W (blue), A1622D (purple) and R1620L (orange), respectively. (C) Peak Na+ currents normalized by cell capacitances were plotted versus voltage. The R1872W mutation (blue) caused a left-shift of the current-voltage relationship and the R1620L mutation (orange) presented with a lower current density compared to wild-type. Wild-type, n = 29; E1483K, n = 17; R1872W, n = 16; A1622D, n = 19; R1620L, n = 14. (D) Voltage-dependent steady state activation curves. Lines represent Boltzmann functions fit to the data points. (E) Voltage-dependent steady state inactivation curves. Lines represent Boltzmann function as in D. (F) Time course of recovery from fast inactivation at −100 mV. The inset shows mean values of the recovery time constant at two different voltages. The A1622D and R1620L mutations accelerated the recovery from fast inactivation compared to wild-type. (G) Representative normalized Na+ current traces at 0 mV. The inset shows the first 4.5 ms at a higher time resolution. (H) Voltage-dependence of the major time constant of fast inactivation τh. (I) Averaged ramp currents upon ramp stimuli from −100 to +40 mV lasting 800 ms. Wild-type, n = 16; E1483K, n = 14; R1872W, n = 11; A1622D, n = 12; R1620L, n = 12. Shown are means ± SEM (C–F and H). Numbers of recorded cells and statistical analysis are provided in Table 1.
Representative raw current traces are shown in Fig. 1B. The peak current density was significantly reduced for the R1620L mutation, but not changed for the other mutant channels compared to the wild-type (Fig. 1B, C and Table 1). To determine the voltage dependence of activation, a Boltzmann function was fit to the normalized conductance-voltage plots (Fig. 1D). The R1872W mutation caused a significant hyperpolarizing shift of the activation curve and a steeper slope, the R1620L mutation significantly decreased the slope, and the A1622D mutation shifted the activation curve towards more depolarized potentials (Table 1). The steady state fast inactivation curve was shifted towards more hyperpolarized potentials for R1620L and towards depolarized potentials for A1622D compared to wild-type channels. Slopes were decreased for both mutations (Fig. 1E and Table 1). In addition, the steady state fast inactivation curve for A1622D indicated an incomplete inactivation (Fig. 1E).
Biophysical properties of SCN8A wild-type and mutant channels recorded in ND7/23 cells
| Steady- state activation | Steady state inactivation | τh at 0 mV, ms | n | τrec at −100 mV, ms | n | Current density, pA/pF | n | |||||
|---|---|---|---|---|---|---|---|---|---|---|---|---|
| V1/2, mV | k | n | V1/2, mV | k | n | |||||||
| Wild-type | −18.3 ± 1.1 | −6.4 ± 0.3 | 29 | −67.0 ± 0.9 | 4.9 ± 0.1 | 27 | 0.54 ± 0.02 | 28 | 5.7 ± 0.4 | 23 | −353.7 ± 45.7 | 29 |
| E1483K | −20.6 ± 0.8 | −5.6 ± 0.4 | 17 | −67.4 ± 0.7 | 5.3 ± 0.1 | 17 | 0.53 ± 0.02 | 17 | 6.4 ± 0.3 | 13 | −299.5 ± 52.6 | 17 |
| R1872W | −24.2 ± 1.5** | −4.5 ± 0.5** | 16 | −64.4 ± 0.9 | 5.5 ± 0.1 | 15 | 0.77 ± 0.03** | 16 | 6.5 ± 0.5 | 14 | −400.5 ± 51.2 | 16 |
| A1622D | −11.0 ± 1.3*** | −6.0 ± 0.4 | 19 | −49.1 ± 1.4*** | 10.1 ± 0.3*** | 24 | 5.5 ± 0.9*** | 19 | 0.8 ± 0.1*** | 22 | −372.5 ± 65.8 | 19 |
| R1620L | −18.0 ± 1.3 | −8.1 ± 0.5** | 14 | −78.1 ± 1.3** | 9.2 ± 0.4*** | 14 | 1.0 ± 0.1*** | 14 | 2.8 ± 0.1*** | 14 | −156.9 ± 37.4* | 14 |
For the A1622D mutation, a second-order exponential function with an initial delay was fit to the time course of recovery from fast inactivation at −100 mV yielding τrec fast = 0.8 ± 0.1 ms (the amplitude of the fast component and the offset were 59 ± 2% and 19 ± 2%, respectively, and 23 ± 2% for the slow component). Data are presented as mean ± SEM; n = number of recorded cells; *P < 0.05, **P < 0.01, ***P < 0.001 (one-way ANOVA with Dunnett’s post hoc test or ANOVA on ranks with Dunn’s post hoc test). See ‘Materials and methods’ section for detailed explanations of the standard gating parameters that are listed here.
Recovery from fast inactivation was evaluated by paired depolarization steps with different time intervals (Fig. 1F and Supplementary Fig. 1B). First-order exponential functions with an initial delay were well fit to the recovery time course, except for the A1622D mutation, for which a second-order exponential function was better suited (Table 1). The analysis indicated that both R1620L and A1622D mutations significantly accelerated the recovery from fast inactivation, whereas there was no change for E1483K and R1872W mutations compared to the wild-type (Fig. 1F and Table 1). Normalized Na+ current traces at 0 mV are shown in Fig. 1G, indicating that the A1622D mutation markedly delayed the transition from the activated to the fast inactivated state, whereas such effects were less pronounced for the R1620L and R1872W mutations. This was quantified by the time constant of fast inactivation, τh, which is plotted versus voltage in Fig. 1H. There was little voltage dependence of τh for A1622D mutant channels. To visualize a persistent Na+ current, a slowly depolarizing ramp stimulus from −100 to +40 mV lasting 800 ms was applied and the responses were normalized to the maximum transient peak Na+ currents (Fig. 1I). There was a large ramp current for the A1622D mutation corresponding to a high persistent current that was not observed for the wild-type or any of the other mutations.
Taken together, we observed no significant changes of biophysical properties for the E1483K mutation compared to the wild-type (see also Supplementary Fig. 1 for slow inactivation), clear gain-of-function effects for the R1872W mutation, a dominating gain-of-function for the A1622D mutation, however accompanied by a loss-of-function in form of the depolarizing shift of the activation curve, and finally a dominant loss-of-function for the R1620L mutation (with slighter gain-of-function effects).
Current-clamp recordings in transfected hippocampal neurons
As patients carrying the examined SCN8A mutations display different types of neuropsychiatric disorders and since our results in the neuroblastoma cell line can only explain in part the marked phenotypic differences with and without seizures, the logical next step was to examine all four mutations also in neurons. The constructs carrying a TTX-resistance were transfected into primary murine cultured hippocampal neurons and electrophysiological recordings were performed to determine intrinsic and action potential firing properties. Immunohistochemical studies showed that the recorded neurons exhibited no fluorescence for GAD67, which is a marker for inhibitory neurons, suggesting that we recorded from a population of excitatory neurons (Supplementary Fig. 2A and B). Significant expression of TTX-resistant Nav1.6 channels in transfected neurons was verified by the presence of a Na+ current when 500 nM TTX was added to the bathing solution (Supplementary Fig. 2C).
A first series of experiments was conducted in the absence of TTX, so that transfected Nav1.6 and all endogenous Na+ channels jointly determined the properties of transfected neurons, mimicking a heterozygous condition in patients (however, it has to be considered that two endogenous wild-type alleles are present and that the amount of transfected channels is highly variable). Action potentials were recorded upon a series of current injections ranging from −50 to 300 pA (Fig. 2A). Whereas the firing frequency looked similar for neurons transfected with wild-type, E1483K or R1620L channels, there was a clear increase in firing frequency of neurons transfected with R1872W channels. Neurons transfected with the A1622D mutant channel behaved differently. After an initial action potential, transfected neurons showed long-lasting depolarizations with a block of action potential firing. These depolarization blocks could be overcome with higher current injections and were observed in 10/19 transfected neurons, which may be due to a varying amount of transfected channels (Supplementary Fig. 3). The number of action potentials was plotted against the amount of injected current revealing the input-output relationships for each mutant against the wild-type (Fig. 2B). The action potential frequency increased with increasing current injections, but decreased again upon strong stimuli. For statistical evaluation, we only regarded recordings up to current injections of 0.15 nA (vertical dashed line) and analysed the area under the curve. The analysis confirmed a significantly increased firing rate for neurons transfected with R1872W compared to wild-type channels, but no differences among wild-type and the other three mutants on average. For neurons transfected with A1622D channels this seemed unexpected but can be explained by the variable amount of transfected channels yielding not always the observed depolarization block.
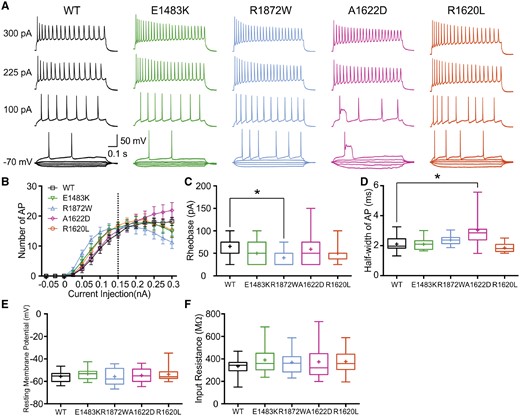
Effects of transfected human mutant Nav1.6 channels on the properties of primary cultured hippocampal mouse neurons. Neurons were transfected with human wild-type (WT) or mutant Nav1.6 channels. Intrinsic neuronal and firing properties were recorded in the absence of TTX. (A) Representative voltage traces of evoked action potentials (APs) recorded in the current clamp mode for neurons transfected with wild-type, E1483K, R1872W, A1622D, or R1620L channels, respectively. (B) Number of action potentials plotted versus injected current. The data points left of the dashed line were analysed together as the area under the curve. Shown are means ± SEM for each data point (wild-type, n = 16; E1483K, n = 16; R1872W, n = 15; A1622D, n = 19; R1620L, n = 13). The corresponding values for the area under the curve are given in Table 2 (significant for R1872W versus wild-type). (C) Rheobase (minimal injected current to elicit an action potential) for transfected wild-type and mutant channels. Only transfected R1872W channels significantly reduced the rheobase compared to the wild-type. (D) Half-width of single action potentials (cf.Supplementary Fig. 4), which was significantly increased for neurons transfected with A1622D mutant channels. (E and F) Resting membrane potentials (E) and input resistances (F) were not significantly different between neurons transfected with wild-type or mutant channels. Box-and-whisker plots (C–F) show means (plus sign), the 25th, 50th and 75th percentiles, minima and maxima; *P < 0.05; one-way ANOVA with Dunnett’s post hoc test or ANOVA on ranks with Dunn’s post hoc test were performed. Exact values and statistical analyses are provided in Table 2.
We also found the minimal current to induce action potential firing (rheobase) to be significantly reduced for neurons transfected with R1872W channels (Fig. 2C and Table 2). Peak amplitudes and thresholds of single action potential firing were not different among the five tested conditions, but action potential width determined at half maximal amplitude was markedly increased for neurons transfected with A1622D mutant channels (Fig. 2D and Table 2). In addition, there were no significant differences found for resting membrane potentials or for input resistances for all conditions (Fig. 2E, F and Table 2).
Intrinsic neuronal properties and single action potential parameters in transfected neurons in the absence of TTX
| Transfected Nav 1.6 channel | Resting membrane potential, mV | Input resistance, MΩ | Action potential | Rheobase, pA | I/O area under the curve, nA | n | ||
|---|---|---|---|---|---|---|---|---|
| Peak amplitude, mV | Half-width, ms | Threshold, mV | ||||||
| Wild-type | −55.6 ± 1.2 | 335 ± 19 | 130.3 ± 2.9 | 2.1 ± 0.1 | −33.1 ± 1.5 | 65.6 ± 4.5 | 0.9 ± 0.1 | 16 |
| E1483K | −53.3 ± 1.3 | 391 ± 29 | 127.7 ± 1.6 | 2.1 ± 0.1 | −34.4 ± 1.3 | 50.0 ± 6.0 | 1.2 ± 0.2 | 16 |
| R1872W | −55.8 ± 2.0 | 370 ± 24 | 123.5 ± 2.8 | 2.4 ± 0.1 | −36.7 ± 1.4 | 40.0 ± 4.8** | 1.4 ± 0.2* | 15 |
| A1622D | −53.7 ± 1.8 | 374 ± 31 | 126.1 ± 2.2 | 3.0 ± 0.2*** | −30.8 ± 1.3 | 59.2 ± 7.2 | 0.9 ± 0.1 | 19 |
| R1620L | −54.8 ± 1.5 | 376 ± 29 | 129.3 ± 1.8 | 1.9 ± 0.1 | −33.1 ± 1.1 | 50.0 ± 5.6 | 1.1 ± 0.1 | 13 |
I/O = input-output curve. The I/O area under the curve was determined left to the dashed line drawn in Fig. 2B. Data are presented as means ± SEM; n = number of recorded neurons; *P < 0.05, **P < 0.01, ***P < 0.001 (one-way ANOVA with Dunnett’s post hoc test or ANOVA on ranks with Dunn’s post hoc test).
We next examined the same properties of neurons expressing transfected wild-type or mutant channels in the presence of TTX, so that neuronal functions were carried only by the transfected, TTX-resistant Na+ channels (Fig. 3). Whereas only few action potentials could be elicited in neurons transfected with wild-type channels, for both epilepsy-causing mutants, E1483K and R1872W, robust firing patterns could be obtained yielding significant increases of the area under the curve for the input-output relationships (Fig. 3B and Table 3). The rheobase was also significantly decreased for both mutations (Fig. 3C and Table 3). In contrast, the A1622D mutation induced a depolarization block upon small current injections but robust firing upon large current injections, yielding a biphasic input-output relationship (Fig. 3A and B). Single action potentials showed an increased half-width for this mutation (Fig. 3D and Table 3). Furthermore, the A1622D mutation increased the threshold to elicit an action potential compared to the wild-type, which reflects the depolarizing shift of the activation curve caused by this mutation (Fig. 1C, D and Table 1). Neurons transfected with R1620L channels failed to generate action potentials, presumably due to the small Na+ currents (Supplementary Fig. 2), consistent with our findings in ND7/23 cells (Fig. 1).
Intrinsic neuronal properties and single action potential parameters in transfected neurons in the presence of TTX
| Transfected Nav1.6 channel | Resting membrane potential, mV | Input resistance, MΩ | Action potential | Rheobase, pA | I/O area under the curve, nA | n | ||
|---|---|---|---|---|---|---|---|---|
| Peak amplitude, mV | Half-width, ms | Threshold, mV | ||||||
| Wild-type | −56.5 ± 1.1 | 289.7 ± 29.1 | 89.2 ± 6.3 | 3.9 ± 0.6 | −26.4 ± 2.6 | 165.9 ± 21.4 | 0.6 ± 0.2 | 15 |
| E1483K | −53.7 ± 1.4 | 315.6 ± 16.9 | 97.1 ± 3.8 | 3.5 ± 0.3 | −29.4 ± 1.9 | 101.9 ± 19.3* | 1.8 ± 0.4* | 14 |
| R1872W | −56.2 ± 1.4 | 311.2 ± 20.9 | 101.6 ± 6.4 | 3.2 ± 0.3 | −30.0 ± 3.2 | 80.6 ± 13.0* | 2.9 ± 0.6*** | 10 |
| A1622D | −55.3 ± 1.8 | 326.1 ± 25.4 | 101.8 ± 3.7 | 13.6 ± 5.3* | −15.8 ± 1.9** | 139.6 ± 16.1 | 1.3 ± 0.3 | 12 |
| R1620L | −56.5 ± 1.6 | 272.9 ± 22.0 | - | - | - | - | 0 | 8 |
Neurons transfected with R1620L mutant channels did not exhibit action potential firing upon current injection, hence no parameters of single action potential were listed. I/O = input-output curve. Data are presented as mean ± SEM; n = number of recorded neurons; *P < 0.05, **P < 0.01, ***P < 0.001 (one-way ANOVA with Dunnett’s post hoc test or ANOVA on ranks with Dunn’s post hoc test).
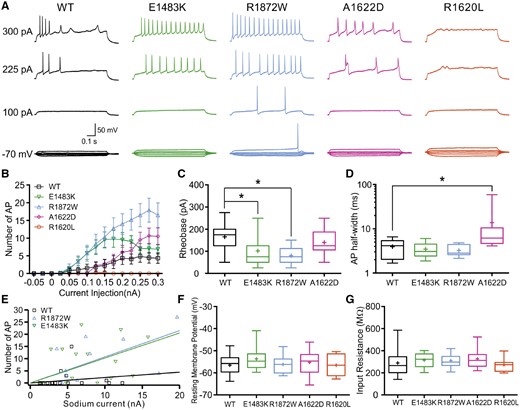
Intrinsic neuronal and firing properties carried only by transfected wild-type or mutant channels. Hippocampal neurons were transfected with TTX-resistant wild-type (WT) or mutant Nav1.6 channels. Neuronal properties were recorded in the presence of TTX to block all other endogenous voltage-gated Na+ channels. (A) Representative traces of evoked action potentials recorded in the current clamp mode in neurons transfected with wild-type, E1483K, R1872W, A1622D, or R1620L channels, respectively. Neurons expressing R1620L mutant channels under these conditions failed to fire action potentials. (B) Number of action potentials plotted versus injected current. Shown are means ± SEM for each data point (wild-type, n = 15; E1483K, n = 14; R1872W, n = 10; A1622D, n = 12; R1620L, n = 8). The area under the curve was determined for each neuron over the whole range of current injections; respective values were significantly different for neurons transfected with E1483K or R1872W compared to those transfected with wild-type channels (Table 3). (C) Rheobase (minimal injected current to elicit an action potential) for neurons transfected with wild-type or mutant channels. Transfections of both R1872W and E1483K mutant channels significantly reduced the rheobase compared to wild-type channels. (D) Half-width of single action potentials, which was increased for neurons transfected with A1622D mutant channels. (E) Linear regression between the number of action potentials elicited by 150 pA current injection and the maximal peak Na+ current for neurons transfected with wild-type or the two epilepsy-causing mutants. Both mutations caused an increase of the slope compared to wild-type (wild-type, 0.22 ± 0.17; E1483K, 1.03 ± 0.26; R1872W, 1.08 ± 0.24; **P < 0.01 for both mutants, ANOVA on ranks with Dunn’s post hoc test). (F and G) Resting membrane potentials (F) and input resistance (G) were not significantly different between neurons transfected with wild-type or mutant channels. Box-and-whisker plots (C, D, F and G) show means (plus sign), the 25th, 50th and 75th percentiles, minima and maxima; *P < 0.05; one-way ANOVA with Dunnett’s post hoc test or ANOVA on ranks with Dunn’s post hoc test were performed. Exact values and statistical analysis are provided in Table 3.
The possibility that the enhanced action potential firing in neurons expressing E1483K or R1872W channels was due to larger Na+ currents was excluded by comparing the peak Na+ current amplitudes in transfected neurons, yielding no significant differences (Supplementary Fig. 2). Furthermore, we correlated the number of action potentials elicited by 150 pA current injection with the peak Na+ current amplitude obtained from each transfected neuron (Fig. 3E, maximized differences in the input-output curves at 150 pA, cf.Fig. 3B). The results revealed a significant increase of the respective slopes of linear regressions for both the R1872W and the E1483K mutation compared to the wild-type. The higher firing rates in neurons expressing R1872W or E1483K channels can therefore be interpreted as a result of altered Na+ channel properties, which can be well explained for R1872W channels by our findings in ND7/23 cells, but which were obviously below a statistically detectable threshold for E1483K channels.
Modelling of neuronal firing
To better understand the voltage responses following Na+ currents carried by A1622D mutant channels, we simulated a standard single-compartment conductance-based model with a Na+ and a K+ conductance plus a leak current (Wang and Buzsáki, 1996). This model generated regular spiking under a constant current injection, as was observed for the firing of cultured neurons transfected with wild-type channels (Fig. 4A).
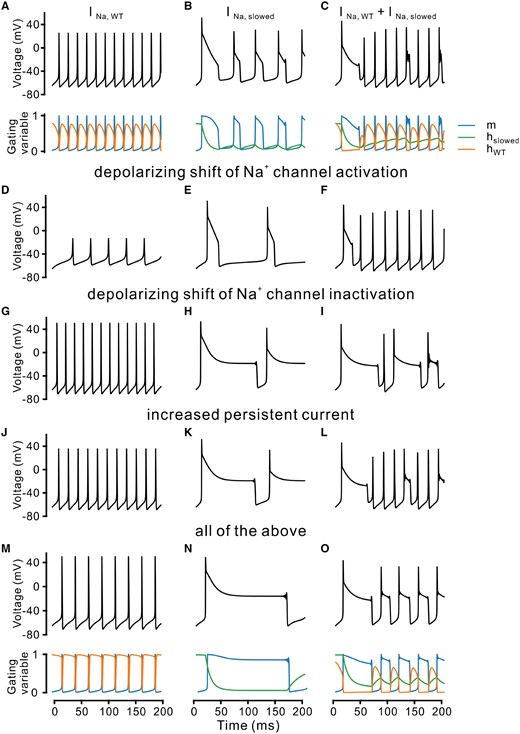
Modelling action potential firing behaviour using different Na+ channel gating parameters. (A) A single compartment conductance-based model was used to qualitatively simulate the action potential firing in neurons using a wild-type Na+ channel (see ‘Materials and methods’ section). Top: Voltage traces of the model neuron; Bottom: Time courses of corresponding gating variables for activation (m, blue) and inactivation (hWT, orange). (B and C) Same condition as in A with a slowed inactivation (hslowed, green) alone (B) or in combination with a fast wild-type channel (C). (D–F) Same as top traces in A–C, with an additional depolarizing shift of the activation process (m). (G–I) Same as top traces in A–C, with an additional depolarizing shift of the inactivation process (h). (J–L) Same as top traces in A–C, with an additional persistent current (see ‘Materials and methods’ section). (M–O) Same as A–C (top and bottom traces), adding all changes used in D–L.
To provide a qualitative simulation of firing based on the A1622 mutation, we first strongly slowed the fast inactivation time constant. This introduced long-lasting, slowly decaying depolarizations, since the Na+ current needs much more time to inactivate. It was observed for both conditions that we tested also in neurons, with mutant channels alone (TTX condition) and a combination of wild-type and mutant channels (Fig. 4B and C). We next also considered the other observed gating changes on activation and inactivation curves and persistent Na+ current. Interestingly, the computed voltage responses resembled those obtained when A1622D channels were transfected in neurons (Figs 2 and 3). Particularly, the depolarizing plateaus occurred also in the model when considering the slowing of the inactivation process together with a depolarizing shift of the inactivation curve and a persistent current (Fig. 4H–O).
Characterization of three additional mutations causing epilepsy or intellectual disability
To confirm our results, we examined three more SCN8A mutations that cause either intermediate or severe epilepsy (G1475R, M1760I), or intellectual disability without epilepsy (G964R). All three mutations were introduced into the TTX-resistant Nav1.6 channel and characterized in both neuroblastoma cells (except G964R, which had been previously recorded revealing a complete loss-of-function; Wagnon et al., 2017) and primary cultured hippocampal neurons, as in the previous experiments. A new series of wild-type channels was examined in parallel to ensure the same conditions for controls. The G1475R mutation induced a shift of the steady state fast inactivation curve towards more depolarized potentials (wild-type, V1/2 = − 65.5 ± 0.5 mV, n = 19; G1475R, V1/2 = − 55.2 ± 0.7 mV, n = 15, ***P < 0.001, one-way ANOVA with Dunnett’s post hoc test), and accelerated the recovery from fast inactivation (wild-type, τrec at − 100 mV = 3.9 ± 0.3 ms, n = 17; G1475R, τrec at − 100 mV = 3.0 ± 0.2 ms, n = 13, *P < 0.05, ANOVA on ranks with Dunn’s post hoc test) compared to wild-type channels (Supplementary Fig. 5D and E). The M1760I mutation caused a significant hyperpolarizing shift of the activation curve (wild-type, V1/2 = − 20.6 ± 0.9 mV, n = 23; M1760I, V1/2 = − 27.2 ± 0.9 mV, n = 21, ***P < 0.001, one-way ANOVA with Dunnett’s post hoc test) compared to wild-type in ND7/23 cells (Supplementary Fig. 5C). Both G1475R and M1760I mutations delayed the transition from the activated to the fast inactivated state (wild-type, τh at 0 mV = 0.38 ± 0.01 ms, n = 23; G1475R, τh at 0 m V = 0.57 ± 0.03 ms, n = 16, ***P < 0.001; M1760I, τh at 0 mV = 0.57 ± 0.02 ms, n = 21, ***P < 0.001; ANOVA on ranks with Dunn’s post hoc test; Supplementary Fig. 5F), and M1760I channels also revealed a different voltage dependence (wild-type, k = 4.8 ± 0.1, n = 19; M1760I; k = 5.2 ± 0.1, n = 20, *P < 0.05, ANOVA on ranks with Dunn’s post hoc test; Supplementary Fig. 5D). The peak current density and ramp current for both G1475R and M1760I mutant channels were comparable with wild-type channels (Supplementary Fig. 5B and G). In summary, G1745R and M1760I caused different gain-of-function effects, whereas G964R (Wagnon et al., 2017) caused a loss-of-function effect in ND7/23 cells.
Next, the three additional SCN8A mutant channels (and for direct comparison wild-type channels) were transfected into cultured neurons and examined in the absence and presence of TTX, as previously described. The M1760I mutation significantly increased the action potential firing frequency (the area under the input-output curve; wild-type, 3.4 ± 0.2, n = 16; M1760I, 4.9 ± 0.4, n = 14; *P < 0.05, one-way ANOVA with Dunnett's post hoc test; Supplementary Fig 6B) and reduced the rheobase (wild-type, 84 ± 7 pA, n = 16; M1760I, 52 ± 6 pA, n = 14; **P < 0.01, one-way ANOVA with Dunnett’s post hoc test; Supplementary Fig. 6C) compared to wild-type channels in the absence of TTX. These results were further confirmed in the presence of TTX (Supplementary Fig. 7). The transfection of G1475R mutant channels did not significantly alter the action potential firing in the absence of TTX (Supplementary Fig. 6), but increased firing in the presence of TTX (the area under the input-output curve; wild-type: 0.55 ± 0.18, n = 14; G1475R: 1.75 ± 0.31, n = 14; *P < 0.05, ANOVA on ranks with Dunn’s post hoc test; Supplementary Fig 7B). Neurons transfected with the G964R mutation exhibited almost no Na+ current in the presence of TTX and failed to generate action potentials, as expected for a loss-of-function mutation (Wagnon et al., 2017). The results were consistent with our previous observations that SCN8A mutations associated with epilepsy showed gain-of-function biophysical effects and increased neuronal firing, whereas SCN8A mutations associated with intellectual disability but not epilepsy expectedly decreased neuronal firing.
Discussion
Since the first patient with epilepsy caused by a SCN8A mutation was described (Veeramah et al., 2012), the phenotypic spectrum has been expanding considerably. It includes a range of epilepsies, from benign familial infantile seizures and paroxysmal dyskinesia (Gardella et al., 2016) to severe early-infantile epileptic encephalopathies (EIEE13) (Meisler et al., 2016), and also a few cases without epilepsy (Trudeau et al., 2006; Wagnon et al., 2017). Our study was designed to investigate mutations covering this phenotypic spectrum to understand the underlying mechanisms and to correlate genotypes with phenotypes.
Importance of functional studies in neurons
Our results revealed that (i) even in the absence of significant biophysical changes E1483K causing mild epilepsy increased neuronal firing in neurons; and (ii) R1872W causing severe epilepsy induced biophysical gain-of-function changes and led to a stronger increase of neuronal firing. These findings were complemented by studying the G1475R and M1760I mutations (causing intermediate or severe epilepsy, respectively), adding that a depolarizing shift of steady-state inactivation, mild slowing of the inactivation time course and acceleration of its recovery, as observed for G1475R, have less impact on neuronal firing than the hyperpolarizing shift of steady state activation observed for M1760I. Interestingly, (iii) one of the mutations (A1622D) associated with severe developmental delay and intellectual disability without epilepsy caused a tremendous slowing of inactivation, which was the dominant feature in our model, but led to decreased neuronal firing due to a depolarization block; and (iv) R1620L and G964R, associated with developmental delay, intellectual disability or autism—but not epilepsy—induced a complete loss of channel function and expectedly decreased firing. There is thus a good relationship between the neurophysiological behaviour induced by the mutations and the clinical phenotype. In contrast, the biophysical studies alone could only partially explain the different phenotypes. In particular, the E1483K mutation could have been considered as a benign polymorphism and it would have been difficult to understand that the A1622D mutation does not cause seizures. Only a combination of investigations in a cell line, allowing a detailed characterization of the biophysical properties of mutant versus wild-type channels without space clamp artefacts and contamination of endogenous channels, and experiments in transfected neurons, studying the neurophysiological consequences of mutations in both the presence and absence of endogenous channels, enabled us to disentangle the disease mechanisms of all mutations. Our observations thus clearly reveal that studies in neurons are indispensable to (i) detect subtle functional changes introduced by mutations that may remain unrecognized in biophysical studies (E1483K); (ii) help to weigh observed biophysical changes with regard to their consequences on neuronal firing (G1457R versus M1760I and R1872W); and (iii) understand that a predominant gain-of-function (slowing of inactivation) on a molecular level can turn into a loss-of-function on a neuronal level (A1622D).
Phenotypes associated with gain- or loss-of-function effects in Nav1.6 channels
Our results suggest that mutations causing increased firing in neurons cause mild or severe epilepsy with or without intellectual disability, whereas those decreasing firing cause developmental delay, intellectual disability or autism alone without seizures. This is consistent with most of the few published mutations that have been functionally examined so far. Mutations with clear gain-of-function cause more or less severe EIEE13 (Veeramah et al., 2012; Estacion et al., 2014; Blanchard et al., 2015; Barker et al., 2016; Wagnon et al., 2016), whereas mutations with clear loss-of-function cause developmental delay, intellectual disability or autism without epilepsy (Trudeau et al., 2006; Wagnon et al., 2017). However, two other mutations with a partial or complete loss-of-function have been described to be associated with epilepsy (de Kovel et al., 2014; Blanchard et al., 2015; Møller et al., 2016). For one of these mutations (R223G), mixed loss- and gain-of-function effects were observed (de Kovel et al., 2014) at different incubation temperatures with decreased current density but increased relative ramp currents. Although the authors argued that because of the severe reduction in current density the increased ramp current may not be biologically relevant, a detailed study of other gating parameters and studies in neurons were not performed. A net gain-of-function causing increased firing in transfected neurons may therefore still be possible, as it was observed for another mutation in SCN1A associated with familial hemiplegic migraine, which showed a similar combination of gating effects causing increased firing in neurons (Cestele et al., 2013). The other mutation (G1451S) causes a complete loss-of-function, but is associated with a somewhat different phenotype with a later onset (18 months) and absence plus generalized tonic-clonic seizures (Blanchard et al., 2015). Interestingly, a mouse model with a heterozygous Scn8a null allele also showed increased spike and wave activity associated with absence-like seizures (Papale et al., 2009). Recently, this result was corroborated by a study using conditional mouse models showing that a knockout of Scn8a in inhibitory neurons of the reticular thalamic nucleus is essential to cause absence seizures (Makinson et al., 2017). Moreover, unpublished results from our groups suggest that nonsense mutations can also cause absence seizures but not EIEE13.
Further studies in larger cohorts of patients and functional investigations in neurons and whole mice (Lopez-Santiago et al., 2017; Ottolini et al., 2017), including investigations of network effects, are clearly necessary to fully understand genotype–phenotype correlations and the different SCN8A-mediated disease mechanisms. This is particularly important as the channel is widely expressed in all brain areas both in excitatory and inhibitory neurons (Vacher et al., 2008) leading to different network effects in distinct brain circuits.
Specific aspects of the investigated mutations
All mutations substitute highly conserved amino acids and are located in functionally important and highly conserved regions of the Na+ channel. In silico programmes predict that all have damaging effects on channel function (Table 4). None of the mutations have been detected to date in one of the known databases (gnomAD, ExAC, dbSNP), but G1475R, E1483K and R1872W have been described recurrently in independent patients with epilepsy. Because of the location of G1475R and E1483K mutations in the DIII-DIV linker, which is supposed to contain the inactivation gate (Catterall et al., 2017), it was unexpected that no biophysical change was found for E1483K. As studies in neurons clearly revealed an increased firing, which was similar for both mutations, we assume that functional alterations were too small to be detected for E1483K. Interestingly, three substitutions for the corresponding glycine to G1475 of the skeletal muscle Na+ channel gene SCN4A (G1306) cause myotonia of different severity and show similar biophysical changes as observed here for G1475R (Lerche et al., 1993; Mitrović et al., 1995). G1475/G1306 is the first of two adjacent glycines that were proposed to serve as a gating hinge for the inactivation particle IFM (isoleucine-phenylalanine-methionine) (Kellenberger et al., 1997).
In silico predictions of pathogenicity
| Location | Allele | CDNA position | AA change | Codons | dbSNp | SIFT | PolyPhen-2 | MutationTaster |
|---|---|---|---|---|---|---|---|---|
| 12:52184209 | A | 4625 | p.E1483K | Gaa/Aaa | rs879255652 | Deleterious (0) | Possibly damaging (0.705) | Disease-causing (0.999) |
| 12:52200884 | T | 5792 | p.R1872W | Cgg/Tgg | rs796053228 | Deleterious (0) | Probably_damaging (1) | Disease-causing (0.999) |
| 12:52200135 | A | 5043 | p.A1622D | gCc/gAc | - | Deleterious (0) | Probably_damaging (0.995) | Disease-causing (0.999) |
| 12:52200129 | T | 5037 | p.R1620L | cGa/cTa | rs869312966 | Deleterious (0) | Probably_damaging (0.993) | Disease-causing (0.999) |
| 12:52184185 | C | 4423 | p.G1475R | Gga/Cga | - | Tolerated (0.11) | Benign (0.226) | Disease-causing (0.999) |
| 12:52200550 | A | 5280 | p.M1760I | atG/atA | - | Deleterious (0) | Possibly_damaging (0.714) | Disease-causing (0.999) |
| 12:52159800 | C | 2890 | p.G964R | Ggc/Cgc | rs1057521662 | Deleterious (0) | Possibly_damaging (0.768) | Disease-causing (0.999) |
Results of three prediction software programs (SIFT, PolyPhen-2 and MutationTaster) for the seven examined mutations in the gene SCN8A (ENST00000354534/ NM_014191).
The arginine at position 1872 seems to represent a mutational hotspot, as different types of amino acid substitutions have been detected (R1872L/Q/W), all of them recurrently (L/Q/W) (Larsen et al., 2015; Wagnon et al., 2016; Lindy et al., 2018). All mutations cause similar phenotypes (EIEE13) (Ohba et al., 2014; Larsen et al., 2015; Wagnon et al., 2016) and comparable electrophysiological deficits, which were studied either in the murine (Wagnon et al., 2016) or in the human (this study) (Atkin et al., 2018) Nav1.6 channel. Wagnon et al. (2016) first reported for murine R1872W channels in ND7/23 cells caused a significant increase of current density and delayed inactivation compared to wild-type channels. We co-transfected human R1872W mutant channels with both β1 and β2 subunits into ND7/23 cells and also observed delayed inactivation, but no increase in current density and an additional hyperpolarizing shift of the activation curve. The differences may be due to the inclusion of the β-subunits, since they can modify kinetics and expression of Nav channels (Hull and Isom, 2018). Also murine R1872Q and R1872L mutations were characterized in ND7/23 cells (Wagnon et al., 2016). Both mutations lead to a hyperpolarizing shift of the activation curve and delayed inactivation, similar to our results for R1872W. In addition, R1872L enhanced the persistent current and R1872Q caused a depolarizing shift of the inactivation curve. Also consistent with our results, Atkin et al. (2018) found for human R1872Q channels expressed in HEK 293 cells a hyperpolarizing shift of the activation curve and delayed inactivation, but did not observe a depolarizing shift of the inactivation curve. All results thus indicate similar changes, but underline that Nav1.6 channels from different species co-expressed with β-subunits in distinct cell lines can lead to slight biophysical differences.
The C-terminal part of the channel in which R1872 is located has been described to be important for both fast inactivation and activation of different types of voltage-gated Na+ channels (Mantegazza et al., 2001; Lenaeus et al., 2017).
Two mutations located in the DIV voltage sensor, which plays an important role for fast channel inactivation, but also for activation (Catterall et al., 2017) were not described previously. Although the mutations are very near to each other, our divergent results for both mutations show that it is difficult to predict functional changes based on the location or the nature of the amino acid substitution.
We investigated the effect on neuronal firing for the A1622D mutation using a simple one compartment computer model containing only a Na+, a K+ and a leak conductance. Notably, the gating changes of inactivation and activation enabled us to reproduce the observed changes on neuronal firing qualitatively, indicating that the mutation itself—without any additional secondary effects on transcription or expression of other proteins—may be sufficient to cause this kind of firing behaviour.
We conclude that mutations in the Na+ channel gene SCN8A cause a variety of neuropsychiatric phenotypes that are clearly correlated to distinct consequences of the mutations on channel gating and neuronal excitability. Studies in neurons, and in a next step in neuronal networks and mouse models, are essential to understand disease mechanisms and should be performed more widely in future investigations.
Abbreviation
Acknowledgements
We thank all the patients and their families for participating in this study; Dr. Snezana Maljevic, Dr. Ulrike Hedrich-Klimosch and Dr. Henner Koch for discussion of experiments and the manuscript; Dr. Gina Elsen for help with neuronal culture; Heidrun Löffler, Ana Fulgencio Maisch and Nicole Zepezauer for expert technical support.
Funding
This work was supported by the DFG Research Unit FOR2715, grants Le1030/15-1 and We4896/4-1, and by DFG grants Le1030/10-2 and We4896/3-1. L.S. was supported by the SMARTSTART Joint Program in Computational Neuroscience, funded by the Volkswagen Foundation. S.L. was supported by the Fortüne/Pate program of the Medical Faculty of the University of Tuebingen (grant number 2430-0-0).
Competing interests
The authors report no competing interests.

