


Abstract
Aims: To identify an optimal brief version of the Alcohol Use Disorders Identification Test (AUDIT) and to evaluate its effectiveness as a screening test for problem drinking (PD), alcohol use disorders (AUD) and alcohol dependence (AD). Methods: A multicenter trial was conducted from March, 2010, to January, 2012, in 101 normal comparison, 203 risky drinking, 92 alcohol abuse and 101 AD men aged below 65 years of age in a Korean population. For the purposes of screening, risky drinking, alcohol abuse and AD were grouped: all the three grouped as PD and the latter two grouped as AUD. Logistic regression analysis was used to determine the items among the 10-item AUDIT that provided information predictive of PD, AUD and AD. Receiver operating characteristic (ROC) curve analysis was performed to investigate the discrimination ability of the brief versions of AUDIT, 10-item AUDIT and Cut-down, Annoyed, Guilt, Eye-opener as a screen for PD, AUD and AD. Areas under the ROC curve were compared between tests according to the method suggested by Hanley and McNeil. Results: The 5-item AUDIT (AUDIT-5: AUDIT items 2, 4, 5, 9 and 10) was obtained by stepwise multiple regression analyses for each screening. AUDIT-5 exhibited an AUD screening accuracy significantly superior to that of the 10-item AUDIT, but other brief versions of AUDIT and CAGE did not. Furthermore, AUDIT-5 had a high PD and AD screening accuracy equivalent to that of the 10-item AUDIT. Conclusion: These results strongly support the usefulness of AUDIT-5 for screening of PD, AUD and AD in clinical settings in Korean male populations.
INTRODUCTION
The 10-item Alcohol Use Disorders Identification Test (AUDIT) is a widely used scale developed by the World Health Organization that screens for risky drinking, alcohol abuse and alcohol dependence (AD) (Saunders et al., 1993). Several studies have shown its validity and reliability (Bohn et al., 1995; Piccinelli et al., 1997). The 10-item AUDIT was originally designed to be used in primary care settings (Isaacson et al., 1994), but it has found several new applications, such as web-based screening (Saitz et al., 2004), national and regional epidemiological studies (Fleming, 1996; Mendoza-Sassi and Beria, 2003) and studies of alcohol problems among medical and psychiatric patient populations (Bradley et al., 1998; Fireman et al., 2005).
In spite of its practical advantages, the 10-item AUDIT has a limitation in terms of its application: its length makes it cumbersome in some settings where screening rapidity, as well as accuracy, is important. This had led some to favour brief screening tests if their screening accuracy is superior or comparable to the full version of AUDIT.
Several validity studies of CAGE (Cut-down, Annoyed, Guilt, Eye-opener) (Mayfield et al., 1974) and abbreviated versions of AUDIT such as AUDIT-3 (AUDIT item 3 only) (Gordon et al., 2001), AUDIT-C (AUDIT items 1, 2 and 3) (Bush et al., 1998) and AUDIT-PC (AUDIT items 1, 2, 4, 5 and 10) have been published (Piccinelli et al., 1997). CAGE had a lower screening accuracy for problem drinking (PD) (Adams et al., 1996) relative to that of the 10-item AUDIT, although it had a alcohol use disorders (AUD) screening ability equivalent to that of the 10-item AUDIT (Bradley et al., 1998). All these abbreviated versions of AUDIT contain mainly alcohol consumption factor (items 1–3) items, relative to those dealing with alcohol-related problems and dependence (items 4–10). Therefore, we hypothesized that these brief versions of AUDIT may more effectively screen for PD, but less so for AUD, relative to the 10-item AUDIT. Consistent with this hypothesis, several studies showed that the brief versions of AUDIT were superior or comparable to full AUDIT in PD screening and inferior in AUD screening (Bush et al., 1998; Aertgeerts et al., 2001). For this reason, we suggest that more research on brief AUDIT is necessary to determine its screening accuracy, i.e. in terms of screening for PD, AUD or AD.
The purpose of this study was to identify the brief AUDIT that most effectively screens for PD, AUD and AD, together with other brief or full versions of AUDIT and CAGE, among male Korean adults.
MATERIALS AND METHODS
Subjects
Study subjects were recruited from the pool of individuals registered in a programme for the early detection and management of alcoholism or alcohol addiction. This programme was conducted from March 2010 to January 2012, by the alcohol clinic of the Hallym University Hangang Sacred Heart Hospital with its health examination centre, and five alcohol clinics of alcohol-specialized hospitals. In this study, 101 patients with AD, 92 with alcohol abuse, 203 with risky drinking and 101 normal comparison (NC) individuals in the community were included. All the subjects were Korean male adults aged 20–64 years who lived in the community.
The following exclusion criteria were applied to all the subjects: (a) major medical conditions other than alcohol-related disorders; (b) major psychiatric disorders such as schizophrenia, mood disorders or substance-abuse disorders other than nicotine or caffeine dependence and (c) the presence of severe behavioural or communication problems that would make a clinical examination difficult.
Procedures
A provisional assessment of risky drinking was made by advanced research nurses according to the criteria of National Institute on Alcohol Abuse and Alcoholism (NIAAA) (National Institute on Alcohol Abuse and Alcoholism (US), 1995; Friedmann et al., 2001) based on an epidemiologic study that reported that men who consumed more than 14 drinks per week or 5 or more drinks on one occasion in the past year were at increased risk of alcohol-related problems (Dawson et al., 2005). Clinical diagnoses of alcohol abuse and AD, respectively, were made according to the criteria of the fourth edition of the Diagnostic and Statistical Manual of Mental Disorders (American Psychiatric Association and American Psychiatric Association Task Force on DSM-IV., 1994) by neuropsychiatrists with advanced training in alcohol-related research. A clinical diagnosis of risky drinking was finally made by neuropsychiatrists when neither alcohol abuse nor AD criteria were satisfied.
All the subjects underwent a clinical interview including a detailed medication history; psychiatric, general physical and neurological examinations and routine laboratory tests. A panel consisting of three neuropsychiatrists with expertise in alcohol-related research made clinical decisions, including diagnosis, after reviewing all the available raw data except for the AUDIT and the CAGE results. For the purposes of screening, risky drinking, alcohol abuse and AD were grouped: all the three generally grouped as PD (Bradley et al., 1998) and the latter two grouped as AUD (Babor et al., 2001).
All the subjects were also examined by research nurses with advanced training in alcohol-related research who were blind to the diagnosis of subjects according to the identification questionnaire, the Korean version of the 10-item AUDIT (Kim et al., 1999) and CAGE (Park et al., 2000). To avoid repeated questions, AUDIT-3, AUDIT-C and AUDIT-PC were performed through analyses of the items extracted from the 10-item AUDIT.
The Institutional Review Board of the Hallym University Hangang Sacred Heart Hospital, Korea, approved the study, and the subjects provided written informed consent.
Statistical analysis
Between-group comparisons for continuous data including demographic and clinical data were performed using two-tailed t-tests. Categorical data were analysed by the χ2 test. Logistic regression analysis was used to determine the items among the 10-item AUDIT that provided information predictive of PD, AUD and AD. In the reliability study, Cronbach's alpha was used to investigate the internal consistency of the screening instruments. In the concurrent validity study, Pearson correlation analysis was used to assess the relationship between tests. In the predictive validity study, receiver operating characteristic (ROC) curve analysis was performed to investigate the discrimination ability of the brief versions of AUDIT, 10-item AUDIT and CAGE as a screen for PD, AUD and AD. Area under the ROC curve (AUC) was compared between the tests, according to the method suggested by Hanley and McNeil (1983). Cut-off scores that maximized sensitivity and specificity values and that presented the highest accuracy values were selected.
The level of statistical significance was set as a two-tailed P < 0.05. Statistical analyses for ROC curves analysis were performed using MedCalc for Windows, version 12.1 (MedCalc Software, Mariakerke, Belgium). All analyses other than ROC curve analysis were performed using the SPSS software, version 15.0 (SPSS Inc., Chicago, IL, USA).
RESULTS
Demographic and clinical characteristics
The demographic and clinical characteristics of the subjects are summarized in Table 1. Among the patients with PD (n = 396), 203 (51.3%) had diagnosed risky drinking, and 193 (48.7%) had AUD (92 alcohol abuse and 101 AD). One hundred and one subjects were NC.
Demographic and clinical characteristics of the subjects (n = 497)
| Non-PD (NC) | PD (RD + AUD) | Non-AUD (NC + RD) | AUD (AA + AD) | Non-AD (NC + AUD) | AD | |
|---|---|---|---|---|---|---|
| n | 101 | 396 | 304 | 193 | 396 | 101 |
| Age (years) | 42.37 ± 11.13 | 41.10 ± 9.91 | 39.85 ± 10.95 | 42.94 ± 8.85 | 39.81 ± 10.56 | 44.89 ± 7.92 |
| %Male | 100 | 100 | 100 | 100 | 100 | 100 |
| First drinking age | 19.57 ± 4.02 | 18.72 ± 3.14 | 19.33 ± 3.40 | 18.16 ± 3.13 | 19.22 ± 3.16 | 17.53 ± 3.72 |
| Family history of AD (±) | 5/93 | 47/339 | 17/284 | 35/148 | 25/368 | 27/64 |
| AUDIT | ||||||
| Full AUDIT | 2.78 ± 2.10 | 16.50 ± 8.75 | 8.20 ± 5.03 | 22.60 ± 8.30 | 10.20 ± 6.09 | 28.01 ± 7.18 |
| Brief AUDIT | ||||||
| AUDIT-5 | 0.66 ± 0.80 | 7.95 ± 4.79 | 3.37 ± 2.56 | 11.45 ± 4.32 | 4.57 ± 3.37 | 14.20 ± 3.64 |
| AUDIT-3 | 0.59 ± 0.70 | 2.70 ± 0.92 | 1.80 ± 1.16 | 3.04 ± 0.87 | 2.00 ± 1.14 | 3.39 ± 0.82 |
| AUDIT-C | 2.34 ± 1.70 | 8.70 ± 2.06 | 6.07 ± 3.11 | 9.64 ± 1.85 | 6.70 ± 3.03 | 10.47 ± 1.76 |
| AUDIT-PC | 1.94 ± 1.44 | 10.07 ± 4.54 | 5.39 ± 3.16 | 13.31 ± 4.00 | 6.60 ± 3.74 | 15.88 ± 3.24 |
| CAGE | 0.75 ± 0.92 | 1.95 ± 1.36 | 0.92 ± 0.83 | 3.01 ± 1.07 | 1.30 ± 1.10 | 3.50 ± 0.94 |
| GGT(IU/l) | 28.04 ± 18.00 | 76.27 ± 96.32 | 44.30 ± 44.18 | 98.24 ± 120.05 | 48.13 ± 46.83 | 128.00 ± 146.70 |
Data are presented as mean ± SD or number (%).
PD, problem drinking; AUD, alcohol use disorders; AD, alcohol dependence; NC, normal comparison; RD, risky drinking; AA, alcohol abuse; AUDIT, Alcohol Use Disorders Identification Test; GGT, gamma-glutamyltransferase.
Proposal of an effective new brief version of AUDIT: AUDIT-5
Stepwise logistic regression analyses were performed to identify the optimal combinations of items in the 10-item AUDIT that minimized probability of misclassification between subjects with and without PD, AUD and AD over that given by the 10-item AUDIT. A stepwise selection of predictor items was adopted using the likelihood ratio statistic as a test for entry and removal of the items at P < 0.05 and P < 0.10, respectively.
On the basis of the final models derived from stepwise logistic regression analyses, 1, 5 and 6 items that highly contributed to screening accuracy for PD, AUD and AD, respectively, were extracted from the AUDIT-10 items (item 2 for PD; items 2, 4, 5, 9 and 10 for AUD; items 2, 4, 5, 6, 9 and 10 for AD) (Table 2). Split-half analysis was performed to increase the reliability and generalizability in different samples. In randomized two splitting current samples, the items were extracted using one half (n = 249; item 2 for PD; items 2, 4, 5, 9 and 10 for AUD; items 5, 6 and 10 for AD), and the items were extracted using the other half (n = 248; item 2 for PD; items 4, 5, 9 and 10 for AUD; items 4, 6 and 10 for AD). On the basis of the conference consensus for clinical and statistical aspects, five items that highly contributed to screening accuracy covering PD, AUD and AD, respectively, were extracted from the retained items: item 2 (number of drinks on a typical occasion), item 4 (unable to stop drinking), item 5 (fail to do what was normally expected), item 9 (injure yourself or another person as a result of drinking) and item 10 (another person concerned about subject's drinking or suggested that subject cut-down). The 5-item Alcohol Use Disorders Identification Test (AUDIT-5) score was generated by summing the scores of these 5-item. The maximum AUDIT-5 score was 20 points.
Stepwise logistic regression analyses for selection of predictor items for PD, AUD and AD in a 10-item AUDIT (n = 497)
| B | SE | Wald | df | P | Exp(B) | 95% CI for Exp (B) | |
|---|---|---|---|---|---|---|---|
| PD screening | |||||||
| Final model | 1 | <0.001 | |||||
| Item 2 | 4.885 | 0.761 | 41.164 | 1 | <0.001 | 132.253 | 29.741–588.110 |
| AUD screening | |||||||
| Final model | 5 | <0.001 | |||||
| Item 2 | 0.499 | 0.175 | 8.114 | 1 | 0.004 | 1.647 | 1.168–2.321 |
| Item 4 | 0.680 | 0.175 | 15.078 | 1 | <0.001 | 1.974 | 1.400–2.782 |
| Item 5 | 1.401 | 0.253 | 30.725 | 1 | <0.001 | 4.059 | 2.473–6.661 |
| Item 9 | 1.011 | 0.211 | 22.883 | 1 | <0.001 | 2.748 | 1.816–4.158 |
| Item 10 | 0.647 | 0.102 | 39.950 | 1 | <0.001 | 1.909 | 1.562–2.333 |
| AD screening | |||||||
| Final model | 6 | <0.001 | |||||
| Item 2 | 0.627 | 0.294 | 4.553 | 1 | 0.033 | 1.873 | 1.052–3.332 |
| Item 4 | 0.443 | 0.204 | 4.713 | 1 | 0.030 | 1.558 | 1.044–2.324 |
| Item 5 | 0.757 | 0.250 | 9.198 | 1 | 0.002 | 2.133 | 1.307–3.480 |
| Item 6 | 0.844 | 0.219 | 14.841 | 1 | <0.001 | 2.326 | 1.514–3.573 |
| Item 9 | 0.351 | 0.165 | 4.548 | 1 | 0.033 | 1.421 | 1.029–1.962 |
| Item 10 | 0.660 | 0.147 | 20.060 | 1 | <0.001 | 1.935 | 1.450–2.584 |
PD, problem drinking; AUD, alcohol use disorders; AD, alcohol dependence; AUDIT, Alcohol Use Disorders Identification Test; B, slope coefficient; SE, standard error; df; degrees of freedom; EXP(B), logit coefficient; CI, confidence interval.
Internal consistency
The 10-item AUDIT had the highest internal consistency (0.918), followed by AUDIT-C (0.874), AUDIT-PC (0.839), AUDIT-5 (0.818) and CAGE (0.698). The internal consistency analysis yielded high Cronbach's alpha values for the full and all brief versions of AUDIT. CAGE exhibited an unsatisfactory consistency inferior to that of either the full or any of the brief versions of AUDIT.
Concurrent validity
All brief versions of AUDIT showed a high correlation with the 10-item AUDIT, with a coefficient of 0.969 for AUDIT-5, 0.976 for AUDIT-PC, 0.826 for AUDIT-C and 0.792 for AUDIT-3. CAGE presented a correlation coefficient of 0.743.
Predictive validity
ROC curves were constructed for each score (Fig. 1), and the AUC for each ROC curve was calculated. AUC, sensitivity, specificity and cut-off points of the full or brief versions of AUDIT and CAGE are shown in Table 3. The results of ROC curve comparisons between the full or brief versions of AUDIT and CAGE are presented in the following paragraphs.
AUCs and cut-off scores of AUDIT-5, 10-item AUDIT, other brief versions of AUDIT and CAGE in screening PD, AUD and AD (n = 497)
| PD screening | AUD screening | AD screening | |
|---|---|---|---|
| AUDIT-5 | |||
| AUC | 0.990a | 0.946b | 0.960c |
| SE | 0.00401 | 0.00947 | 0.0113 |
| 95% CI | 0.977–0.997 | 0.921–0.964 | 0.938–0.976 |
| Cut-off | >2 | >6 | >10 |
| Sen/Spe | 91.92/96.81 | 87.05/86.53 | 88.12/95.12 |
| 10-item AUDIT | |||
| AUC | 0.987d | 0.931e | 0.955c |
| SE | 0.00383 | 0.0109 | 0.0128 |
| 95% CI | 0.972–0.995 | 0.904–0.952 | 0.932–0.972 |
| Cut-off | >7 | >14 | >19 |
| Sen/Spe | 88.38/100.00 | 81.35/88.22 | 88.12/93.06 |
| AUDIT-3 | |||
| AUC | 0.942 | 0.777 | 0.820 |
| SE | 0.0109 | 0.0212 | 0.0256 |
| 95% CI | 0.917–0.961 | 0.737–0.814 | 0.783–0.854 |
| Cut-off | >1 | >2 | >2 |
| Sen/Spe | 88.89/87.63 | 78.76/65.33 | 88.12/57.40 |
| AUDIT-C | |||
| AUC | 0.991d | 0.822 | 0.857 |
| SE | 0.00315 | 0.0186 | 0.0221 |
| 95% CI | 0.977–0.997 | 0.784–0.855 | 0.822–0.887 |
| Cut-off | >5 | >7 | >9 |
| Sen/Spe | 93.94/98.94 | 85.49/61.62 | 74.26/81.75 |
| AUDIT-PC | |||
| AUC | 0.986d | 0.931e | 0.956c |
| SE | 0.00442 | 0.0109 | 0.0117 |
| 95% CI | 0.971–0.994 | 0.905–0.953 | 0.933–0.973 |
| Cut-off | >3 | >8 | >12 |
| Sen/Spe | 98.23/88.30 | 89.64/81.82 | 86.14/94.60 |
| CAGE | |||
| AUC | 0.756 | 0.914e | 0.915e |
| SE | 0.0258 | 0.0146 | 0.0193 |
| 95% CI | 0.715–0.794 | 0.886–0.938 | 0.886–0.939 |
| Cut-off | >0 | >1 | >2 |
| Sen/Spe | 84.37/50.52 | 89.01/76.59 | 87.78/83.89 |
AUDIT, Alcohol Use Disorders Identification Test; PD, problem drinking; AUD, alcohol use disorders; AD, alcohol dependence; SE, standard error; CI, confidence interval; Sen/Spe, sensitivity/specificity.
aSignificantly greater than those of AUDIT-3, AUDIT-PC and CAGE.
bSignificantly greater than those of 10-item AUDIT, AUDIT-3, AUDIT-C, AUDIT-PC and CAGE.
cSignificantly greater than those of AUDIT-3, AUDIT-C and CAGE.
dSignificantly greater than those of AUDIT-3 and CAGE.
eSignificantly greater than those of AUDIT-3 and AUDIT-C.
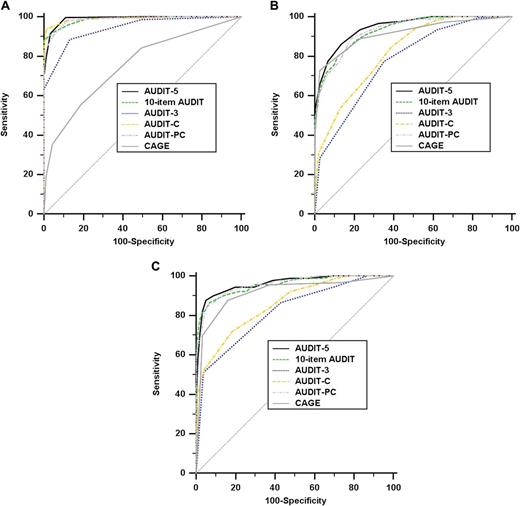
ROC curves of the 5-item AUDIT-5, 10-item AUDIT, other brief versions of AUDIT and CAGE for (A) problem drinking, (B) alcohol use disorders and (C) alcohol dependence screening.
PD screening
All brief versions of AUDIT and the 10-item AUDIT, but not CAGE, had a high PD screening accuracy, with AUCs ranging from 0.942 to 0.991. The PD screening accuracy of AUDIT-5 was equivalent to those of the 10-item AUDIT and AUDIT-C, but was significantly greater than those of AUDIT-3, AUDIT-PC and CAGE. The 10-item AUDIT showed a PD screening accuracy significantly superior to those of AUDIT-3 and CAGE.
AUD screening
The 10-item AUDIT, CAGE and both AUDIT-5 and AUDIT-PC among all brief versions of AUDIT had a high AUD screening accuracy, with AUCs ranging from 0.914 to 0.946. The AUD screening accuracy of AUDIT-5 was significantly greater than those of the full or any other brief version of AUDIT or CAGE. The 10-item AUDIT showed an AUD screening accuracy significantly superior to those of AUDIT-3 and AUDIT-C. The AUD screening accuracy of CAGE was significantly greater than those of AUDIT-3 and AUDIT-C.
AD screening
The 10-item AUDIT, CAGE and both AUDIT-5 and AUDIT-PC among all brief versions of AUDIT had a high AD screening accuracy, with AUCs ranging from 0.915 to 0.960. The AD screening accuracies of AUDIT-5, AUDIT-PC and 10-item AUDIT were equivalent, but all were significantly greater than those of AUDIT-3, AUDIT-C and CAGE. The AD screening accuracy of CAGE was significantly greater than those of AUDIT-3 and AUDIT-C.
DISCUSSION
We aimed to propose an optimal new brief AUDIT and determine its screening accuracy for PD, AUD and AD among male adults aged below 65 years in the Korean community. AUDIT-5, which is composed of 5-items extracted from the retained items that highly contributed to alcohol-related screening accuracy, exhibited a high PD screening accuracy comparable with those of the full version of AUDIT and AUDIT-C. As expected, AUDIT-5 showed the highest AUD screening accuracy among all these tests, including even the full version of AUDIT. Furthermore, AUDIT-5 had a high AD screening accuracy equivalent to those of the 10-item AUDIT and AUDIT-PC. CAGE showed a low screening accuracy for PD, but a high screening accuracy for AUD and AD. Contrary to CAGE, most brief versions of AUDIT exhibited a high screening accuracy for PD, but a low screening accuracy for AUD and AD. Therefore, AUDIT-5 was the most effective brief screening test fully covering PD, AUD and AD. On the other hand, CAGE and most brief versions of AUDIT were also partially effective in limited scenarios. To my knowledge, this is the first report that demonstrated the new brief version of AUDIT exhibited a significantly superior AUD screening accuracy than the 10-item AUDIT, and showed a PD and AD screening accuracy equivalent to those of the 10-item AUDIT.
Several studies supported our results (Bradley et al., 1998; Bush et al., 1998; Matano et al., 2003; Gomez et al., 2005). Gomez et al. (2005) found that AUDIT-3 performed satisfactorily in a primary care setting for detection of risky drinking. Moreover, Matano et al. (2003) suggested that AUDIT-3 was more accurate than the full version of AUDIT or CAGE for screening risky drinking among highly educated employees. Bush et al. (1998) suggested that AUDIT-C performed better than full AUDIT for screening of risky drinking, and showed high PD screening accuracy equivalent to that of the full AUDIT. In the study by Bradley et al. (1998), CAGE was inferior to the 10-item AUDIT for PD screening in general medical settings.
However, there remains controversy over the AUD and AD screening accuracy of these brief versions of AUDIT. In contrast to our results, Meneses-Gaya et al. (2010) reported that all brief versions of AUDIT showed a high AUC, demonstrating adequate discriminative ability for the screening of AUD and AD in two samples [mainly from an emergency department (85% among total subjects)] of Brazilian adults. Possible cultural differences, the characteristics of subjects enrolled in studies and the specificity of the emergency department service may account for such differences. Cultural drinking differences may be reflected by AUDIT items in alcohol-related screening. In our logistic regression analyses of Korean subjects, neither item 1 nor 3 was included in the retained items that highly contributed to the screening accuracy of PD, AUD and AD. With regard to alcohol-related screening, we found that AUDIT items 2, 4, 5, 9 and 10 greatly contributed to the accuracy of AUD and AD screening. Moreover, it is possible to explain the differences in screening accuracy in terms of the different proportions of AUD/non-AUD subjects in the two trials (185/160 in Gaya et al. versus 193/304 here). This is likely to be due to the specificity of their emergency department service being different from that of our community-based services. Bush et al. (1998) also reported results consistent with ours in their subject population, which contained a low proportion of AUD/non-AUD subjects.
This study has four limitations. First, although we conducted community-based multi-centre trials, our findings could not be generalized to the whole Korean population. Second, the subjects did not undergo the other brief versions of AUDIT, but received only the 10-item AUDIT and CAGE. This approach was chosen to avoid repeating the items included in the 10-item AUDIT. Third, we did not consider the confounding factors such as clinician–patient confidentiality, social stigma and patient's insight, which might have differential effects. For this reason, it is possible that some items are susceptible to these factors. Finally, although we undertook a split-half analysis to increase the reliability and generalizability, a definitive test of the value of AUDIT-5 will await independent testing in a population different from that from which it was derived. Owing to these limitations, our results might be interpreted with caution and related further research should be conducted in the future.
In spite of these limitations, the strengths of this study lead us to believe that our findings will be replicated in other settings and populations. First, our study population was rather large and had strict diagnoses of NC, risky drinking, alcohol abuse and AD. These were conducted through clinical evaluation using strict diagnostic criteria by a panel consisting of neuropsychiatrists with expertise in this area. This probably increases the reliability and generalizability of our data. Furthermore, we excluded major medical conditions and psychiatric disorders, including substance abuse disorders, through patient conference. Thus, our data were not likely to be confounded by the inclusion of such patients misclassified as belonging to our study subgroups.
In conclusion, our results strongly support the usefulness of AUDIT-5 for the screening of PD, AUD and AD in clinical settings.
Funding
This study was supported by a grant of the Korea Healthcare technology R&D Project, Ministry for Health, Welfare and Family Affairs, Republic of Korea (grant number A084589).
