


Abstract
During the 2009 influenza pandemic, uncertainty surrounding the severity of human infections with the influenza A(H1N1)pdm09 virus hindered the calibration of the early public health response. The case fatality risk was widely used to assess severity, but another underexplored and potentially more immediate measure is the hospitalization fatality risk (HFR), defined as the probability of death among H1N1pdm09 cases who required hospitalization for medical reasons. In this review, we searched for relevant studies published in MEDLINE (PubMed) and EMBASE between April 1, 2009, and January 9, 2014. Crude estimates of the HFR ranged from 0% to 52%, with higher estimates from tertiary-care referral hospitals in countries with a lower gross domestic product, but in wealthy countries the estimate was 1%–3% in all settings. Point estimates increased substantially with age and with lower gross domestic product. Early in the next pandemic, estimation of a standardized HFR may provide a picture of the severity of infection, particularly if it is presented in comparison with a similarly standardized HFR for seasonal influenza in the same setting.
The first influenza pandemic of the 21st century was recognized in April 2009, when the United States reported the first laboratory-confirmed cases of influenza A(H1N1)pdm09 (hereafter denoted H1N1pdm09) virus infection. The initial public health response was limited by the uncertainty surrounding the potential impact of the pandemic. The potential impact of a viral epidemic is determined by the transmissibility of the virus and the severity of infection, as well as the intensity and effectiveness of control measures (1).
The clinical pyramid of disease is a concept often used to reflect the varying levels of severity of influenza virus infections (2). Among persons infected with influenza virus, the majority will have mild, self-limited illness, and some will have infection with few or no symptoms (3). Some will seek medical attention, and a small proportion of infections will be fatal. Severity of infection can be quantified by assessing the risk of progressing to different levels of the pyramid among infected persons (e.g., the number of hospitalizations divided by the number of symptomatic illnesses, reflecting the risk of hospitalization among persons with symptomatic illness). We previously reviewed the case fatality risk (4), defined as the risk of death among cases, and found that the definition of a case varied considerably, leading to variation in the case fatality risk across multiple orders of magnitude. Because of its extreme heterogeneity, we concluded that the laboratory-confirmed case fatality risk was not ideal as an early estimate of severity of infection, and we recommended a preference for the use of the symptomatic case fatality risk or the infection fatality risk (4).
In this study, we examined a previously underexplored measure of severity, the hospitalization fatality risk (HFR), which uses hospitalized cases with laboratory-confirmed influenza as the denominator, to focus on a smaller and more homogeneous subset of persons with influenza virus infection. The objectives of our study were to review and summarize published data on the HFR of H1N1pdm09, to assess the HFR as a measure of severity compared with the case fatality risk, to compare HFR estimates for seasonal and pandemic viruses where possible, and to offer recommendations for estimating disease severity in future pandemics.
METHODS
This systematic review followed the PRISMA [Preferred Reporting Items for Systematic Reviews and Meta-Analyses] guidelines (5).
Search strategy and selection criteria
We extracted articles with estimates of the HFR of H1N1pdm09 on January 9, 2014, from 2 databases: MEDLINE (PubMed; US National Library of Medicine, Bethesda, Maryland) and EMBASE (Excerpta Medica Database; Elsevier B.V., Amsterdam, the Netherlands). The following free search terms were used to search in “All Fields”: The search was limited to studies published after April 1, 2009, subsequent to the start of the 2009 pandemic. We manually retrieved any additional relevant studies identified.
1. hospital OR hospitali* OR patient OR inpatient
2. fatalit* OR mortality OR death OR severity OR seriousness OR lethalit* OR virulence
3. #1 AND #2
4. influenza OR flu
5. pandemic
6. #4 AND #5
7. H1N1* OR pH1N1* OR pdmH1N1* OR nH1N1*
8. #6 OR #7
9. #3 AND #8
All titles identified via the search strategy were independently screened by 2 authors (J.Y.W. and B.J.C.). Abstracts of potentially relevant articles and the full texts of manuscripts were reviewed for eligibility. Articles in all languages were selected for assessment if at least 1 statistical estimate of the HFR was presented and described as an estimate for H1N1pdm09. We used Google Translate (Google Inc., Mountain View, California) for articles not written in English. Eligible studies were those that included ≥20 hospitalized cases and in which the authors reported 1 or more population-based estimates of the HFR or sufficient data to calculate an HFR. Studies that reported estimates of the HFR only in population subgroups, such as pregnant women or persons at higher risk of severe illness if infected (e.g., those with chronic health conditions), were excluded. Study quality was not formally assessed, although we did analyze the association of study design factors with heterogeneity in the HFR (see below).
Definition of the HFR
We defined the HFR as the probability of death associated with H1N1pdm09 cases that required hospitalization for medical reasons. The HFR for a cohort of individuals is estimated as the number of H1N1pdm09-associated deaths divided by the number of H1N1pdm09 hospitalizations in the same cohort. It is also possible to estimate the HFR in a population, as the number of H1N1pdm09 deaths divided by the number of H1N1pdm09 hospitalizations in the same population over the same time period.
We defined a cohort study as one which followed the same group of patients throughout the study period, either retrospectively or prospectively. The numbers of hospitalized cases and deaths were obtained from the cohort study, and the deaths were a subset of the hospitalized cases. We defined a discordant-source study as one where the number of hospitalized cases and the number of deaths were collected from surveillance reports or estimated (for instance, by modeling) independently of one another and the deaths might not necessarily have occurred within the group of hospitalized patients, although hospitalizations and deaths were estimated from the same source population over the same time period. The numerator of the HFR could be either counts or estimates of the number of deaths among laboratory-confirmed hospitalized cases, while the denominator could be either counts or estimates of the number of laboratory-confirmed H1N1pdm09 hospitalized cases. Hospitalized cases were those occurring in persons confirmed to have influenza virus infection by reverse-transcriptase polymerase chain reaction, rapid antigen test, or viral culture from an inpatient test. Patients admitted to a hospital after the cessation of viral shedding associated with H1N1pdm09 infection would probably not have been identified in the included studies.
Data extraction
All data were extracted independently and entered onto a standardized form by 2 of the authors (C.M.S. and E.Y.S.). Disagreements were resolved by a third author (J.Y.W.). The primary data extracted were the estimates of the HFR, the estimates or counts of the number of H1N1pdm09-associated hospitalized deaths (numerator), and the estimates or counts of the number of H1N1pdm09 hospitalized cases (denominator). Whenever available, we extracted HFRs stratified by age, hospital type, and hospitalized cases' characteristics, including the proportion of males and the proportion of cases with ≥1 underlying medical disorder. We also contacted individual authors for age breakdowns of hospitalized cases and deaths if this information was not reported in the published paper. If reported, the number of intensive care unit (ICU) admissions and the estimates of HFR for seasonal influenza from the same setting were also extracted. Although age groups differed across studies, children, adults, and the elderly were defined here as persons aged ≤19 years, 20–64 years, and ≥65 years, respectively.
Statistical analysis
Reported estimates of the HFR were combined using a random-effects model (6) (see the Supplementary Data, available at http://aje.oxfordjournals.org/), including a variance-stabilizing transformation before pooling (7, 8). To achieve variance stabilization, Freeman and Tukey (7) have suggested performing a double arcsine transformation before combining risk estimates (6, 8). Statistical heterogeneity was assessed by means of the I2 statistic, with higher values signifying a greater degree of variation (9). We examined HFR estimates according to study design (cohort studies vs. discordant-source studies), age group, year of virus circulation, a country's per capita gross domestic product (GDP) (10) (http://databank.worldbank.org/), and geographical location, broadly classified as North America, Europe, Central/South America, Asia, and Australia/New Zealand. Meta-regression analyses were conducted using a mixed-effects model (6) (Supplementary Data). We defined the first year of the pandemic as the period from 2009 to mid-2010. Relative risks of death comparing pandemic viruses with seasonal viruses were combined using a fixed-effects model (6) (Supplementary Data). All analyses were conducted with R, version 3.0.2 (R Foundation for Statistical Computing, Vienna, Austria) and the metafor package (11).
RESULTS
Of the 3,886 titles initially identified, 411 full-length articles were selected, of which 232 were subsequently excluded (Supplementary Data) and 179 were included (Table 1, Supplementary Data, Figure 1). Characteristics of the 179 included studies, with a total of 182 reported HFR estimates, are summarized in Supplementary Data. Only 7.3% (13/179) of the studies were published within the first 9 months of the pandemic (Supplementary Data). There was substantial variability in published estimates of the HFR throughout the review period, which covered almost 5 years (Supplementary Data).
Study Characteristics for 182 Estimates (179 Articles) of the Hospitalization Fatality Risk of Influenza A(H1N1)pdm09, 2009–2013
| Study Characteristic | No. of Studies | |
|---|---|---|
| Cohort Studies | Discordant-Source Studiesa | |
| Total no. of studies | 131 | 48 |
| Total no. of estimates | 132 | 50 |
| Total no. of participants | 63,849 | 86,255 |
| No. of English-language articles | 115 | 47 |
| Geographical region | ||
| North America | 21 | 17 |
| Europe | 44 | 13 |
| Central/South America | 8 | 5 |
| Asia | 52 | 8 |
| Australia/New Zealand | 3 | 7 |
| Otherb | 4 | 0 |
| Type of test used to confirm influenza infection | ||
| PCR only | 115 | 28 |
| Combined testsc | 6 | 9 |
| Respiratory viral panel only | 1 | 0 |
| Unknown | 10 | 13 |
| % of cases with ≥1 underlying medical disorder | ||
| 0–24 | 15 | 1 |
| 25–49 | 36 | 8 |
| 50–74 | 40 | 14 |
| 75–100 | 16 | 8 |
| Unknown | 25 | 19 |
Abbreviations: PCR, polymerase chain reaction; RAT, rapid antigen test.
a Studies in which the number of hospitalized cases and the number of deaths were collected from surveillance reports or estimated (e.g., by modeling) independently of one another.
b Egypt, Kenya, Morocco, and 4 grouped countries (Australia, Denmark, the United Kingdom, and the United States).
c PCR and/or viral culture; PCR or viral culture; PCR or viral culture or RAT; PCR and/or RAT; PCR or RAT; PCR or RAT or direct/indirect fluorescent antibody assay; PCR or RAT or viral culture or direct/indirect fluorescent antibody assay; PCR or RAT or viral culture or direct/indirect fluorescent antibody assay or documentation of a positive H1N1pdm test; PCR or viral culture or a 4-fold rise in antibodies against H1N1pdm09 virus; and PCR and/or positive epidemiologic evidence of severe acute respiratory syndrome.
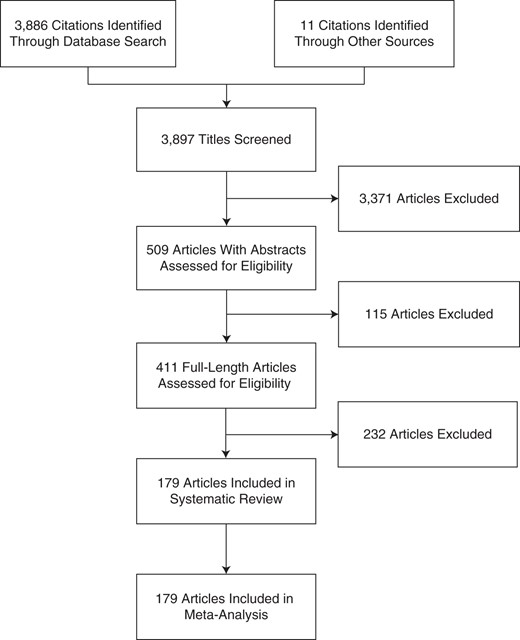
Selection of 179 articles for a study of the hospitalization fatality risk of influenza A(H1N1)pdm09, 2009–2013.
In total, our analysis was based on reports from 48 countries or regions, specifically Argentina, Australia, Austria, Belgium, Brazil, Canada, Chile, China, Colombia, Croatia, Denmark, Egypt, France, Germany, Greece, Hong Kong, India, Iran, Ireland, Israel, Italy, Japan, Kenya, Kuwait, Lithuania, Macau, Malaysia, Mexico, Morocco, the Netherlands, New Zealand, Norway, Oman, Pakistan, Poland, Romania, Saudi Arabia, Serbia, Singapore, South Korea, Spain, Sweden, Switzerland, Taiwan, Thailand, Turkey, the United Kingdom, and the United States (Supplementary Data). In addition, 1 publication estimated the HFR for 9 European countries (12), and 2 other publications reported on 2 and 4 specified countries (13, 14). The numbers of hospitalized cases ranged from 21 to 12,923 (Supplementary Data). Illustrating potential sources of heterogeneity, 40.2% (72/179) of the HFR studies were conducted in tertiary-care referral hospitals, males comprised between 30% and 75% of cases, and 2%–96% of the cases had at least 1 underlying comorbid condition (Table 1, Supplementary Data).
Point estimates of the HFR based on cohorts ranged from 0% to 52%, with very substantial heterogeneity (I2 = 95.63%) (Supplementary Data). The HFR of H1N1pdm09 for wealthy countries ranged from 1% to 3% (I2 = 0%–88%) (Table 2). In age-stratified analyses, we observed a steady increase in HFR estimates with age, from ≤6% (91% of the estimates) in children to 6%–30% (78% of the estimates) in the elderly, although there was substantial variation in the estimates within each age group (Supplementary Data). In addition, the pooled HFR for North America increased with age (Table 2). It was not possible to perform this age-stratified analysis for any other region. There was also substantial heterogeneity between the 50 HFR estimates based on discordant-source study designs, with point estimates ranging from 0% to 27% (I2 =98.53%) (Supplementary Data). The pattern of age-specific HFR estimates based on discordant-source studies was similar to that of estimates based on cohort studies (Supplementary Data). The highest overall HFR estimate (52%) was found in a study conducted at a referral hospital in India (15). When estimates were stratified by age, the highest HFRs for children, adults, and the elderly were 16%, 68%, and 33% respectively, all in India (15–17).
Pooled Estimates of the Hospitalization Fatality Risk for Influenza A(H1N1)pdm09 in Cohort Studies, by Geographical Region, 2009–2013
| Region | I2, % | Pooled HFR Estimate, % | 95% CI |
|---|---|---|---|
| Australia/New Zealand | 0.02 | 3.2 | 1.8, 4.9 |
| Asiaa | 80.05 | 1.4 | 0.5, 2.7 |
| North Americab | 88.35 | 2.6 | 1.6, 3.9 |
| Region | I2, % | Pooled HFR Estimate, % | 95% CI |
|---|---|---|---|
| Australia/New Zealand | 0.02 | 3.2 | 1.8, 4.9 |
| Asiaa | 80.05 | 1.4 | 0.5, 2.7 |
| North Americab | 88.35 | 2.6 | 1.6, 3.9 |
Abbreviations: CI, confidence interval; HFR, hospitalization fatality risk.
a Hong Kong, Taiwan, Singapore, Japan, and South Korea.
b When stratified by age, pooled estimates of the HFR were 0.8% (95% CI: 0.5, 1.1; I2 = 14.21%), 5.4% (95% CI: 3.5, 7.5; I2 = 0%), and 10.7% (95% CI: 5.3, 17.6; I2 = 19.67%) for children (ages ≤19 years), adults (ages 20–64 years), and the elderly (ages ≥65 years), respectively.
Meta-regression was carried out to examine the effect of variables that could influence the HFR estimate (Table 3). Among children and adults, HFRs from referral hospitals were statistically nonsignificantly higher than HFRs from community hospitals. On the other hand, there was a statistically significant negative association between GDP and risk of death among hospitalized cases for all age groups, but this association was significant only in children and adults. No associations were found for the elderly. However, residual heterogeneity remained even after these variables were taken into account. Ten studies reported estimates of the HFR for seasonal influenza in children (Supplementary Data). The pooled risk ratio for H1N1pdm09 as compared with seasonal influenza was 0.92 (95% confidence interval: 0.72, 1.18). A fixed-effects model was used for the comparison between seasonal and pandemic influenza, because an I2 value of 0 was found when the data were fitted to a random-effects model. We did not find sufficient estimates of the HFR for seasonal influenza in adults or the elderly for comparison with the corresponding HFRs for H1N1pdm09.
Results From a Meta-Regression Analysis of Variables That Could Have Influenced the Influenza A(H1N1)pdm09 Hospitalization Fatality Risk During the First Year of the 2009 Pandemic (Cohort Studies Only), 2009–2013
| Change in Hospitalization Fatality Risk | ||||||
|---|---|---|---|---|---|---|
| Children (Ages ≤19 Years) (n = 62)a | Adults (Ages 20–64 Years) (n = 28)b | Elderly (Ages ≥65 Years) (n = 10)c | ||||
| β | 95% CI | β | 95% CI | β | 95% CI | |
| Hospital type | ||||||
| Community | 0 | Referent | 0 | Referent | 0 | Referent |
| Referral | 0.0048 | −0.0078, 0.0175 | 0.0113 | −0.0342, 0.0567 | −0.2376d | −0.4180, 0.0571 |
| Multicenter | 0.0071 | −0.0056, 0.0198 | 0.0243 | −0.0273, 0.0759 | −0.2132d | −0.3906, 0.0358 |
| GDP per capita (US$) | ||||||
| <5,000 | 0.0756d | 0.0277, 0.1235 | 0.3316d | 0.2350, 0.4282 | 0.0658 | −0.2489, 0.3804 |
| 5,000–34,999 | 0.0046 | −0.0059, 0.0150 | −0.0120 | −0.0513, 0.0273 | −0.0611 | −0.1627, 0.0404 |
| ≥35,000 | 0 | Referent | 0 | Referent | 0 | Referent |
| Geographical region | ||||||
| North America | 0 | Referent | 0 | Referent | 0 | Referent |
| Europe | 0.0077 | −0.0055, 0.0209 | 0.0108 | −0.0550, 0.0766 | 0.0183 | −0.0808, 0.1174 |
| Central/South America | 0.0408d | 0.0157, 0.0660 | NA | NA | ||
| Asia | 0.0012 | −0.0107, 0.0131 | −0.0008 | −0.0789, 0.0774 | 0.1847 | −0.0251, 0.3946 |
| Australia/New Zealand | NA | −0.0350 | −0.1255, 0.0554 | NA | ||
| Othere | −0.0716d | −0.1325, −0.0108 | NA | NA | ||
Abbreviations: CI, confidence interval; GDP, gross domestic product; NA, not available.
a Original τ2 = 0.0002; meta-regression τ2 = 0.0001; 33% of original heterogeneity explained.
b Original τ2 = 0.0074; meta-regression τ2 = 0.0012; 84% of original heterogeneity explained.
c Original τ2 = 0.0050; meta-regression τ2 = 0.0004; 84% of original heterogeneity explained.
d Significant at P < 0.05.
e Egypt, Kenya, Morocco, and 4 specified countries (Australia, Denmark, the United Kingdom, and the United States).
We extracted risk estimates for other pyramid categories in the disease progression pathway of H1N1pdm09 from the studies included in this review, and these estimates were also subject to considerable variation (Supplementary Data, Supplementary Data). Estimates ranged from 0% to 50% (97% of the estimates) for the hospitalization ICU risk. The highest overall estimates were reported in 4 studies from Germany, India, and Iran, with estimates of 53%–96% (16, 18–20).
DISCUSSION
In this review and meta-analysis, crude estimates of the risk of death among hospitalized cases with laboratory-confirmed H1N1pdm09 ranged from 0% to 52%, with substantial heterogeneity. Six variables influenced HFR heterogeneity: age, epidemic wave, type of hospital, level of economic development (GDP), study design, and geographical location, but stratification for these variables did not explain all of the observed heterogeneity (Table 3). For instance, the HFR in wealthy countries was 1%–3%, with substantial heterogeneity in pooled estimates from cohort studies in North America but less heterogeneity in studies from Asia and Australia/New Zealand. Residual heterogeneity according to countries' GDP and geographical location precluded the estimation of pooled HFR estimates for Europe and Central/South America.
Nonetheless, we were able to make a number of observations related to HFR. Compared with children, adults and the elderly tended to have a higher risk of death if hospitalized with H1N1pdm09. Adults and the elderly have a higher prevalence of underlying health conditions (e.g., immunosuppression, lung disorders, and diabetes), which are associated with an increased risk of severe illness (21–23), while the threshold for admitting children to a hospital may have been lower in terms of disease severity, especially during the early phase of the pandemic. In addition, compared with children and adults, the elderly were found to have a lower cumulative incidence of infection (24). Possible reasons include immunity from past infections and lower risk of infection due to fewer contacts with other people in the community, particularly children (24–26). Although the risk (cumulative incidence during a defined period) of infection was lower in the elderly, the conditional risk of death given hospitalization was higher. Nonetheless, the absolute mortality burden was lower in the elderly because of the lower primary risk of infection.
Countries with lower GDPs would likely have had higher thresholds for hospital admission and ICU treatment, so more severe cases will have been captured in studies from these countries. Because the hospitalized cases may have been more severe than those in countries with higher GDPs, the risk of death, and consequently the HFR, may also have been higher (27–29).
Furthermore, our analysis showed a higher HFR for Central and South America than for other geographical regions (Table 3). As the virus spread rapidly into rural and remote areas of the region, health systems which had already reached full capacity struggled with the increased burden of disease, especially in areas where tertiary care was already scarce (30). Antiviral treatment was also found to be delayed in the region due to the rapid spread of the virus and the lack of familiarity with oseltamivir among physicians (31). Moreover, the use of oseltamivir varied in different countries (32–35). For instance, in Italy, 75% of patients received oseltamivir within 48 hours of symptom onset (34), whereas only around 52% of patients in Hong Kong were treated within 48 hours of symptom onset (35). Since oseltamivir may be associated with a decreased risk of death (36), oseltamivir use may also have added to heterogeneity in the HFR estimates.
Regarding the differences between study designs, the HFR estimated from discordant-source studies may have been subject to case ascertainment bias (2, 3, 37). In discordant-source studies, death data and hospitalization data were collected from different surveillance systems. Hospitalized cases may have been underascertained, leading to overestimation of the HFR. In the cohort studies, all deaths were a subset of hospitalized patients and therefore should have been captured.
HFRs estimated from tertiary-care referral hospitals might not be generalizable to community hospitals, and an HFR from only 1 type of hospital should not be considered a reliable population estimate (38). Finally, HFR estimates for both cohort and discordant-source study designs could have been subject to censoring bias in the early phases of the pandemic before deaths of hospitalized cases occurred, which would have resulted in underestimation (38, 39).
A few studies compared the risk of death among patients with H1N1pdm09 with that among patients with other influenza virus infections. We were able to extract sufficient data for comparison of HFRs in children and found that the pooled risk ratio, comparing seasonal influenza with pandemic influenza, suggested similar levels of severity among children. Limiting their direct comparability, there was no standardized approach to estimation of the HFR in these studies, but relative severity estimates may be easier to compare than absolute estimates, since relative estimates control to some extent for study design, GDP, location, year of virus circulation, and hospital type. However, relative estimates may be biased if the criteria for hospital admission change during a pandemic or if estimates from a nonpandemic year are compared with estimates from a pandemic year when there was no seasonal virus circulation. In addition, we must be cautious when interpreting the relative HFR because severity of influenza virus infection varies by type and subtype and from year to year.
Although our study focused on HFR estimates, we also identified 1 other risk estimate that could be of clinical and public health utility, namely the risk of ICU admission among hospitalized cases, which varied between 0% and 50% (Supplementary Data). Similar to the HFR, it would be useful to have a comparative estimate of this risk for pandemic influenza versus seasonal influenza. For children in Canada, the risk of ICU admission among hospitalized cases with H1N1pdm09 (20%) did not differ from that of seasonal influenza (16%; P = 0.30) (40). A similar result was reported in a study from the United Kingdom (41). However, Morgan et al. (42) reported that children in Ohio with H1N1pmd09 were significantly less likely to be admitted to the ICU than children with seasonal influenza (14% vs. 24%; P = 0.002). These findings suggest that ICU admission thresholds may differ between pandemic and interpandemic periods or between jurisdictions.
In addition to residual heterogeneity, this study had other limitations. Firstly, there could have been substantial variation between included studies due to differences in population health, health-care resources, and intensity of surveillance (43). Secondly, our study included both cohort and discordant-source primary studies. The HFR estimates from both study designs may have been subject to censoring bias; however, the HFR estimates from the discordant-source studies may additionally have been subject to ascertainment bias (as discussed above). Thirdly, we assumed that the numerator of the HFR was deaths attributed to influenza, but hospitalized patients with influenza may die for other reasons not related to the influenza virus infection. For instance, patients may die of other complications (e.g., pneumonia) and not be classified as having died from influenza. In addition, because of hospital discharge policies (e.g., those based on bed capacity), some deaths associated with influenza infection may have been underascertained if patients who later died were transferred or discharged before full recovery from their influenza virus infection. However, we suspect that the number of missed deaths would have been low, given that most deaths occurred in patients less than 65 years of age. Fourthly, a few countries (e.g., the United Kingdom and Mexico) reported 2 or more waves within the first year of the pandemic (3, 44). Because the definitions of epidemic waves varied between countries, we combined the waves reported from 2009 to mid-2010 for consistency. Fifthly, uncontrolled sources of heterogeneity in these studies included the source of data, with clinical studies possibly including more severe cases than surveillance studies; differing hospital admission thresholds and changes in these thresholds during the course of the pandemic; and the availability of various testing methods (polymerase chain reaction, rapid antigen tests, and viral culture) and whether testing was targeted or universal. Where studies were more likely to be similar in these respects, heterogeneity (as assessed by the I2 statistic) was lower. Lastly, we were not able to estimate the pooled risk ratio in adults and the elderly because there were insufficient estimates of the HFR for seasonal influenza. This may hinder the use of relative HFR in future influenza pandemics. More studies of HFR for seasonal influenza would be welcome.
Our results indicate substantial variation in HFR estimates but less variation than that for the case fatality risk (4). If interpreted in the context of population wealth, geographical setting, hospital type, and study design, the HFR could provide an early measure of the severity of infection with a future pandemic virus, but standardization of the definition and data collection for the HFR would still be required. However, since the HFR measures the fatality risk among only the more severe cases (i.e., those who are hospitalized), it does not reflect the clinical profile of the vast majority of symptomatic cases. Because the HFR focuses on the tip of the clinical pyramid, it may fail to capture differences in severity lower down on the pyramid that would lead to substantial differences in impact. For example, a new pandemic influenza virus that had a similar HFR to a seasonal virus but a much greater risk of symptomatic illness requiring medical attention would have a much larger impact on the medical system.
In the recent epidemic of human infection with avian influenza A(H7N9) virus in China, we used the HFR and the symptomatic case fatality risk to characterize the severity of H7N9 as compared with other influenza virus infections (39). In this instance, we were able to show the relative severity of H7N9 infection compared with seasonal or H1N1pdm09 infection because we could compare data from a single region. To gauge the relative severity of different types of influenza viruses, one needs data that are comparable by region, resources, and study design. In countries with sufficient resources, investigators should measure a range of risks in order to have a baseline for comparison, and the HFR represents a previously underexplored measure.
ACKNOWLEDGMENTS
Author affiliations: WHO Collaborating Centre for Infectious Disease Epidemiology and Control, School of Public Health, Li Ka Shing Faculty of Medicine, University of Hong Kong, Hong Kong, China (Jessica Y. Wong, Eunice Y. Shiu, Peng Wu, Dennis K. M. Ip, Benjamin J. Cowling); Victorian Infectious Diseases Reference Laboratory, North Melbourne, Victoria, Australia (Heath Kelly); National Centre for Epidemiology and Population Health, Australian National University, Canberra, Australian Capital Territory, Australia (Heath Kelly); Medical School, University College London, London, United Kingdom (Chung-Mei M. Cheung); and Division of Community Medicine and Public Health Practice, School of Public Health, Li Ka Shing Faculty of Medicine, University of Hong Kong, Hong Kong, China (Michael Y. Ni).
This study was funded by the Health and Medical Research Fund of the Hong Kong Health, Welfare and Food Bureau (grant HK-13-04-03), the Harvard Center for Communicable Disease Dynamics (grant U54 GM088558 from the National Institute of General Medical Sciences, US National Institutes of Health), and the Area of Excellence Scheme of the Hong Kong University Grants Committee (grant AoE/M-12/06).
We thank Hoi Wa Wong and Angel Li for technical support.
The funding bodies played no role in the study design, data collection, and analysis, the preparation of the manuscript, or the decision to publish the article.
H.K. has spoken at a clinical training session sponsored by Sanofi Pasteur (Lyon, France). D.K.M.I. has received research funding from F. Hoffmann-La Roche Ltd. (Basel, Switzerland). B.J.C. has received research funding from MedImmune, Inc. (Gaithersburg, Maryland) and Sanofi Pasteur and consults for Crucell NV (Leiden, the Netherlands).
REFERENCES
Author notes
Abbreviations: GDP, gross domestic product; HFR, hospitalization fatality risk; ICU, intensive care unit.

