


Emerging epidemiological studies have indicated that a higher count of eosinophils, as specialized multifunctional leukocytes, in the blood is associated with a higher risk of complex diseases in the human population (Amini et al., Reference Amini, Bashirova, Prins, Corpeleijn, Bruinenberg and Alizadeh2016; Babio et al., Reference Babio, Ibarrola-Jurado, Bullo, Martinez-Gonzalez, Warnberg and Salaverria2013; Bafadhel et al., Reference Bafadhel, McKenna, Terry, Mistry, Pancholi, Venge and Brightling2012; Kim, Noh et al., Reference Kim, Noh, Lee, Choi, Chung, Min and Kim2008; Kim, Choi et al., Reference Kim, Choi, Hong, Kim, Jung and Kim2006; Meng et al., Reference Meng, Zhang, Zhang, Song, Lin, Zhang and Xue2012; Shim et al., Reference Shim, Kim, Kang, Ahn, Lim, Lee and Cha2006; Siva et al., Reference Siva, Green, Brightling, Shelley, Hargadon, McKenna and Pavord2007; Wu et al., Reference Wu, Molofsky, Liang, Ricardo-Gonzalez, Jouihan, Bando and Locksley2011). In the population-based LifeLines study in the north of the Netherlands, we have recently shown that an increased blood eosinophil count correlates with a higher risk of metabolic and pulmonary diseases (Amini et al., Reference Amini, Bashirova, Prins, Corpeleijn, Bruinenberg and Alizadeh2016). The association of eosinophil count with common complex outcomes may be due to the presence of confounding factors or reverse causation, or also may be consistent with a causal role of eosinophil in these traits and diseases (Astle et al., Reference Astle, Elding, Jiang, Allen, Ruklisa, Mann and Soranzo2016; Davey Smith & Ebrahim, Reference Davey Smith and Ebrahim2005; Davey Smith & Hemani, Reference Davey Smith and Hemani2014). If a causal association exists, then common genetic variants associated with eosinophil count may influence these complex outcomes. A previous genome-wide association study (GWAS) has identified five genetic variants associated with eosinophil count in European and Asian populations (Gudbjartsson et al., Reference Gudbjartsson, Bjornsdottir, Halapi, Helgadottir, Sulem, Jonsdottir and Stefansson2009). Interestingly, among the five genetic variants, the rs3184504*T variant (mapped to SH2B3 gene) allele has been shown to be associated with a higher risk of myocardial infarction (MI), and the rs1420101*A variant (mapped to IL1RL1 gene) with a higher risk of asthma (Gudbjartsson et al., Reference Gudbjartsson, Bjornsdottir, Halapi, Helgadottir, Sulem, Jonsdottir and Stefansson2009). Other studies also indicated the associations of some eosinophil genetic variants with complex outcomes (Aghabozorg Afjeh et al., Reference Aghabozorg Afjeh, Ghaderian, Mirfakhraie, Piryaei and Zaim Kohan2014; Lian et al., Reference Lian, Huang, Huang, Xu, Le, Yang and Duan2013; Savenije et al., Reference Savenije, Kerkhof, Reijmerink, Brunekreef, de Jongste, Smit and Koppelman2011; Talmud et al., Reference Talmud, Drenos, Shah, Shah, Palmen and Verzilli2009) and the causal role of eosinophil in autoimmune diseases (Astle et al., Reference Astle, Elding, Jiang, Allen, Ruklisa, Mann and Soranzo2016). However, the causality of associations between eosinophil count and other common complex diseases and their related intermediate traits remained unclear. An intermediate trait is a measurable component that lies along the pathway of diseases, which is not a risk factor rather it manifests the underlying disease.
Implementation of Mendelian randomization (MR) methodology (Davey Smith & Hemani, Reference Davey Smith and Hemani2014; Didelez & Sheehan, Reference Didelez and Sheehan2007) may clarify the potential causal association between eosinophil count and risk of complex outcomes by transition from healthy intermediate traits to related diseases. Using the genetic risk score of five constituting eosinophil genetic variants (eosinophil genetic risk score (eos-GRS)), the explanatory effects of genetically determined eosinophil on the risk of complex diseases can be investigated. Recently, we successfully applied the MR methodology to characterize the causal association between C-reactive protein (CRP) and complex outcomes (Prins et al., Reference Prins, Abbasi, Wong, Vaez, Nolte, Franceschini and Alizadeh2016), as well as between bilirubin and type 2 diabetes (T2D) (Abbasi et al., Reference Abbasi, Deetman, Corpeleijn, Gansevoort, Gans, Hillege and Bakker2015). In this study, using a similar methodology, we performed MR, using two approaches to assess how a genetically determined eosinophil count contributes causally to the risk of 20 complex intermediate traits and diseases in three classes of metabolic, cardiac, and pulmonary outcomes. In the first approach, we performed MR analysis using individual-level data. In the second approach, in order to replicate the findings of the first approach in an expanded sample size, we applied MR analysis to the summary statistics acquired from six large-scale GWAS consortia of eosinophil and 14 out of 20 complex traits and diseases (Figure 1).
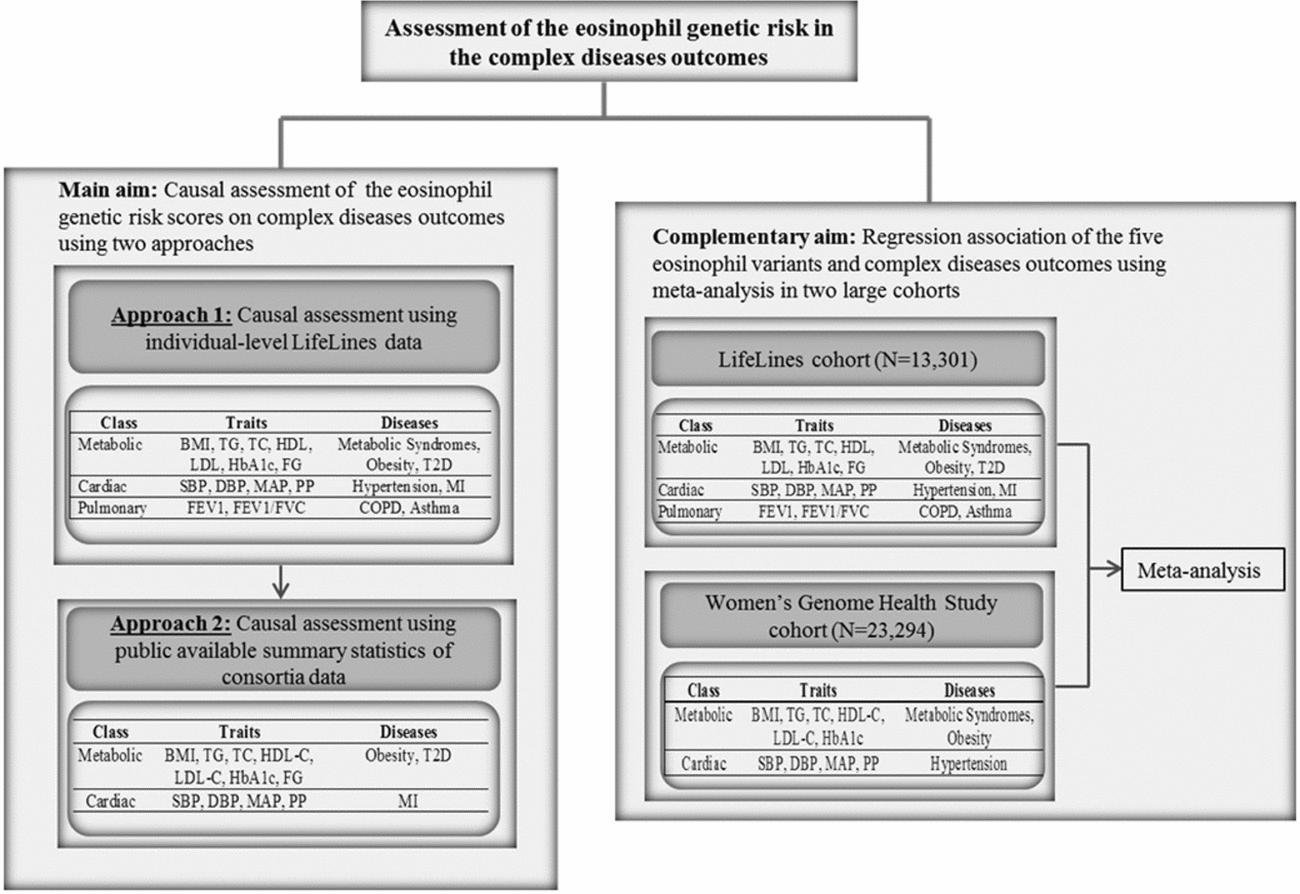
FIGURE 1 Flow chart of the study design. BMI = body mass index, TG = triglycerides, TC = total cholesterol, HDL = high density lipoprotein, LDL = low density lipoprotein, HbA1c = hemoglobin A1c, FG = fasting glucose, SBP = systolic blood pressure, DBP = diastolic blood pressure, MAP = mean arterial pressure, PP = pulse pressure, HTN = hypertension, MI = myocardial infarction, FEV1 = Forced expiratory volume in one second, FVC = forced vital capacity, COPD = chronic obstructive pulmonary diseases.
Material and Methods
Study Design
To estimate the causal association of eosinophil count on outcomes of interest, we performed MR analysis using weighted eos-GRSs. First, we applied MR analysis procedures to the individual-level LifeLines cohort data, adjusted for age and gender, to assess causal inference on 20 complex intermediate traits and diseases. Second, we tested the causal association between eos-GRS and 14 outcomes of interest from 6 consortia data (Figure 1).
Outcomes
We focused on three classes of outcomes, including metabolic, cardiac, and pulmonary outcomes. The first class of metabolic outcomes comprised body mass index (BMI, kg/m2), triglycerides (TG, mmol/L), total cholesterol (TC, mmol/L), high-density lipoprotein cholesterol (HDL-C, mmol/L), low-density lipoprotein cholesterol (LDL-C, mmol/L), hemoglobin A1c (HbA1c, %), fasting glucose (FG, mmol/L), obesity, metabolic syndrome (MetS), and T2D. The second class of cardiac outcomes included systolic blood pressure (SBP, mmHg), diastolic blood pressure (DBP, mmHg), mean arterial pressure (MAP, mmHg), pulse pressure (PP, mmHg), hypertension (HTN), and MI. The third class of pulmonary outcomes included forced expiratory volume in one second (FEV1, L), ratio of FEV1 and forced vital capacity (FEV1/FVC), chronic obstructive pulmonary disease (COPD), and asthma.
Genetic Variants and GRS
Five genetic variants affecting eosinophil count were selected, based on a GWAS discovery of over 21,000 European individuals (Supplementary Table S1; Gudbjartsson et al., Reference Gudbjartsson, Bjornsdottir, Halapi, Helgadottir, Sulem, Jonsdottir and Stefansson2009). The weighted GRS was estimated for each individual in LifeLines by summing the product of multiplying the number of risk alleles at each locus (range 0–2) with the corresponding effect sizes obtained from the largest meta GWAS analysis on eosinophil count, as given in Table S1 (Gudbjartsson et al., Reference Gudbjartsson, Bjornsdottir, Halapi, Helgadottir, Sulem, Jonsdottir and Stefansson2009).
Data Analyses
In order to assess the causal association of eosinophil on complex traits and diseases, we performed MR analyses using eos-GRSs as instrumental variables (Abbasi et al., Reference Abbasi, Deetman, Corpeleijn, Gansevoort, Gans, Hillege and Bakker2015; Prins et al., Reference Prins, Abbasi, Wong, Vaez, Nolte, Franceschini and Alizadeh2016) in two approaches.
MR approach using individual-level data
Details on the measurement of quantitative traits and the definitions of diseases in the LifeLines cohort are presented elsewhere (Amini et al., Reference Amini, Bashirova, Prins, Corpeleijn, Bruinenberg and Alizadeh2016). We assessed the causal association of eos-GRSLLs using standard MR procedures in individual-level data of eosinophil count and 20 outcomes data available in the LifeLines cohort study, while adjusted for age and gender (Abbasi et al., Reference Abbasi, Deetman, Corpeleijn, Gansevoort, Gans, Hillege and Bakker2015). We used the two-stage, least-squares (2SLS; Abbasi et al., Reference Abbasi, Deetman, Corpeleijn, Gansevoort, Gans, Hillege and Bakker2015) method (using SPSS statistical software version 22; SPSS, Inc., Chicago, USA) to generate the causal estimate of an elevated eosinophil count on change of intermediate trait levels and risk of diseases. The first stage of the 2SLS method is to examine the observational association between eos-GRSLLs and eosinophil count by means of linear regression and saving the predicted values. In the second stage, the predicted values of eosinophil count from the first stage are used as covariates, with traits or diseases as dependent variable in a linear or logistic regression model (Abbasi et al., Reference Abbasi, Deetman, Corpeleijn, Gansevoort, Gans, Hillege and Bakker2015). The causal estimate is this second-stage regression coefficient for the change in the complex outcomes caused by a 1-SD change in the eosinophil count (Burgess et al., Reference Burgess, Small and Thompson2017). In addition, we estimated an F statistic for each outcome to ensure the strength of eos-GRSs as instrumental variables using the formula: F statistic = [R 2 × (n−1−K)]/[(1−R 2) × K], where ‘R 2’ represents the proportion of variance from the first-stage, ‘n’ represents the sample size, and ‘K’ represents the number of instrumental variables included in the model (i.e., for this study, K = 1; Rice, Reference Rice1995). An F statistic greater than 10 indicates sufficient strength to ensure the validity of the instrument variable analysis, whereas R 2 in percent is used as a measure of the percent contribution of genotypes to the variation in eosinophil count (Burgess et al., Reference Burgess, Butterworth and Thompson2013). To test for pleiotropy, we performed linear and logistic regression with eosinophil count as an independent variable and outcomes as a dependent variable, and then saved the residuals. Next, we tested the correlation between the genotype and the residuals (Li et al., Reference Li, van der Sijde, Bakker, Dullaart, van der Harst and Fu2014).
MR approach using summary statistics data
We estimated the causal association of eos-GRSGWAS on outcome of interest using summary statistics for each eosinophil genetic variant obtained from publicly available large consortia data of studied outcomes (Berndt et al., Reference Berndt, Gustafsson, Magi, Ganna, Wheeler, Feitosa and Ingelsson2013; Coronary Artery Disease Genetics Consortium et al., Reference Peden, Hopewell, Saleheen, Chambers, Hager and Collins2011; Dupuis et al., Reference Dupuis, Langenberg, Prokopenko, Saxena, Soranzo, Jackson and Morris2010; Global Lipids Genetics Consortium et al., Reference Willer, Schmidt, Sengupta, Peloso, Gustafsson and Abecasis2013; Morris et al., Reference Morris, Voight, Teslovich, Ferreira, Segre and Steinthorsdottir2012; Soranzo et al., Reference Soranzo, Spector, Mangino, Kuhnel, Rendon, Teumer and Gieger2009; Wain et al., Reference Wain, Verwoert, O'Reilly, Shi, Johnson, Johnson and van Duijn2011; Yang et al., Reference Yang, Loos, Powell, Medland, Speliotes, Chasman and Visscher2012). Analyses were performed using the grs.summary module as part of the Genetics ToolboX R (version 2.15.1 for Windows; Vienna, Austria). The grs.summary module approximates the regression of an additive GRS onto a response variable or outcome. The method of analysis is described in detail elsewhere (Dastani et al., Reference Dastani, Hivert, Timpson, Perry, Yuan, Scott and Kathiresan2012; Prins et al., Reference Prins, Abbasi, Wong, Vaez, Nolte, Franceschini and Alizadeh2016). Since in causal inference the heterogeneity of the genetic variants’ effect potentially indicates pleiotropic effects that violate the MR assumption (Abbasi et al., Reference Abbasi, Deetman, Corpeleijn, Gansevoort, Gans, Hillege and Bakker2015; Burgess et al., Reference Burgess, Butterworth and Thompson2013; Prins et al., Reference Prins, Abbasi, Wong, Vaez, Nolte, Franceschini and Alizadeh2016), we checked the goodness-of-fit test in the gtx package for the presence of heterogeneity. A p < .05 was considered statistically significant for the heterogeneity. When significant heterogeneity was detected, genetic variants that contributed most to the statistical heterogeneity were iteratively removed until the heterogeneity test was no longer significant, and genetic risk score analyses were repeated for the remaining subset of genetic variants (Dastani et al., Reference Dastani, Hivert, Timpson, Perry, Yuan, Scott and Kathiresan2012). Since the ln-transformed eosinophil count was used as the response variable in the reference study (Gudbjartsson et al., Reference Gudbjartsson, Bjornsdottir, Halapi, Helgadottir, Sulem, Jonsdottir and Stefansson2009), to obtain the effect sizes for each of the eosinophil genetic variants, a unit increase in ln-eosinophil equals a 10 symmetric percentage (s%) increase in actual eosinophil count. This corresponds to a unit change in levels of a continuous outcome or logit of risk-estimate for a dichotomous outcome (Cole, Reference Cole2000). Therefore, the causal estimate of instrumental variable was presented for each outcome as corresponding to a 10-s% increase in actual eosinophil count (Rice, Reference Rice1995).
A p < .05 was taken as nominally significant, and to address multiple testing, Bonferroni corrected p values were considered as statistically significant with p < 2.5×10⁻³ (0.05/20 total analyses) for individual-level data analyses and p < 3.6×10⁻³ (0.05/14 total analyses) for summary statistics analyses.
Results
Details of the study population characteristics are presented in Supplementary Results.
Individual Variants Results
Using the individual-level LifeLines data (n = 13,301), we replicated significant associations of 0.09 SD units increase of eosinophil count with an increase of one copy of SH2B3-rs3184504*T (p = 3.9×10⁻¹³), 0.04 SD units with IL5-rs4143832*G (p = 1.3×10⁻³), 0.03 SD units with IKZF2-rs12619285*G (p = 1.5×10⁻³), 0.09 SD units with GATA2-rs4857855*C (p = 1.4×10⁻⁸), and 0.06 SD units with IL1RL1-rs1420101*A (p = 1.0×10⁻⁴) variants (Figure S1). We also found that SH2B3-rs3184504*T explained 0.30% variance of eosinophil count and this was 0.05% for IL5-rs4143832*G, 0.001% for IKZF2-rs12619285*G, 0.20% for GATA2-rs4857855*C, 0.06% for IL1RL1-rs1420101*A. eos-GRSLLs explained 0.60% of eosinophil count variance.
In the sensitivity analysis, we assessed the association of the five eosinophil genetic variants with metabolic, cardiac, and pulmonary intermediate traits and diseases using meta-analysis in two large cohorts of LifeLines and the Womens's Genome Health Study (WGHS) with a total sample size of 36,595 individuals (Supplementary Methods and Supplementary Results). The results in the metabolic class showed that an increase in one copy of GATA2-rs4857855*C was significantly associated (p < 2.5×10⁻³) with higher TG and SH2B3-rs3184504*T with lower LDL-C. Additionally, an increase in one copy of SH2B3-rs3184504*T was nominally (p < .05) associated with a higher HbA1c level. The results on metabolic diseases indicated a nominal significant association of IL5-rs4143832*G with lower risk of obesity. In the cardiac class, we found a significant association of SH2B3-rs3184504*T with higher SBP, DBP, and MAP values. In the pulmonary class, there was a nominal significant association of SH2B3-rs3184504*T with lower FEV1/FVC. We also found nominal significant associations of GATA2-rs4857855*C with lower risk of COPD and asthma, IKZF2-rs12619285*G and IL1RL1-rs1420101*A with higher risk of asthma. Details on effects and odds ratio (OR) of meta-analysis results are presented in Supplementary Results and Figures S2 and S3.
GRS MR Results
We performed MR analyses using two approaches to distinguish the potential causal associations between eosinophil count and three classes of metabolic, cardiac, and pulmonary outcomes. As the eosinophil count data was not available in the WGHS, MR analysis in individual-level data only has been performed in the LifeLines cohort study.
Figure 2 presents the estimated causal associations of eosinophil count on traits and diseases in the metabolic class. In the first approach, eos-GRSLLs showed no significant causal association with metabolic intermediate traits and diseases (Figure 2a.1 and a.2). The F statistics derived from individual-level LifeLines data for metabolic traits were >63.3; and for diseases, except for T2D (=3.8), they were >13.4. In the second approach, the eos-GRSGWAS showed that a 10-s% higher genetically determined eosinophil count had a significant association with a 0.10 (±SE 0.03; p = 3.9×10⁻⁴) mmol/L higher TC, 0.13 (±0.03; p = 4.5×10⁻⁶) mmol/L higher HDL-C, 0.09 (±0.03; p = 3.8×10⁻³) mmol/L higher LDL-C (Figure 2b.1). However, there was significant evidence of heterogeneity of effect sizes among the five constituting genetic variants from meta-analyses results (Figure S4). We performed stepwise removal of genetic variants from eos-GRSGWAS until no significant heterogeneity remained. This adjustment resulted in the removal of the SH2B3-rs3184504*T genetic variant. Consequently, the significant association of eosinophil count with TC (0.09 ± 0.05, p = 0.07), HDL-C (0.05 ± 0.04, p = .21), and LDL-C (0.09 ± 0.04, p = .06) changed to non-significant, while the direction of effect remained consistent. In addition, eos-GRSGWAS, as an instrumental variable, showed that a genetically10-s% increase in eosinophil count was significantly associated with lower odds of obesity (OR 0.81, 95% confidence interval (CI) [0.74, 0.89]; p = 5.0×10⁻⁶; Figure 2b.2), while no heterogeneity was found in the analyses. No significant causal association was found between eos-GRSGWAS and the other studied metabolic traits or diseases (Figure 2b.1 and b.2).
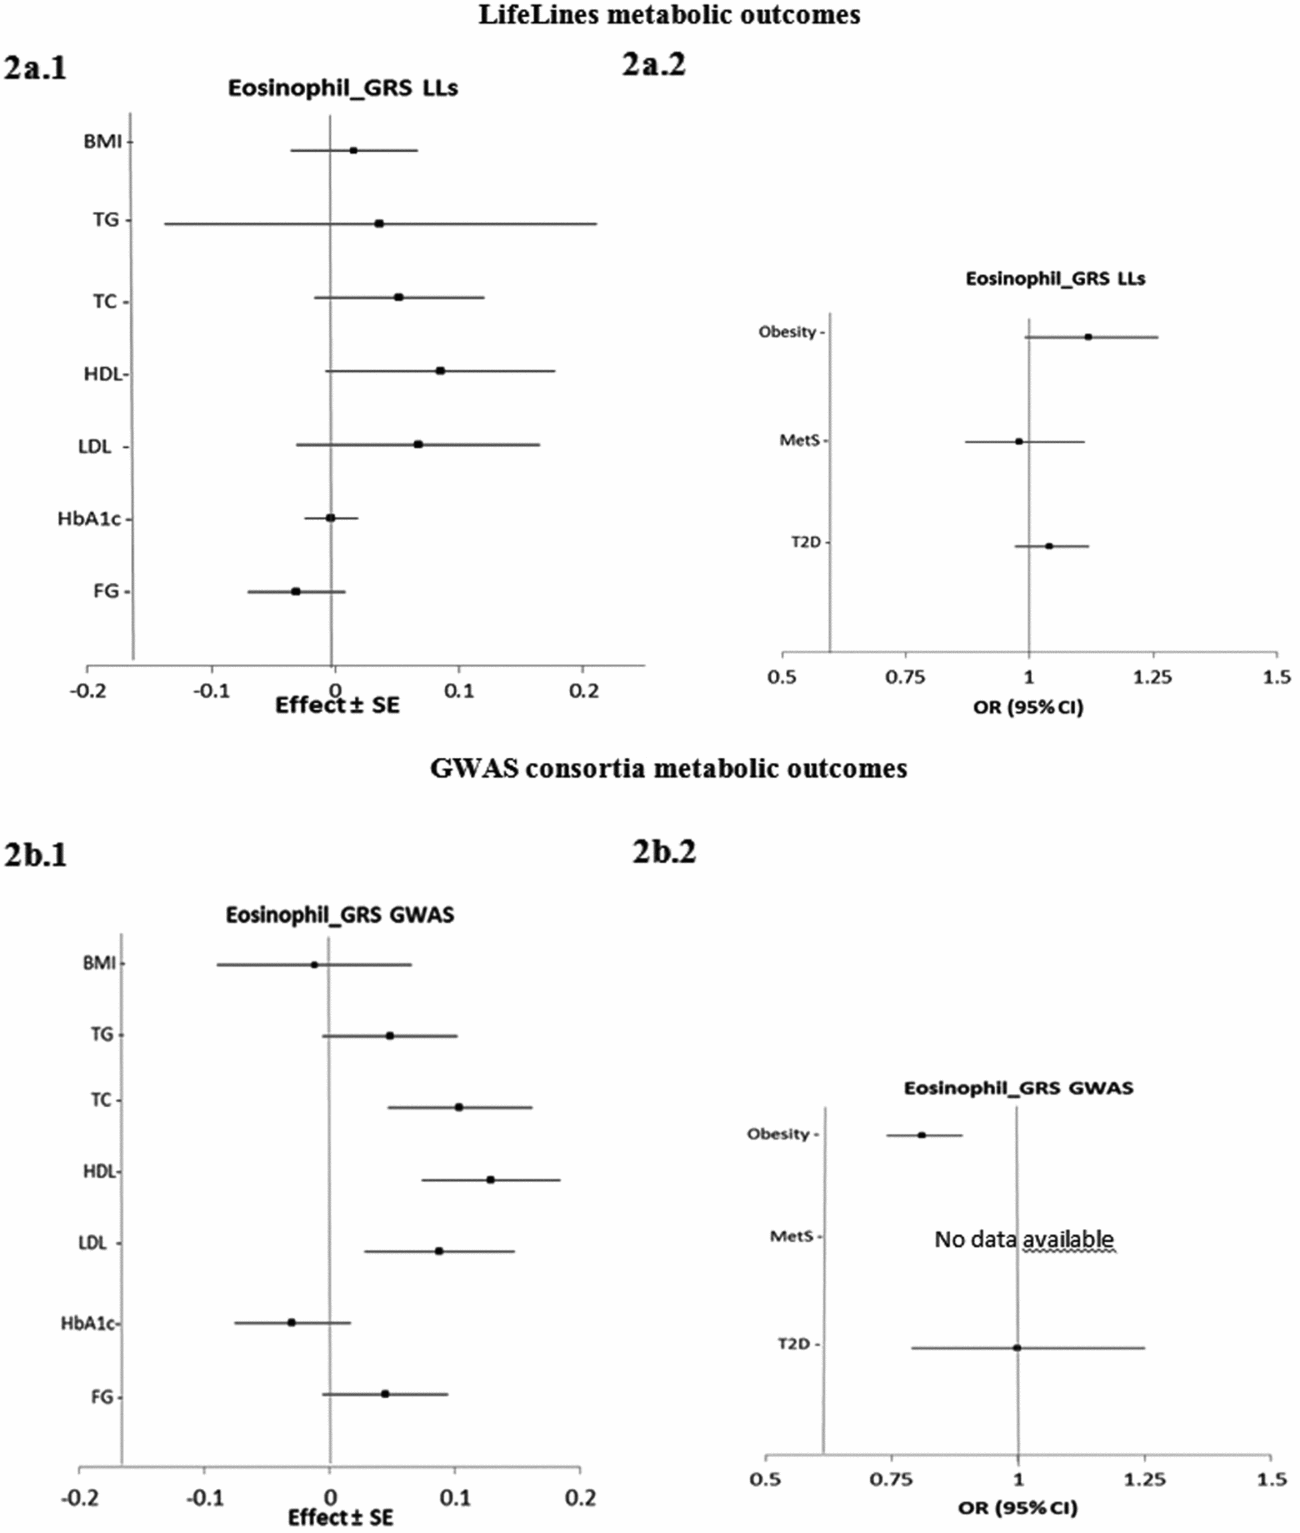
FIGURE 2 The causal effects with standard error of the eosinophil genetic risk scores on quantitative traits and the odds ratio with 95% confidence intervals on diseases in metabolic class, derived from the individual-level LLs data (eos-GRSLLs; a.1, a.2) and the GWAS consortia (eos-GRSGWAS; b.1 and b.2) before genetic variants heterogeneity effect adjustment. The causal estimate of the instrumental variable, which is presented for each outcome, corresponds to a 10-s% increase in actual eosinophil count. No GWAS consortium data was available for metabolic syndrome disease. GRS = genetic risk score, LLs = LifeLines cohort study, GWAS = genome wide association study, SE = standard error, OR = odds ratio, CI = confidence interval, BMI = body mass index, TG = triglycerides, TC = total cholesterol, HDL = high density lipoprotein, LDL = low density lipoprotein, HbA1c = hemoglobin A1c, FG = fasting glucose.
Figure 3 shows the estimated causal associations of eosinophil count on traits and diseases in the cardiac class. In the first approach, eos-GRSLLs provided nominal significant evidence of associations between eosinophil count and blood pressure measures—an increase of 0.06 (±0.02; p = .010) mmHg in DBP and 0.05 (±0.02; p = .021) mmHg in MAP per 1-SD higher eosinophil count (Figure 3a.1). However, the pleiotropic effect was significant (p pleiotropy < .05) for both traits. eos-GRSLLs showed no significant causal association with the other quantitative traits in the cardiac class (Figure 3a.1). eos-GRSLLs showed moderate but nominal significant effect on the risk of HTN (OR 1.18, 95% CI [1.02, 1.36]; p = .04) and MI (OR 1.05, 95% CI [1.02, 1.08]; p = .03; Figure 3a.2) with F statistics equal to 71.2 for cardiac traits, 19.3 for hypertension, and 2.0 for MI. However, the pleiotropic effect of eos-GRSLLs for all cardiac outcomes was significant (p pleiotropy < .05). Stepwise removal of the potential pleiotropic SH2B3-rs3184504*T genetic variant from eos-GRSLLs led to non-significant associations. When MR analysis of eos-GRS was tested using summary statistics of consortia data, the eos-GRSGWAS showed that a 10-s% higher genetically determined eosinophil count had a significant association with a 3.10 (±0.67, p = 4.01×10⁻⁶) mmHg higher SBP, 1.92 (±0.43, p = 6.81×10⁻⁶) mmHg higher DBP, and 1.86 (±0.40, p = 3.83×10⁻⁶) mmHg higher MAP (Figure 3b.1). However, there was significant evidence of heterogeneity of the effect sizes among the five constituting genetic variants (Figure S4). After removal of SH2B3-rs3184504*T as a heterogenic genetic variant, the significant association of SBP (1.38 ± 0.08; p = .08), DBP (0.32 ± 0.49; p = .52) and MAP (0.67 ± 0.47; p = .15) changed to non-significant. eos-GRSGWAS provided no significant causal association on MI, and for hypertension diseases, no consortium data was available (Figure 3b.2).
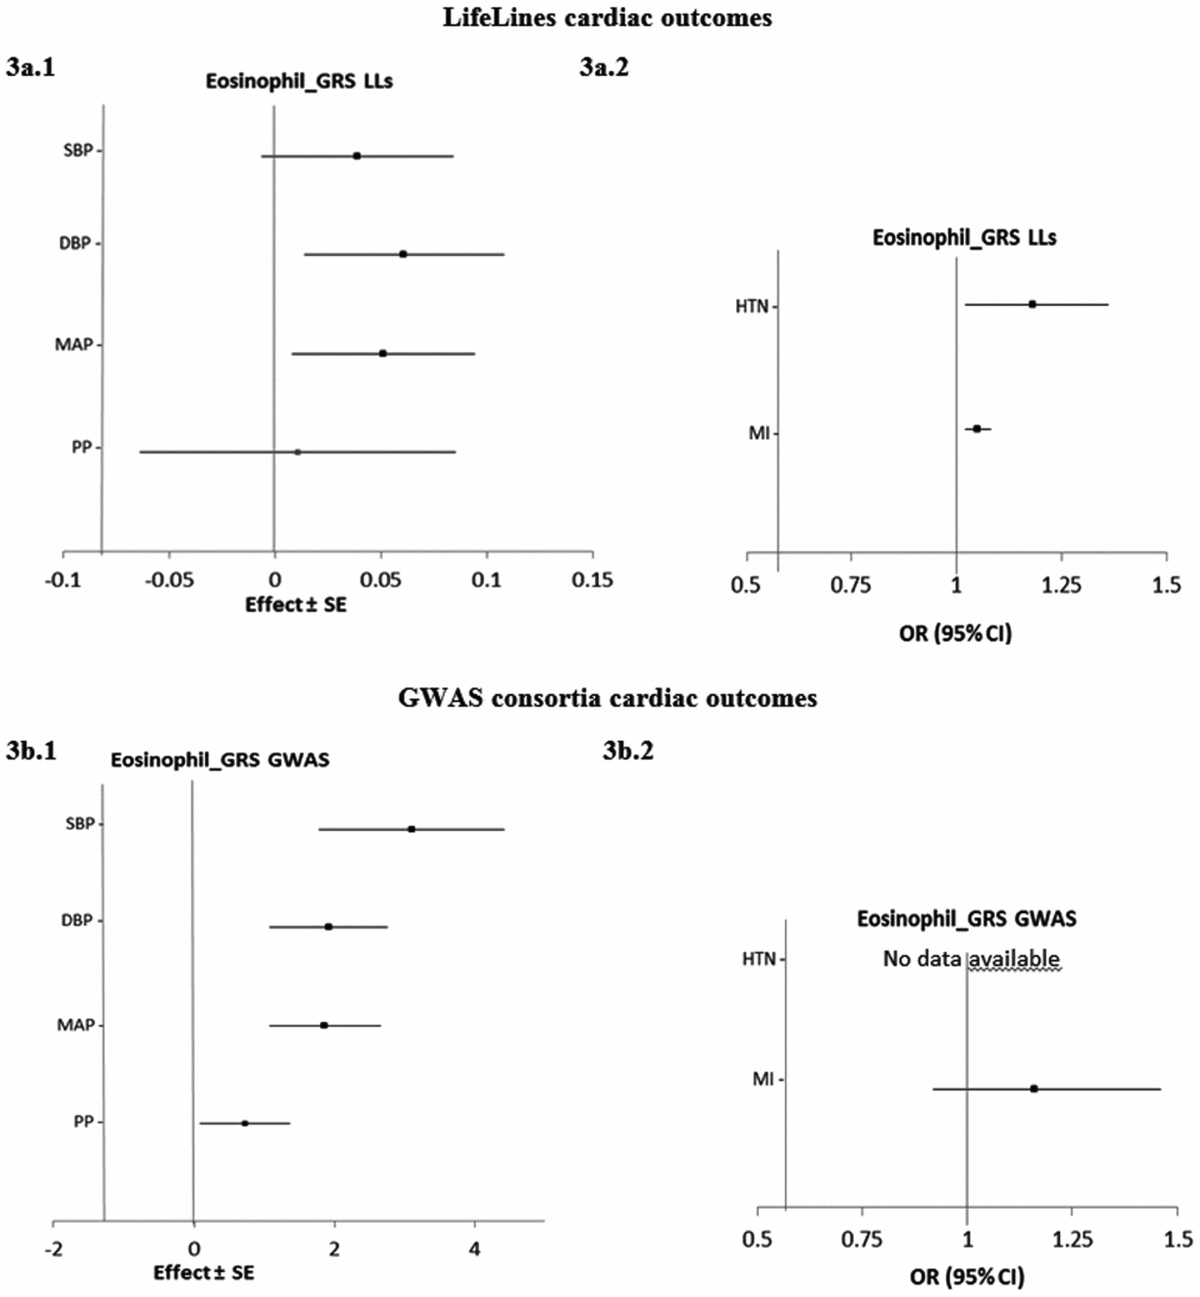
FIGURE 3 The causal effects with standard error of the eosinophil genetic risk scores on quantitative traits and the odds ratio with 95% confidence intervals on diseases in cardiac class, derived from the individual-level LLs data (eos-GRSLLs; a.1 and a.2) and the GWAS consortia (eos-GRSGWAS; b.1 and b.2) before genetic variants heterogeneity effect adjustment. The causal estimate of the instrumental variable, which is presented for each outcome, corresponds to a 10-s% increase in actual eosinophil count. No GWAS consortium data was available for hypertension disease. GRS = genetic risk score, LLs = LifeLines cohort study, GWAS = genome wide association study, SE = standard error, OR = odds ratio, CI = confidence interval, SBP = systolic blood pressure, DBP = diastolic blood pressure, MAP = mean arterial pressure, PP = pulse pressure, HTN = hypertension, MI = myocardial infarction.
Figure 4 shows the causal associations between eosinophil count and traits and diseases in the pulmonary class in individual-level LifeLines data. As the consortium data on pulmonary traits and diseases was not publicly available, the pulmonary traits and diseases were only tested for causal association using eos-GRSLLs. eos-GRSLLs showed no statistically significant causal association for these traits and diseases (Figure 4a.1 and a.2). The derived F statistics were >72.5 for pulmonary traits, 7.4 for COPD, and 6.2 for asthma diseases.
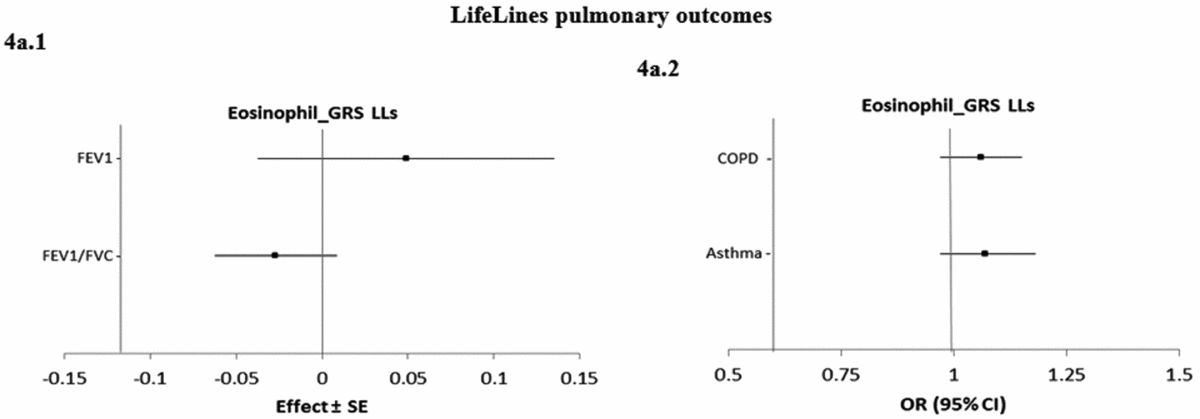
FIGURE 4 The causal effect with standard error of the eosinophil genetic risk scores on quantitative traits and the odds ratio with 95% confidence intervals on diseases in pulmonary class, derived from the individual-level LLs data (eos-GRSLLs) before genetic variants heterogeneity effect adjustment. The causal estimate of the instrumental variable, which is presented for each outcome, corresponds to a 10-s% increase in actual eosinophil count. GRS = genetic risk score, LLs = LifeLines cohort study, SE = standard error, OR = odds ratio, CI = confidence interval, FEV1 = Forced expiratory volume in one second, FVC = forced vital capacity, COPD = chronic obstructive pulmonary diseases.
Discussion
In our study, we replicated the significant associations between five eosinophil variants and eosinophil count. Additionally, we found significant associations between eosinophil genetic risk variants and TG, LDL-C, SBP, DBP, and MAP. Then, we used MR analyses to investigate the causal association between eosinophil count and a wide range of metabolic, cardiac, and pulmonary intermediate traits and diseases. We combined five eosinophil genetic variants into eos-GRS as instrumental variable in order to do MR analyses using individual-level LifeLines data and summary statistics of the consortia data. We found a protective causal association between eosinophil count and obesity using summary statistics, but this was inconclusive in the individual-level LifeLines data. We found no statistically significant causal association between eosinophil count and the other studied traits or diseases using eos-GRSLLs and eos-GRSGWAS after correction for heterogeneity through removal of potentially pleiotropic genetic variants. This suggests that the associations of blood eosinophil count and the studied complex traits and diseases may not be causal.
As a pleiotropic multifunctional leukocyte, eosinophil is important for the initiation and progression of diverse inflammatory responses (Jacobsen et al., Reference Jacobsen, Zellner, Colbert, Lee and Lee2011) that are implicated in the pathophysiology of common complex diseases (Amini et al., Reference Amini, Bashirova, Prins, Corpeleijn, Bruinenberg and Alizadeh2016; Bafadhel et al., Reference Bafadhel, McKenna, Terry, Mistry, Pancholi, Venge and Brightling2012; Fukui et al., Reference Fukui, Tanaka, Hamaguchi, Senmaru, Sakabe, Shiraishi and Nakamura2009; Kim, Noh et al., Reference Kim, Noh, Lee, Choi, Chung, Min and Kim2008; Shim et al., Reference Shim, Kim, Kang, Ahn, Lim, Lee and Cha2006). In observational studies, the inconsistent findings of correlation between eosinophil count and complex outcomes (Amini et al., Reference Amini, Bashirova, Prins, Corpeleijn, Bruinenberg and Alizadeh2016; Gkrania-Klotsas et al., Reference Gkrania-Klotsas, Ye, Cooper, Sharp, Luben, Biggs and Langenberg2010; Kim, Choi et al., Reference Kim, Choi, Hong, Kim, Jung and Kim2006; Kim, Noh et al., Reference Kim, Noh, Lee, Choi, Chung, Min and Kim2008; Meng et al., Reference Meng, Zhang, Zhang, Song, Lin, Zhang and Xue2012; Shim et al., Reference Shim, Kim, Kang, Ahn, Lim, Lee and Cha2006) might be due to the presence of measured and unmeasured confounders (Davey Smith & Ebrahim, Reference Davey Smith and Ebrahim2003, Reference Davey Smith and Ebrahim2005). In MR, a well-known statistical method for causality assessment, it is assumed that the genetic variation modifying the exposure should also affect the risk of outcome if the exposure is causally involved in the pathogenesis of outcome (Burgess et al., Reference Burgess, Small and Thompson2017). As genes randomly allocate at conception, their effects on exposures are unaffected by classical confounding factors and reverse causation (Davey Smith & Ebrahim, Reference Davey Smith and Ebrahim2003) or systemic errors would be largely prevented compared to an ordinary linear regression analyses (Davey Smith & Ebrahim, Reference Davey Smith and Ebrahim2003, Reference Davey Smith and Ebrahim2005). In a previous GWA study, Gudbijartson et al. (Reference Gudbjartsson, Bjornsdottir, Halapi, Helgadottir, Sulem, Jonsdottir and Stefansson2009) reported that five genetic variants (SH2B3-rs3184504, IL5-rs4143832, IKZF2-rs12619285, GATA2-rs4857855, and IL1RL1-rs1420101) were associated with eosinophil count in European and Asian populations. In this study, we replicated those associations between all five genetic variants and eosinophil count, with comparable effect sizes and the same direction of effect compared to the finding from the study of Gudbjartson et al. . Thus, as the starting point of our analysis, we used well-replicated short nucleotide polymorphisms (SNPs) robustly associated with eosinophil count. However, the explained variance of blood eosinophil count was limited (ranging from 0.001% to 0.3% from individual genetic variants and 0.6% from total genetic risk score).
Several observational studies indicated that a higher eosinophil count was associated with a higher risk of metabolic disorders (Amini et al., Reference Amini, Bashirova, Prins, Corpeleijn, Bruinenberg and Alizadeh2016; Babio et al., Reference Babio, Ibarrola-Jurado, Bullo, Martinez-Gonzalez, Warnberg and Salaverria2013; Kim, Choi et al., Reference Kim, Choi, Hong, Kim, Jung and Kim2006; Meng et al., Reference Meng, Zhang, Zhang, Song, Lin, Zhang and Xue2012; Shim et al., Reference Shim, Kim, Kang, Ahn, Lim, Lee and Cha2006). In our study, using eos-GRSGWAS, we found a significant causal association between a 10-s% increase in eosinophil count and a 1.23-fold decrease in the risk of obesity. However, using the individual-level data from the LifeLines cohort study, we did not find this causal association with obesity. In the individual-level data analysis, we used a two-stage method, which is efficient but can be biased with a weak instrument; in the summary data analysis, however, the likelihood-based method has been used, which is asymptotically efficient and less biased (Burgess et al., Reference Burgess, Small and Thompson2017). In the summary data analysis approach, information about genetic variants in eosinophil count (Gudbjartsson et al., Reference Gudbjartsson, Bjornsdottir, Halapi, Helgadottir, Sulem, Jonsdottir and Stefansson2009) and metabolic outcomes (Berndt et al., Reference Berndt, Gustafsson, Magi, Ganna, Wheeler, Feitosa and Ingelsson2013; Dupuis et al., Reference Dupuis, Langenberg, Prokopenko, Saxena, Soranzo, Jackson and Morris2010; Global Lipids Genetics Consortium et al., Reference Willer, Schmidt, Sengupta, Peloso, Gustafsson and Abecasis2013; Morris et al., Reference Morris, Voight, Teslovich, Ferreira, Segre and Steinthorsdottir2012; Yang et al., Reference Yang, Loos, Powell, Medland, Speliotes, Chasman and Visscher2012) came from different sources of European ancestry, but it assumes that the two samples were from comparable populations in terms of genomic ancestry (Burgess et al., Reference Burgess, Scott, Timpson, Davey Smith and Thompson2015); therefore, ethnic difference could not have affected our results. But, when we compared the odds estimates from our instrumental variable analysis (0.81) with the ordinary linear regression analysis (Amini et al., Reference Amini, Bashirova, Prins, Corpeleijn, Bruinenberg and Alizadeh2016; 1.18), we found no concordant estimates in obese individuals (Amini et al., Reference Amini, Bashirova, Prins, Corpeleijn, Bruinenberg and Alizadeh2016; Kim, Noh et al., Reference Kim, Noh, Lee, Choi, Chung, Min and Kim2008; Meng et al., Reference Meng, Zhang, Zhang, Song, Lin, Zhang and Xue2012). Taken together, it remains inconclusive whether eosinophil count is indeed a causal protective factor for obesity, as no other previous biologically plausible reason has been reported for such a causal association. Therefore, it is highly unlikely that they have true causal effects. Using eos-GRSs from individual-level LifeLines data and consortia data, we found no significant causal association with any of the other investigated quantitative traits and diseases in the metabolic class. In the study by Astle et al. (Reference Astle, Elding, Jiang, Allen, Ruklisa, Mann and Soranzo2016), they also could not find any causal association between eosinophil and cardio-metabolic outcomes in spite of their larger sample size. In sensitivity analysis using individual genetic variants, we found a significant association of GATA2-rs4857855 and higher TG. Also, SH2B3-rs3184504 showed significant association with lower LDL-C, which was consistent with results from Talmud et al. (Reference Talmud, Drenos, Shah, Shah, Palmen and Verzilli2009), while in other studies this variant showed either a significant association with higher LDL-C (Aghabozorg Afjeh et al., Reference Aghabozorg Afjeh, Ghaderian, Mirfakhraie, Piryaei and Zaim Kohan2014) or no significant association with LDL-C level at all (Gudbjartsson et al., Reference Gudbjartsson, Bjornsdottir, Halapi, Helgadottir, Sulem, Jonsdottir and Stefansson2009). Thus, current evidence does not support a causal role of eosinophil count for metabolic outcomes.
In the cardiac class, using eos-GRSs in both approaches, there was a significant causal association between eosinophil count and SBP, DBP, and MAP measurements; however, these associations were largely influenced by the SH2B3-rs3184504 variant. A few epidemiological studies showed inconsistent results on the association between eosinophil count and blood pressure (Amini et al., Reference Amini, Bashirova, Prins, Corpeleijn, Bruinenberg and Alizadeh2016; Kim, Noh et al., Reference Kim, Noh, Lee, Choi, Chung, Min and Kim2008; Meng et al., Reference Meng, Zhang, Zhang, Song, Lin, Zhang and Xue2012). We also could not quantify any significant causal association between eosinophil count and cardiac outcomes. This result is in line with Astle et al.’s (Reference Astle, Elding, Jiang, Allen, Ruklisa, Mann and Soranzo2016) study, which did not find causal associations between blood cell indices, including eosinophil and cardiovascular diseases (Astle et al., Reference Astle, Elding, Jiang, Allen, Ruklisa, Mann and Soranzo2016), using a large sample size. In our study, SH2B3-rs3184504 showed a significant association with SBP, DBP, and MAP, which was consistent with results of the International Consortium for Blood Pressure Genome-Wide Association Studies et al. (Reference Ehret, Munroe, Rice, Bochud, Johnson and Johnson2011). Other studies indicated that this genetic variant was also significantly associated with other blood cell traits (Tin et al., Reference Tin, Astor, Boerwinkle, Hoogeveen, Coresh and Kao2013; van der Harst et al., Reference van der Harst, Zhang, Mateo Leach, Rendon, Verweij, Sehmi and Chambers2012), blood platelet numbers (Soranzo et al., Reference Soranzo, Spector, Mangino, Kuhnel, Rendon, Teumer and Gieger2009), hemoglobin concentration (Ganesh et al., Reference Ganesh, Zakai, van Rooij, Soranzo, Smith, Nalls and Lin2009), hematocrit (Ganesh et al., Reference Ganesh, Zakai, van Rooij, Soranzo, Smith, Nalls and Lin2009), LDL-C (Talmud et al., Reference Talmud, Drenos, Shah, Shah, Palmen and Verzilli2009), cardiovascular risks (Gudbjartsson et al., Reference Gudbjartsson, Bjornsdottir, Halapi, Helgadottir, Sulem, Jonsdottir and Stefansson2009; Schunkert et al., Reference Schunkert, Konig, Kathiresan, Reilly, Assimes, Holm and Samani2011), and multiple autoimmune disorders (Alcina et al., Reference Alcina, Vandenbroeck, Otaegui, Saiz, Gonzalez, Fernandez and Matesanz2010; Barrett et al., Reference Barrett, Clayton, Concannon, Akolkar, Cooper and Erlich2009; Stahl et al., Reference Stahl, Raychaudhuri, Remmers, Xie, Eyre, Thomson and Plenge2010). The association of SH2B3-rs3184504 variant with multiple complex phenotypes points to its strong pleiotropic characteristic (Ding & Kullo, Reference Ding and Kullo2011; Pickrell et al., Reference Pickrell, Coop, Novembre, Kudaravalli, Li, Absher and Pritchard2009). In our study, there was also statistical evidence for a pleiotropic effect of this variant, which violates MR assumptions. In a Chinese population study, no significant associations were found between eosinophil genetic variants and chronic heart diseases (Lian et al., Reference Lian, Huang, Huang, Xu, Le, Yang and Duan2013; Ye et al., Reference Ye, Hong, Li, Xu, Huang, Xu and Duan2015). Altogether, across the different analyses (evidence from the observational study (Amini et al., Reference Amini, Bashirova, Prins, Corpeleijn, Bruinenberg and Alizadeh2016) and MR analyses), the results on cardiac outcomes consistently suggested an absence of causal association.
In the pulmonary class, using eos-GRSLLs, we found no significant causal association between eosinophil count and pulmonary traits and diseases. Since consortium data on pulmonary outcomes was not available, MR analysis using summary statistics could not be performed. In individual-level LifeLines data, the F statistic values for pulmonary traits were higher than 72.5, but for diseases the values were less than 7.4, indicating that weak instrument bias is likely to have had a substantial influence on our analyses in pulmonary diseases. Statistical power in MR analysis is a function of parameters including the proportion of variation in the exposure variable explained by the genetic predictor and the true causal association between the exposure and outcome variable. Therefore, despite the significant association between eosinophil count and pulmonary outcomes in previous observational studies (Amini et al., Reference Amini, Bashirova, Prins, Corpeleijn, Bruinenberg and Alizadeh2016; Hospers et al., Reference Hospers, Schouten, Weiss, Postma and Rijcken2000; Mensinga et al., Reference Mensinga, Schouten, Weiss and Van der Lende1992), we found no causal association of eosinophil on pulmonary diseases, which might be due to power limitations of the study. Also, in our large cohort, we showed no causal association of eosinophils with pulmonary intermediate traits (FEV1 and FEV1/FVC) as determinants of pulmonary diseases pathophysiology. Our results were inconsistent with a study from the United Kingdom, which indicated significant causal associations between eosinophils and asthma, and provided evidence that eosinophils are key effector cells in the pathogenesis of asthma (Astle et al., Reference Astle, Elding, Jiang, Allen, Ruklisa, Mann and Soranzo2016). The observed causal association in that study may be explained by a larger sample size and stronger instrumental variable (Astle et al., Reference Astle, Elding, Jiang, Allen, Ruklisa, Mann and Soranzo2016). Since patients with pulmonary diseases can be clinically or physiologically stratified into several subgroups (Fahy, Reference Fahy2015), the lack of causal associations in our study might be due to biases by subgroup stratification or possibly insufficient power to identify a relatively small causal effect of eosinophil on pulmonary outcomes in our database. As well, environmental factors over lifetime might mediate the potential causal association between genetically elevated eosinophil and asthma, which needs to be investigated. When we tested the association between individual eosinophil genetic variant and pulmonary outcomes, we noticed nominal associations of SH2B3-rs3184504 with FEV1/FVC, GATA2-rs4857855 with COPD, IKZF2-rs12619285 and IL1RL1-rs1420101 with asthma. Several studies indicated that IL1RL1 gene cluster genetic variants, including IL1RL1-rs1420101, were associated with asthma, atopy, and the development of childhood asthma (Akhabir et al., Reference Akhabir, Berube, Bosse, Laviolette, Hao, Nickle and Sandford2014; Ali et al., Reference Ali, Zhang, Thomas, McLean, Bizzintino, Laing and Hayden2009; Gudbjartsson et al., Reference Gudbjartsson, Bjornsdottir, Halapi, Helgadottir, Sulem, Jonsdottir and Stefansson2009; Reijmerink et al., Reference Reijmerink, Postma, Bruinenberg, Nolte, Meyers, Bleecker and Koppelman2008; Savenije et al., Reference Savenije, Kerkhof, Reijmerink, Brunekreef, de Jongste, Smit and Koppelman2011; Torgerson et al., Reference Torgerson, Ampleford, Chiu, Gauderman, Gignoux, Graves and Nicolae2011). Consistent with our results, Tulah et al. (Reference Tulah, Holloway and Sayers2013), using UK family cohort data, found no association between IL1RL1-rs1420101 and asthma and FEV1; however, in an Icelandic cohort study, this variant did show a significant association with asthma (Gudbjartsson et al., Reference Gudbjartsson, Bjornsdottir, Halapi, Helgadottir, Sulem, Jonsdottir and Stefansson2009). When all of the evidence is taken together, a direct link between eosinophil and pulmonary outcomes remains to be elucidated and should be interpreted with caution.
Our study has several strengths. We applied MR analyses using two models of individual-level data and summary statistics data. In individual-level LifeLines data, all study participants followed the same standardized protocols and were examined at the same clinic; thus, the measurements and laboratory assays for all subjects were comparable. For the consortia summary statistics data, the large sample size is a major advantage. However, there were potential biases to be considered in our analysis. First, the power to detect an association in population-based studies is restricted by a low prevalence of disease (Table S2); thus, the non-significant results in diseases may not warrant rejection of the role of eosinophil-associated genetic variants in the pathogenesis of complex diseases. Second, using multiple genetic variants in a GRS for MR analysis, statistical power can be increased by explaining a greater proportion of eosinophils variance. Despite this, only a small proportion (0.6%) of variance in eosinophils was explained. Therefore, follow-up analyses are needed using a stronger eosinophil genetic risk score from forthcoming studies. Third, it should be taken into account that gene–gene and gene–environment interaction effects probably contribute to inter-individual variation and the causal effect size of this hematologic trait. Fourth, for many complex diseases, the disease is not a single disease but rather a syndrome consisted of many heterogeneous underlying molecular mechanisms. For example, both asthma and COPD include eosinophilic and non-eosinophilic types. As the importance of eosinophil as a causative factor is really dependent on which population to study, follow-up studies may need to focus on a stratified population in these complex diseases.
Conclusion
Following the observational association of eosinophil count with complex outcomes, we found that eosinophil genetic variants were significantly associated with TG, LDL-C, SBP, DBP, and MAP. However, the causal role of eosinophil on complex metabolic, cardiac, and pulmonary outcomes could not be verified. The causality of eosinophils in the pathogenesis of asthma needs to be investigated in further studies with stronger instrumental variables using a larger number of eosinophil count-associated SNP sets. Rather than being a causal effect, our results suggest that the widespread associations of eosinophil count with complex disease outcomes in observational studies may at least partly be caused by reverse causation and pleiotropic effects.
Acknowledgments
The authors would like to acknowledge the services of the Lifelines Cohort Study, the contributing research centers delivering data to Lifelines, the staff from the LifeLines Cohort Study, and the Medical Biobank Northern Netherlands, the participating general practitioners and pharmacists, and all the study participants.
The LifeLines Cohort Study is supported by the Netherlands Organization of Scientific Research NWO (grant 175.010.2007.006), the Economic Structure Enhancing Fund (FES) of the Dutch government, the Ministry of Economic Affairs, the Ministry of Education, Culture and Science, the Ministry for Health, Welfare and Sports, the Northern Netherlands Collaboration of Provinces (SNN), the Province of Groningen, University Medical Center Groningen, the University of Groningen, Dutch Kidney Foundation, and Dutch Diabetes Research Foundation.
The Women's Genome Health Study is supported by HL043851 and HL080467 from the National Heart, Lung, and Blood Institute and CA047988 from the National Cancer Institute, the Donald W. Reynolds Foundation and the Fondation Leducq, with collaborative scientific support and funding for genotyping provided by Amgen.
Mrs M. Amini was supported by Groningen University Institute for Drug Exploration (GUIDE), UMCG, Groningen, the Netherlands, and Digestive Disease Research Institute (DDRI), TUMS, Tehran, Iran.
Disclosure of Interests
None.
Supplementary material
To view supplementary material for this article, please visit https://doi.org/10.1017/thg.2018.6


 Open access