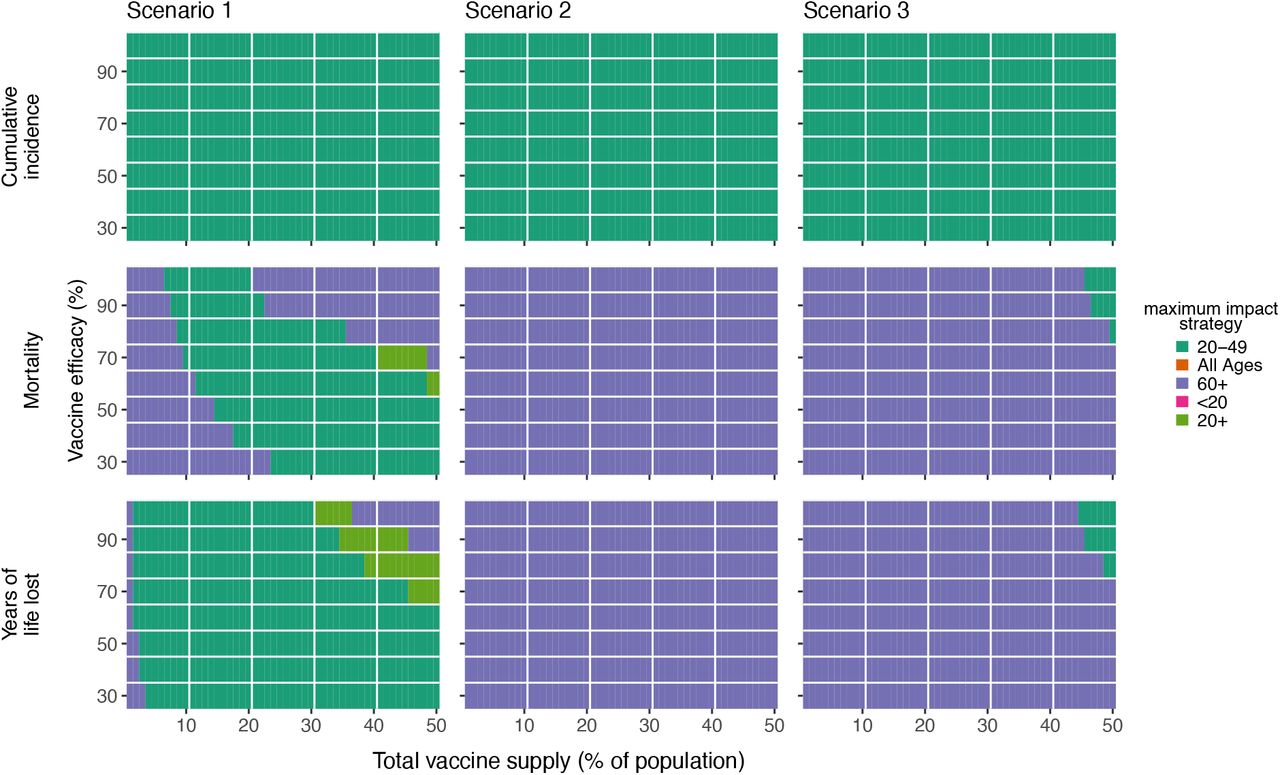
Figure S2: Impact of vaccine efficacy on maximum impact strategies (all-or-nothing vaccine).
Heatmaps show the prioritization strategies resulting in maximum reduction of infections (top row), mortality (middle row), and years of life lost (bottom row) across Scenario 1 (1% rollout/day, R0 = 1.3; left column), Scenario 2 (1% rollout/day, R0 = 2.6; middle column), and Scenario 3 (anticipatory rollout, R0 = 2.6; right column). Each heatmap shows results from simulations varying vaccine supply and vaccine efficacy as indicated. Shown: contact patterns and demographics of the United States (21, 22); all-or nothing and transmission blocking vaccine. See Fig. S4 for leaky vaccine results.