
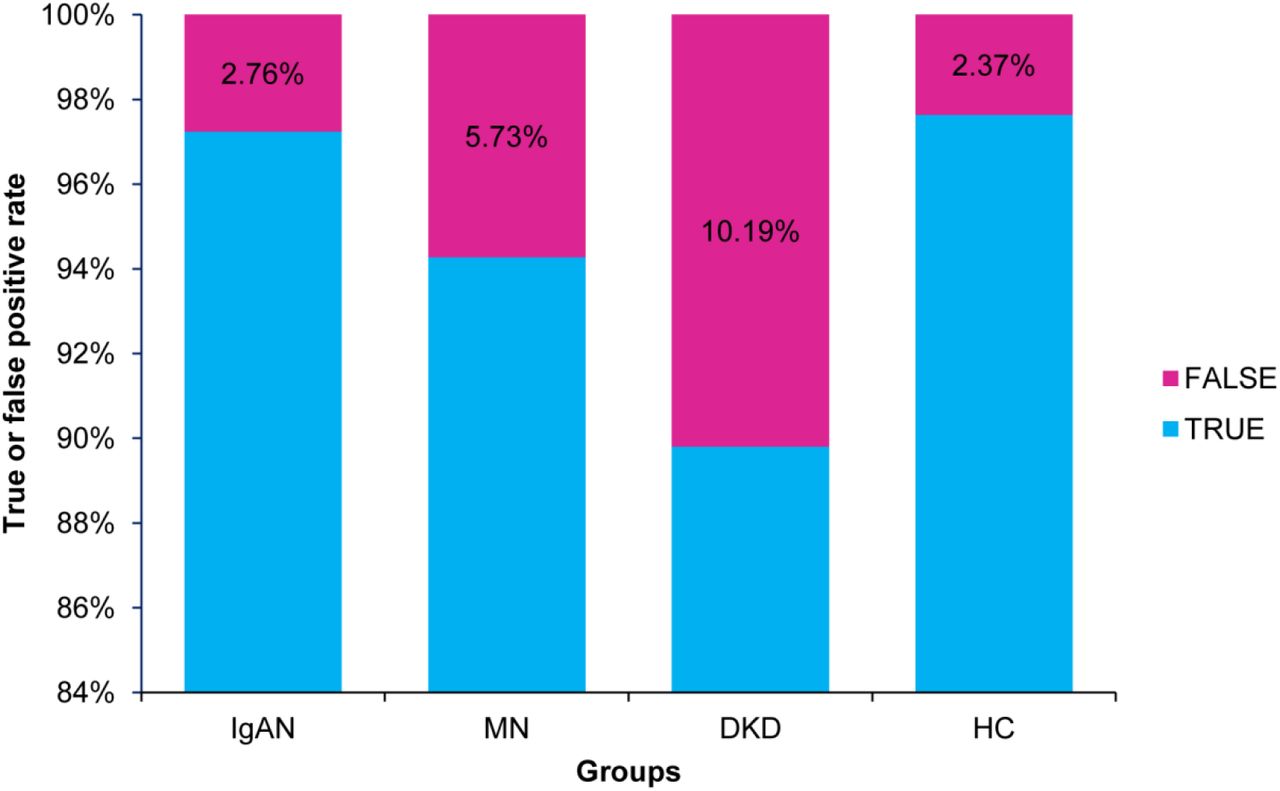
Figure 3.
Bar chart of the diagnosis error rate of three types of CKD patients and healthy control group for validation dataset of the XGBoost model.
Bar chart of the diagnosis error rate of three types of CKD patients and healthy control group for validation dataset of the XGBoost model.