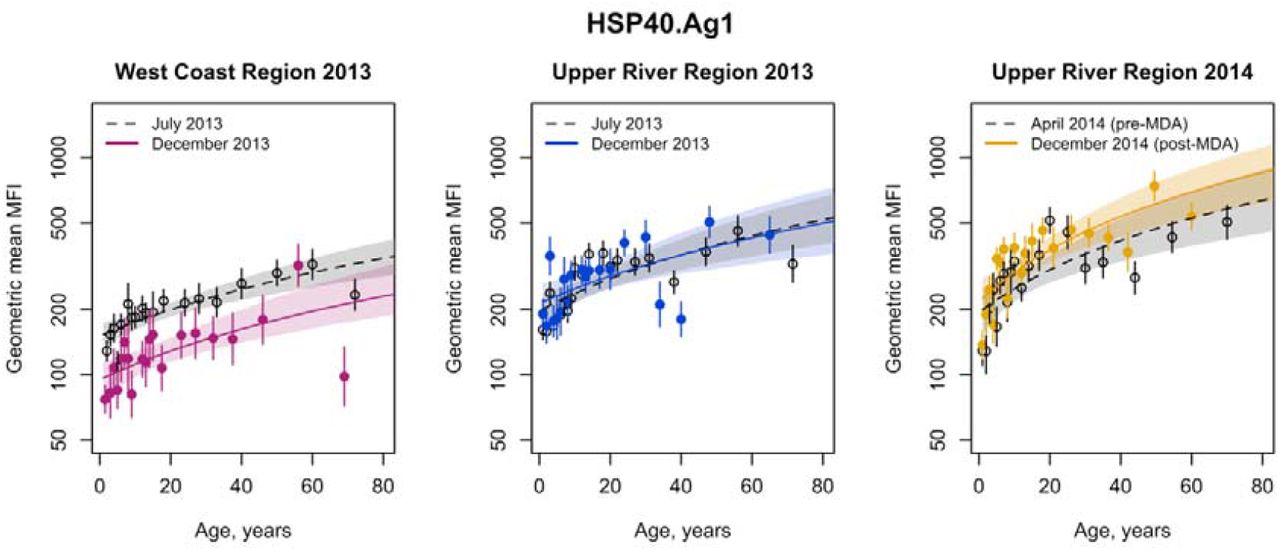
Figure 5. Age-dependent antibody acquisition for HSP40.Ag1 by geographical region and transmission season.
Mean and 95% confidence intervals of geometric mean antibody levels for each age group are shown as circles and vertical lines, respectively. Median fit of the antibody acquisition model is shown as a solid line for the end of the transmission season (December) and dotted line for the dry season (April) or start of the transmission season (July). Shaded regions are the 95% credible intervals of the model fit.