
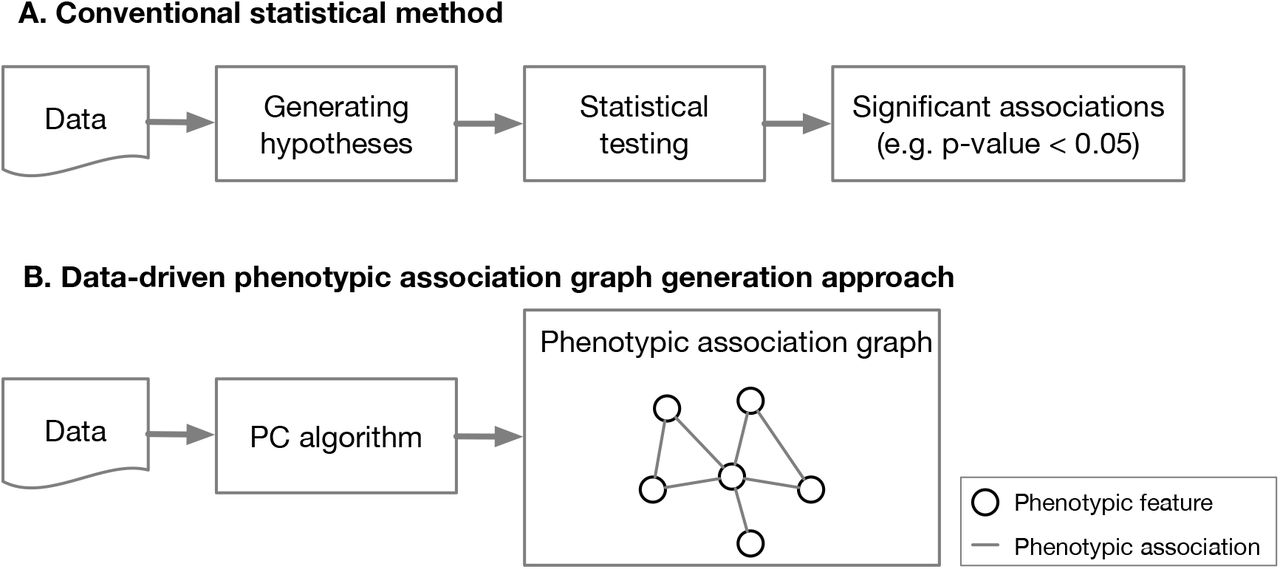
Figure 1: An illustration of conventional phenotypic association identification methods (A) and data-driven phenotypic association graph generation approach.
Given the data, the conventional methods typically first generate some hypotheses, i.e., candidate feature associations of interest, then apply statistical testing approaches to calculate the p-values. In contrast, the data-driven approach, without any hypothesis, takes all features as input, and comprehensively generates the phenotypic association graph, of which nodes are features studied and undirected edges are identified associations among the features.