
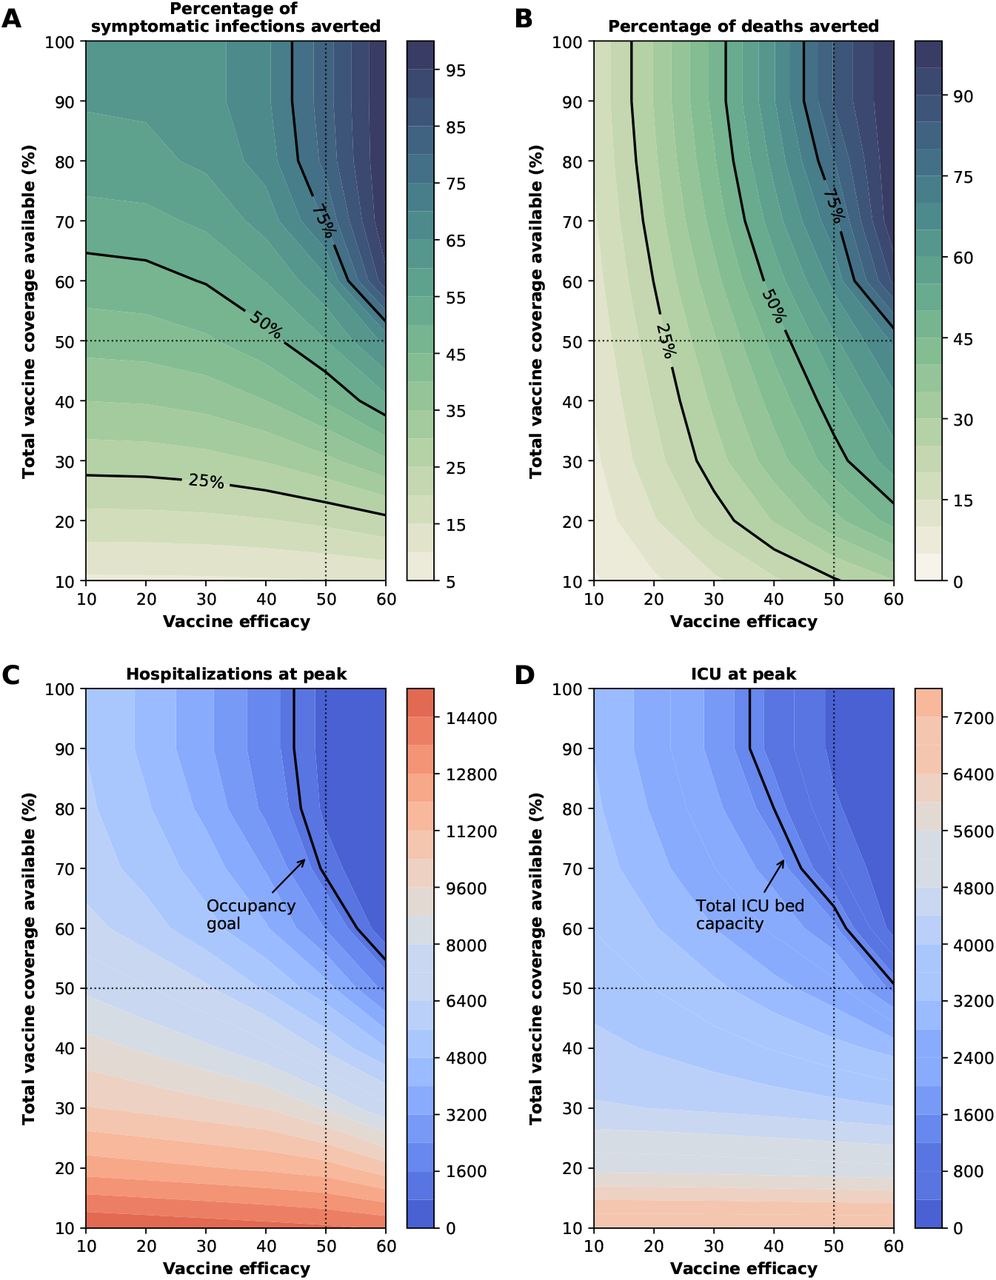
Figure 7: Four key metrics of COVID-19 burden under optimal distribution of vaccine for VECOV = 60%.
Percentage of symptomatic infections (A) and deaths (B) averted, number of maximum non-ICU (C) and ICU (D) hospitalizations as a function of VE and vaccination coverage (total vaccine available as a percentage of the population). The dotted lines correspond to VE = 50% and vaccine available to cover 50% of the population. The isoclines indicate the current goal for WA state of having 10% of licensed general (non-ICU) hospital beds occupied by COVID-19 patients in (C) and total ICU licensed hospital beds in WA state in (D).