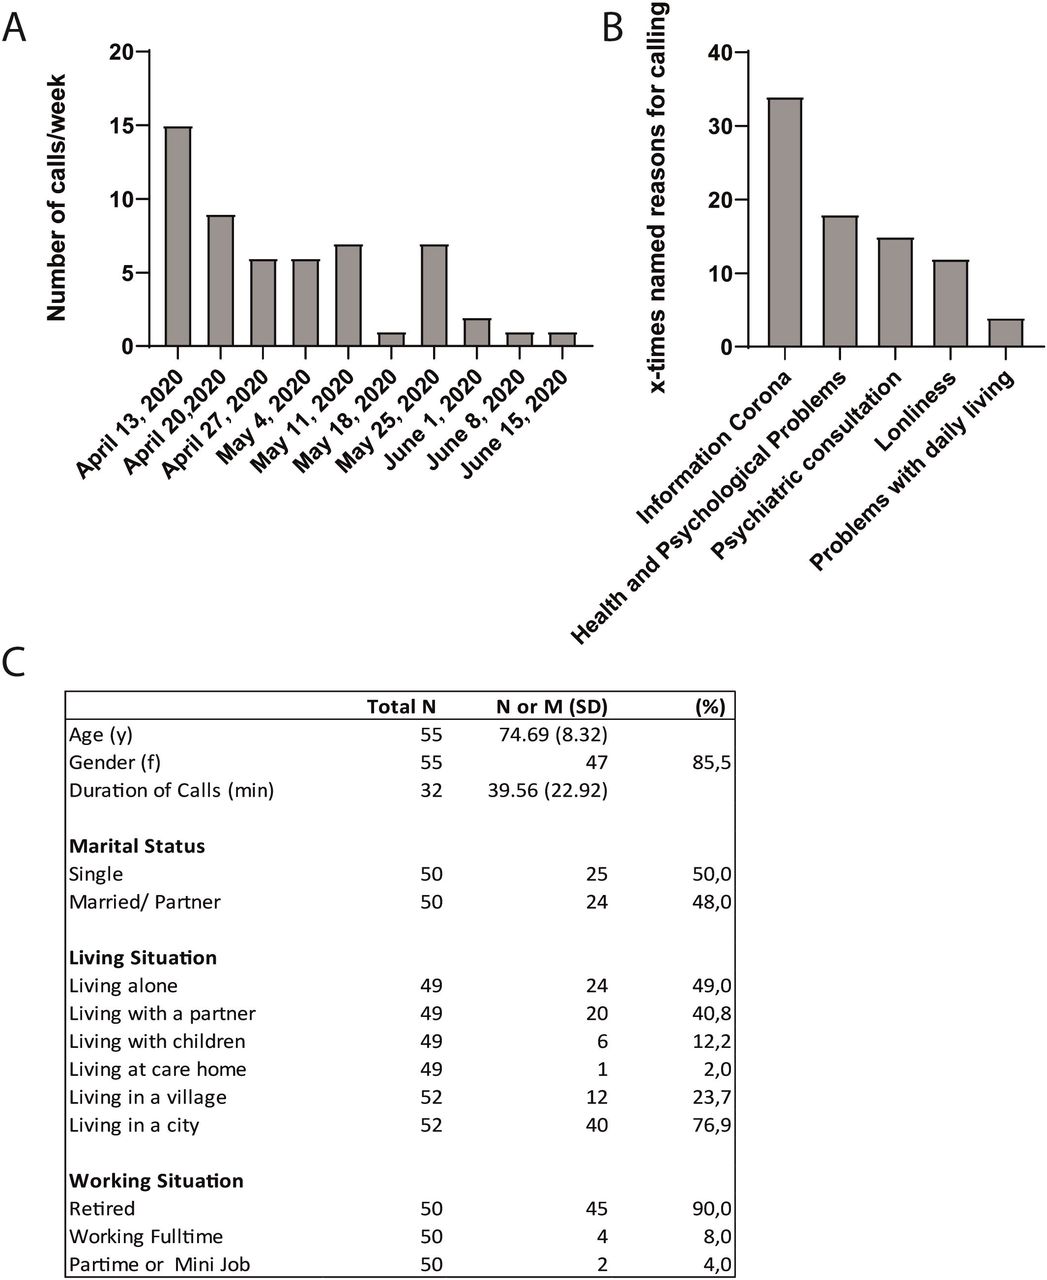
Figure 1.
(A) Histogram showing the frequency of calls/week received at the geriatric helpline. (B) Graph depicting the reasons for calling the geriatric hotline. (C) Demographic characteristics of callers. Total N represents the number of callers which participated which answered the question. N represents the number of callers which affirmed the feature asked. The percentage was calculated as (N/total N)*100.