
Summary
ACE inhibitors (ACEIs) are commonly prescribed for hypertension, a global risk factor for cardiovascular disease. Their primary side effect is a dry cough which affects 5-35% of users. As clinical guidelines recommend switching those experiencing cough to an angiotensin-II receptor blocker, we have used this switch as a proxy for ACEI-induced cough. Through a two-stage multi-ancestry genome-wide association study, including up to 7,030 cases and 39,921 controls, we identify five independent genome-wide significant associations implicating six protein-coding genes, including INHBC, KCNIP4, NTSR1 and PREP which encode proteins involved in the nervous system. We also observe genetic overlap between ACEI-induced cough and chronic dry cough through genetic correlation and phenome-wide association studies. In line with existing hypotheses, our findings suggest a neurological basis for the pathology of ACEI-induced cough, particularly the role of proinflammatory mediators in sensory airway sensitivity and cough reflex modulation, and shared biological mechanisms with chronic dry cough.
Introduction
Angiotensin-converting enzyme inhibitors (ACEIs) are a class of medications mainly used to treat hypertension and heart failure1, and are among the most commonly prescribed drugs2,3.
ACEIs reduce blood pressure by inhibiting the activity of ACE, an important component of the renin-angiotensin-aldosterone system (RAAS). ACE inhibition blocks the conversion of angiotensin I to angiotensin II and the degradation of bradykinin and substance P, thus preventing the constriction of blood vessels4.
Although ACEIs are generally well tolerated, the most common side effect of their use is a dry (non-productive) persistent cough, which affects 5-35%5 of users. Gender and ethnicity are known risk factors associated with this side effect: cough is 1.5 times more likely in females compared with males6, and 2.5 times more likely in East Asian populations than white populations7. ACEI-induced cough can only be treated by discontinuing treatment5 and current prescribing guidelines recommend switching to an angiotensin-II receptor blocker (ARB)8, a better-tolerated anti-hypertensive9. As a result, switching from an ACEI to an ARB is a marker for ACEI-induced cough10 that can be utilised in genetic studies11.
The mechanisms underlying ACEI-induced cough have been poorly understood. Early hypotheses have suggested this is a response to the accumulation of inflammatory neuropeptides, particularly bradykinin and substance P, upon ACE inhibition5,12. Genes involved in these pathways have formed the basis of many candidate gene studies13–20, but these have failed to yield replicable findings and proved inconclusive about the role of these mediators in ACEI-induced cough. In light of this, several genome-wide association studies11,21,22 (GWASs) have since been performed, the largest of which included 1,595 cases and 5,485 controls from the Electronic Medical Records and Genomics (eMERGE) Network and identified a genome-wide significant signal within an intronic region of KCNIP4, which was replicated in two independent datasets11. However, larger sample sizes are likely to be required to discover additional genetic associations, improve the fine-mapping of associated loci and understand the biological pathways involved in ACEI-induced cough.
Here, we have used a class switch from an ACEI to an ARB in electronic health records (EHRs) to define a proxy phenotype of ACEI-induced cough, and performed a multi-ancestry GWAS including over three times the number of cases studied to date. We map associated variants to putative causal genes and by studying shared genetic architecture and conducting phenome-wide association studies (PheWASs), provide insights into the shared aetiology of ACEI-induced cough and chronic dry cough.
Results
Study-level characteristics
Using primary care EHRs linked to UK Biobank23 and the Extended Cohort for E-health, Environment and DNA (EXCEED)24 study, cases were defined as individuals who switched from an ACEI to an ARB within 12 months of initiating ACEI treatment (index date) and were assumed to have switched due to cough, while controls were defined as continuous users of ACEIs. A description of the characteristics of cases and controls in both cohorts is presented in Table 1. The overall prevalence of ACEI-induced cough was 13.6% and 15.2% in UK Biobank and EXCEED, respectively; however, stratifying by genetically defined ancestry showed a higher prevalence in individuals of East Asian (21.6% vs 13.5%, p-value = 0.004) and South Asian (16.2% vs 13.5%, p-value = 0.011) ancestries, compared to Europeans in UK Biobank (Table 1). Supporting the use of the drug class switch as a proxy for ACEI-induced cough, the number of clinical cough codes in 12 months after index date was also associated with case status (p-value < 0.001; Supplementary Table 1).
Study-level characteristics of Stage 1 meta-analysis cohorts.
Discovery of associated genomic loci
A two-stage multi-ancestry meta-analysis approach was used to identify genome-wide significant signals associated with ACEI-induced cough (Supplementary Figure 1). A total of 5,435 cases and 34,436 controls from four ancestral groups in UK Biobank (African, East Asian, European and South Asian) and one ancestral group from EXCEED (European) were included in the Stage 1 meta-analysis of ∼17M variants (Figure 1; Supplementary Figure 2; Supplementary Table 2). The Stage 1 meta-analysis had a genomic inflation factor (λGC) of 0.998, hence no post meta-analysis genomic control correction was performed. From the variants reaching genome-wide significance (p-value < 5×10⁻⁸), we identified 9 sentinel variants; following conditional analysis, we found one additional independent variant (rs78598167) reaching genome-wide significance, resulting in 10 signals across 9 loci which were followed up in the eMERGE Network study11 (Stage 2). Of these, five were genome-wide significant in the joint meta-analysis of Stage 1 and Stage 2 (Table 2A), three were genome-wide significant in Stage 1, but were not represented in Stage 2 (Table 2B), and the remaining two did not reach genome-wide significance in the joint meta-analysis (Supplementary Table 3). Overall, we found 8 genome-wide significant signals (5 in the joint meta-analysis, and 3 in Stage 1 only) located across 7 loci. One of the signals (rs1495509) corresponded to the previously described association in KCNIP411, and the remainder were novel.
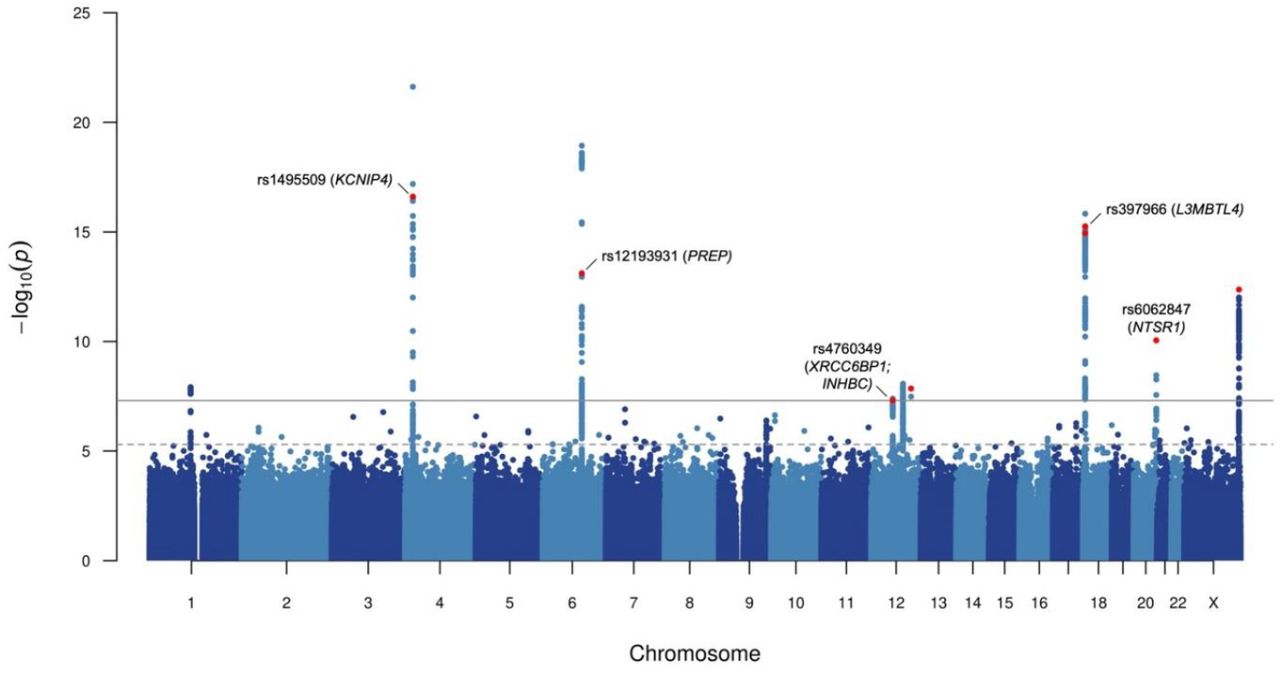
Manhattan plot for Stage 1 genome-wide meta-analysis of ACEI-induced cough.
Each point represents a genetic variant, with the x-axis relating to genomic position (build hg19) and y-axis relating to –log10(p-value) of association. The dotted grey horizontal line represents the suggestive significance threshold (p-value of 5×10⁻⁶) and the solid grey horizontal line represents the genome-wide significance threshold (p-value of 5×10⁻⁸). Variants highlighted in red were either genome-wide significant in joint meta-analysis of Stage 1 and Stage 2, or genome-wide significant in Stage 1 only (without representation in Stage 2). Variants reaching genome-wide significance in joint meta-analysis are also annotated with rs number and mapped genes identified through fine-mapping of respective loci.
Independent sentinel variants associated with ACEI-induced cough identified from genome-wide meta-analysis of multiple ancestral groups in UK Biobank and EXCEED (Stage 1), corresponding results in the eMERGE Network (Stage 2), and joint analysis of both stages. Stage 1 included a maximum of 5,435 cases and 34,436 controls and Stage 2 included a maximum of 1,595 cases and 5,485 controls.
Identification of putative causal variants and genes
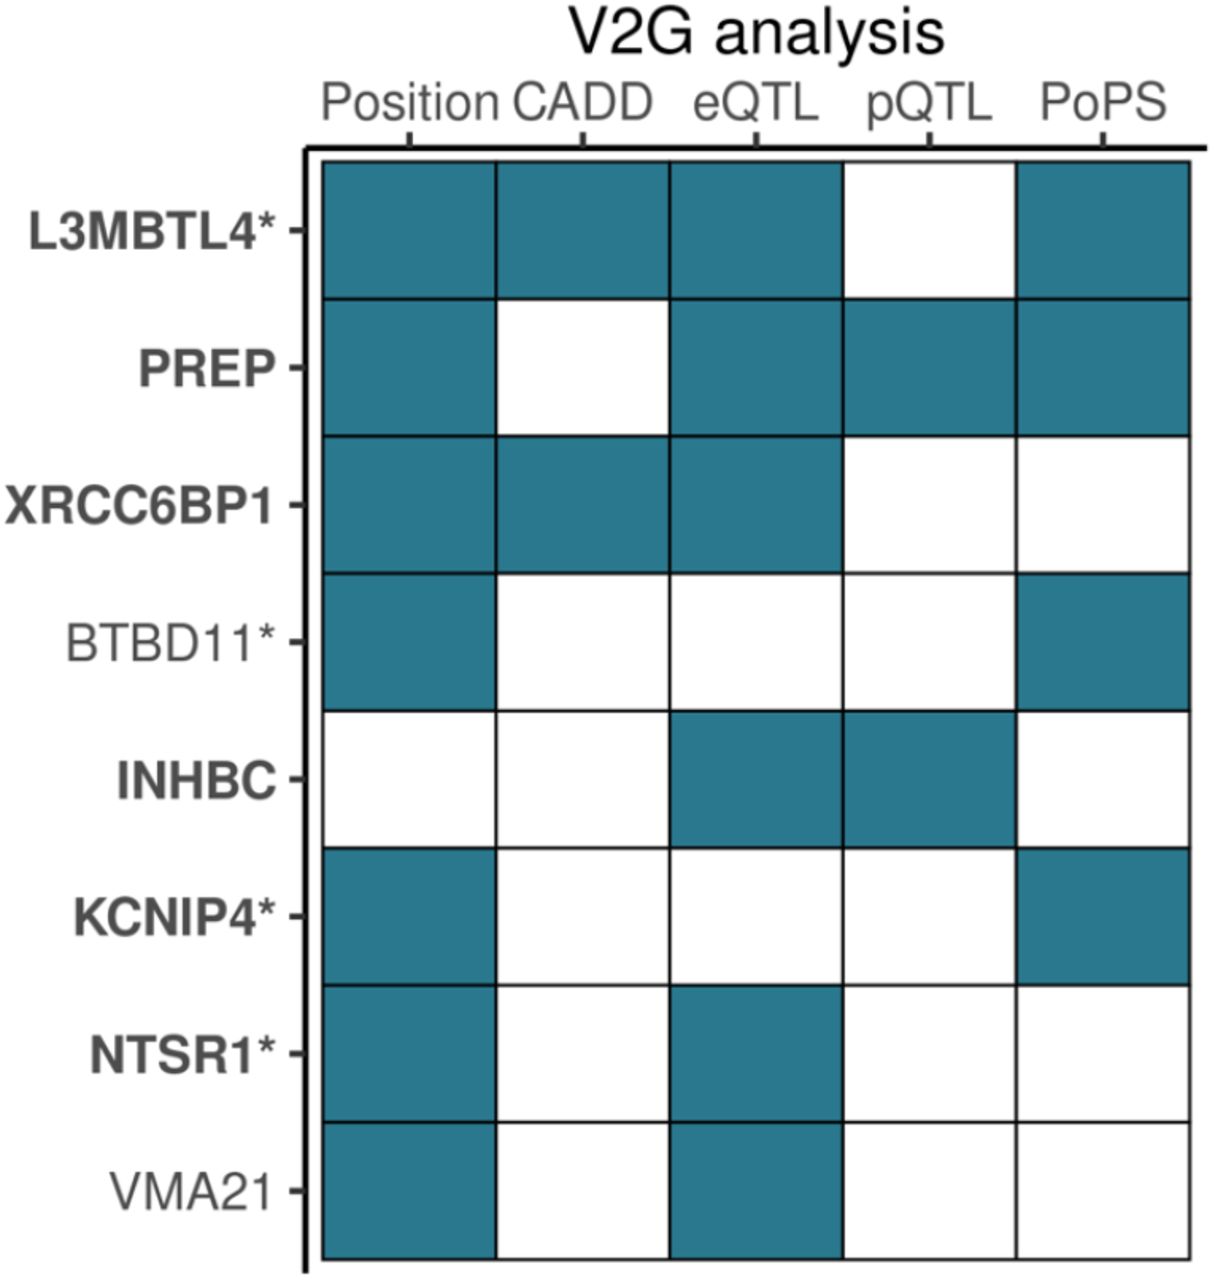
Through fine-mapping of these 7 loci, we obtained 8 credible sets relating to each of the signals in Table 2, which included between 1 and 51 variants. Four out of the 148 credible set variants had a posterior inclusion probability [PIP] >50%. We defined refined credible sets containing a total of 17 variants with PIP ≥10%. All of these were annotated as non-coding (Supplementary Table 4) and were used as the input for our variant-to-gene mapping strategy to identify putative causal genes involved in the biological mechanism of ACEI-induced cough. The list of genes identified and the refined credible set variants supporting the mapping for each criterion are described in Supplementary Table 5.
Firstly, mapping based on position identified 7 unique nearest genes, and secondly CADD annotation of non-coding variants implicated an additional two genes (Supplementary Table 4). Thirdly, expression quantitative trait loci (eQTL) data were used to identify a total of 9 variants across 5 credible sets as significantly associated with the expression of 15 genes (FDR <0.05) in at least one of the 34 relevant tissues from the GTEx v825, eQTLGen26 and BRAINEAC27 reference datasets (Supplementary Figure 3; Supplementary Table 6). Fourth, we used protein quantitative trait loci (pQTL) data to identify 5 variants across two credible sets significantly affecting (p-value <1.8×10⁻⁹) the levels of 5 proteins (ARHGEF25, INHBC, LRIG3, PREP in cis and DCUN1D1 in trans; Supplementary Table 7) in blood plasma using the deCODE28 dataset (but none in the SCALLOP Consortium29 dataset). Finally, Polygenic Priority Score (PoPS)30-based mapping identified 7 unique genes, of which 4 were also defined as the nearest gene (Supplementary Table 8).
Combining all five elements of our variant-to-gene mapping strategy, 23 unique protein-coding genes were identified (Supplementary Figure 4), of which 8 were supported by at least two criteria (Figure 2). The 8 putative causal genes are BTBD11, INHBC, KCNIP4, L3MBTL4, NTSR1, PREP, VMA21 and XRCC6BP1, and their biological functions were explored through interrogating online databases31–33 and reviewing published literature (Supplementary Table 9). Prolyl Endopeptidase (PREP) is part of the RAAS, a physiological system which regulates multiple biological processes, including blood pressure and inflammation34, through the activity of two key enzymes, ACE and its homolog ACE2, which have opposing effects35. ACE converts angiotensin I to angiotensin II, while ACE2 degrades angiotensin I into angiotensin (1-7)35. PREP functions, alongside ACE2, as an angiotensin hydrolysing enzyme, and also metabolises other vasoactive peptides such as bradykinin36,37. Neurotensin Receptor 1 (NTSR1) is a mediator of the peripheral functions of the peptide hormone and central nervous system neurotransmitter, neurotensin38 which is also hydrolysed by ACE236,38. Additionally, NTSR1 is a positive regulator of γ-aminobutyric acid (GABA) secretion32. GABA is one of the main inhibitory neurotransmitters within the central nervous system, and has additional peripheral roles including anti-inflammation39. L3MBTL Histone Methyl-Lysine Binding Protein 4 (L3MBTL4) and Inhibin Subunit Beta C (INHBC) are both involved in the metabolism of glycoprotein hormones. L3MBTL4 also negatively regulates transcription through chromatin organisation and histone binding activity31 and, following evidence of association between L3MBTL4 and hypertension, in vivo analyses demonstrated that L3MBTL4 induces the proliferation and remodelling of vascular smooth muscle cells via MAPK pathway components, p38 and JNK, which results in hypertension40,41. As a member of the transforming growth factor (TGF)-beta protein superfamily, INHBC also has a role in SMAD protein signal transduction, and its expression in sensory neurons is required to suppress inflammatory pain42. Similarly, BTB Domain Containing 11 (BTBD11) is involved in SMAD protein signal transduction, and has been identified as an inhibitory interneuron-specific protein localised to the brain cortex and hippocampus and interacts with glutamatergic synapses43. Vacuolar ATPase assembly factor VMA21 (VMA21) is a chaperone for the assembly of lysosomal vascular ATPase31, and XRCC6 Binding Protein 1 (XRCC6BP1) is a metallopeptidase also involved in ATP synthase assembly, as well as DNA repair31. Beyond our novel findings, KCNIP4 (Potassium Voltage-Gated Channel Interacting Protein 4) is predominantly expressed in the brain32 and encodes an integral component of Kv4 channel complexes. These complexes have a role in the regulation of potassium ion transmembrane transport and neuronal excitability in response to changes in calcium concentrations31.
Genes identified by at least two variant-to-gene (V2G) mapping analyses based on 95% credible set variants with PIP >10% (refined credible set). Filled tiles denote gene identified by specific analysis. Genes identified by at least one refined credible set variant from fine-mapping of genome-wide significant loci in joint meta-analysis are highlighted bold, and nonbold if the fine-mapped locus was genome-wide significant in Stage 1 only (without representation in Stage 2).
*Genes identified by at least one mapping analysis with a refined credible set variant with PIP >50%. Abbreviations: CADD, Combined Annotation Dependent Depletion; eQTL, expression quantitative trait loci; PoPS, Polygenic Priority Score; pQTL, protein quantitative trait loci.
Genetic architecture, overlap and pleiotropic effects of associated variants
For each variant with the highest PIP per credible set, we performed a PheWAS of up to 1,913 UK Biobank-derived phenotypes using Deep-PheWAS44. Three out of the 8 variants were associated (false discovery rate [FDR] ≤0.01) with at least one trait (Supplementary Table 10). Aligning the effect direction to the allele conferring increased risk of ACEI-induced cough, rs6062847-T (NTSR1) was associated with increased risk of chronic dry cough (Supplementary Figure 5A), revealing a shared genetic determinant between ACEI-induced cough and chronic cough. Further, rs12827878-T (XRCC6CP1; INHBC) was associated with lower urate and urea levels (Supplementary Figure 5B), and rs56288233-T (VMA21) was associated with lower insulin-like growth factor 1 levels (Supplementary Figure 5C).
Utilising published GWASs results, we observed that the highest PIP variants per credible set also have genome-wide significant associations across other traits (Supplementary Table 11). Focussing on the novel findings, we found rs878033 (L3MBTL4) was in linkage disequilibrium (LD; r2 = 1.0) with rs403814-A which increased risk of both ACEI-induced cough and hypertension40.
Using LD-score regression (LDSC)45,46 and the UK Biobank European-only ACEI-induced cough analysis, we generated estimates of narrow sense SNP-heritability (h2) and calculated genetic correlation (rg) with chronic dry cough. The estimated h2 of ACEI-induced cough was 5.1% (SE 1.4%) and we found strong genetic correlation between ACEI-induced cough and chronic dry cough (rg = 0.56 [SE 0.15], Z-score = 3.78, p-value = 0.0002), further supporting genetic overlap with this phenotype.
Discussion
We present the largest multi-ancestry pharmacogenomic study of ACEI-induced cough to date, implicating genes involved in the nervous system and neurogenic inflammation and highlighting genetic overlap between ACEI-induced cough and chronic dry cough.
In a two-stage meta-analysis (UK Biobank23, EXCEED24 and eMERGE Network11), we identified 5 genome-wide significant sentinels in the joint Stage 1 and Stage 2 meta-analysis which were mapped to 6 protein-coding genes (INHBC, KCNIP4, L3MBTL4, NTSR1, PREP and XRCC6BP1), and a further 3 genome-wide significant sentinels from the Stage 1 analysis only, which were mapped to 2 additional genes (BTBD11 and VMA21). Only one of these 8 signals was previously described11 (rs1495509; KCNIP4), resulting in 7 novel signals and 7 novel mapped genes. The mapped genes are involved in biological processes including neuropeptide signalling, neuronal excitability, SMAD protein signal transduction, DNA repair, and regulation of transcription and ATP-dependent activity. We also observed a strong genetic correlation with chronic dry cough and a PheWAS of rs6062847-T, which mapped to NTSR1, showed significant associations which chronic cough phenotypes, highlighting shared genetic determinants between these traits.
We find five genes which encode proteins with important neurological functions. PREP is involved in the mediation of neuropeptide activity, including the metabolism of bradykinin36,37. Bradykinin is known to target airway C-fibres, and has been shown to sensitise airway sensory nerves and induce cough reflex hypersensitivity in an animal model47,48. Beyond the implication of NTSR1 in the mediation of proinflammatory peptide, neurotensin, NTSR1 is also known to be involved in airway smooth muscle contraction49,50. It is also a positive regulator of the secretion of GABA, an inhibitory neurotransmitter with anti-inflammatory activity32. Animal models51,52 and controlled trials53,54 have demonstrated that agonists to GABA receptors inhibit the cough reflex; specifically, baclofen has been shown to supress ACEI-induced cough55. Further, INHBC is expressed in the nervous system and is known to suppress inflammatory pain responses42 and current evidence demonstrates the role of BTBD11 in regulating glutamatergic synapse function43. Also, combined with additional support from previous genomic studies11, in vitro and in vivo studies56 of KCNIP4 activity provide evidence for the role of neuronal potassium channels in smooth muscle reactivity and cough reflex modulation, and also suggest that they are a promising target for antitussive therapies57. In summary, we provide supporting evidence for the most widely accepted hypothesis of this adverse drug reaction (ADR), which suggests the mechanism is due to bradykinin-induced sensitivity of airway sensory nerves following the accumulation of bradykinin upon ACE inhibition5,12. We also highlight the roles of other inflammatory mediators, including neurotensin and GABA, as well as regulators of neuronal excitability, in airway sensitivity and cough reflex modulation.
In this study, we have used EHRs to define a proxy phenotype for ACEI-induced cough using an ACEI to ARB switch. In the eMERGE Network GWAS11 (Stage 2), ACEI-induced cough was defined using the EHR allergy section. Although this was a more direct phenotyping approach using a confirmed diagnosis of cough as a reaction to an ACEI, we replicated the KCNIP4 signal identified at genome-wide significance, with very comparable effect sizes, even when considering Stage 1 only; this provides a good indication that the proxy phenotype appropriately captured ACEI-induced cough. Our genome-wide discovery (Stage 1) included more than three times the number of cases than the largest previous study11. This powerful design allowed us to identify 7 additional variant-phenotype associations, 4 of which independently replicated in Stage 2.
We did not replicate any of the genome-wide significant variants identified in a different published GWAS study of ACEI intolerance21 at a Bonferroni-corrected p-value threshold. Although our phenotyping strategy was aligned to that of Mahmoudpour et al21, the associated variants, which implicated genes including GABRG2, MBOAT1 and RBFOX3, were from a discovery-only analysis which was likely underpowered, with almost six times fewer cases than our Stage 1 analysis.
Pharmacogenomic studies are often limited by small sample sizes58 which presents a challenge for the discovery of genomic loci associated with pharmacological traits. Since data on drug response and ADR-related traits are rarely specifically recorded in study populations, we have harnessed the large-scale resource of EHRs to characterise ACEI-induced cough by examining drug switches from ACEI to ARB. After cough, the most probable alternative reason for a switch of this kind is angioedema. Although observed in fewer than 1% of ACEI users, angioedema is the most severe side effect and is potentially fatal59. However, we did not observe a significant difference in angioedema diagnoses between cases and controls, and its overall rare prevalence makes it unlikely to have an effect on genome-wide association statistics.
We also note limitations of this study. We acknowledge that EHR data are not optimised for research and may contain sources of error, incompleteness and bias60. Any resulting misclassification of cases and controls will tend to reduce statistical power for discovery of genetic associations. In UK Biobank we observed that only approximately 12% of individuals defined as cases had a clinical coded record of an ACEI-related ADR or allergy, consistent with previous findings from UK clinical practice61. In this context, ADR definitions which are not susceptible to clinician-dependent sources of error62 are valuable, such as the coded prescription data we utilised as an ADR indicator. The sample sizes of non-European ancestry cases and controls available to us were modest, and the findings were largely driven by the European ancestry participants. European-bias presents as an important issue for many GWASs63 and highlights the need for the recruitment of ancestrally diverse individuals to longitudinal population studies with linked EHRs.
In conclusion, using our EHR-based phenotype definition, we have performed the largest pharmacogenomic analysis of ACEI-induced cough to date, and identified novel putative causal variants and genes. We have provided genetic evidence of a shared pathophysiological mechanism between ACEI-induced cough and chronic dry cough, which we have shown to have a neurological basis involving inflammatory factors. Aside from providing mechanistic insights and highlighting potential shared drug targets, we have also identified candidates for predictive variants for future pharmacogenomic-guided prescribing practices to avoid reactive drug switching upon occurrence of an ADR. This has the potential to enhance drug safety and efficacy and improve patient outcomes.
Methods
Study populations
UK Biobank is a large longitudinal study in the UK, described extensively elsewhere23. With relevance to the present study, roughly 230,000 participants have linked primary care EHRs as well as genomic data on over 90 million variants through imputation to Haplotype Reference Consortium64 and UK10K65 + 1000 Genomes Project66.
The EXCEED study24 is a population-based cohort study with participants recruited from Leicester, Leicestershire and Rutland. Approximately 5,000 participants have both EHR linkage and TopMed67-imputed genomic data for over 300 million variants.
Our two-stage meta-analysis study design (Supplementary Figure 1) included UK Biobank and EXCEED in Stage 1, and genome-wide summary statistics from the eMERGE Network study11 in Stage 2.
Use of EHRs for the phenotype definition and extraction of cohort characteristics
ACEI-induced cough was defined in primary care EHRs using a switch from an ACEI to an ARB as proxy phenotype. Specifically, cases were defined as individuals who switched from an ACEI to an ARB within 12 months of the date of their first ACEI prescription (defined as the index date) and did not receive a further ACEI prescription in the year after the switch date. Controls were defined as individuals who received at least one further ACEI prescription and no ARB prescriptions within 12 months after index date. Individuals were excluded if they had less than 2 years of complete data (defined as the duration of time between index date and either record extraction, or date of death, whichever occurred first) or received an ARB prescription before, or on the same date as, the index date.
ACEI and ARB prescription records were identified using a search-based strategy for UK Biobank (data providers 1,2 and 3) using a curated list of generic and brand name drugs based on the British National Formulary (BNF), dictionary of medicines and devices (dm+d) and Read v2 codes for each respective drug (Supplementary Table 12). For UK Biobank (data provider 4) and EXCEED, Read v2 codes were used to extract ACEI and ARB prescription events (Supplementary Table 13).
For descriptive analyses, clinical records for cough, ACEI-related ADR and allergy, and angioedema were extracted using the Read v2 and v3 code lists in Supplementary Table 14.
Sample cohort characteristics
Statistical tests for differences between cases and controls for a number of variables were performed using either a Chi-square test of independence (categorical variables) or t-test (continuous variables).
Genetically-determined ancestry was defined using k-means clustering of the first two genetic principal components (PCs)68; for UK Biobank participants, these were provided by UK Biobank, for EXCEED participants these were calculated using EIGENSOFT. Ancestry groups were defined as African, East Asian, European and South Asian; per-ancestry sample sizes are shown in Table 1and Supplementary Figure 1.
Genome-wide association meta-analyses
For each ancestral group in the Stage 1 studies, regenie (v1.0.6.2)69 was used to perform single-variant association testing. Genotyped variants with minor allele frequency (MAF) >5%, minor allele count (MAC) >100, genotype missingness <10%, Hardy-Weinberg equilibrium p-value >10−15 located outside regions of long-range LD were pruned using --indep-pairwise 1000 100 0.9 in PLINK 2.070 and used for model fitting. Imputed variants with imputation quality score ≥0.3, MACcases ≥10 and MACcontrols ≥10 were tested for association using an approximate Firth logistic regression model with age (at index date), age2, sex, genotyping array (UK Biobank only) and the first 10 genetic PCs fitted as covariates.
A two-stage meta-analysis approach (Supplementary Figure 1) was used for which all meta-analyses were performed using an inverse-variance weighted fixed effects model implemented in METAL71 with genomic control correction to account for residual population structure and relatedness. Stage 1 included all ancestry-specific summary statistics from UK Biobank and EXCEED, preserving variants represented by either (i) at least two cohort-ancestry combinations, or (ii) by only one cohort if the ancestral group was European. Stage 2 included summary statistics from a GWAS of ACEI-induced cough, defined using the allergy section of EHRs, in ancestrally diverse participants from the eMERGE Network11. The summary statistics from Stage 2 included 1.9M autosomal variants with an imputation quality score ≥0.7 and MAF ≥1%.
λGC was estimated as the ratio of the median of the observed Z-statistic distribution to the expected median for all individual analyses, and the Stage 1 meta-analysis, using R (v 4.1.0). Manhattan and quantile-quantile (QQ) plots were also generated using R (v 4.1.0) using the qqman package72.
Signal selection and joint meta-analysis
From the Stage 1 meta-analysis, genome-wide significant variants (p-value <5×10⁻⁸) were identified and sentinels defined as the variant with the lowest p-value within ±1Mb regions. Where possible, sentinels which did not have representation in Stage 2 were redefined with a suitable proxy, identified as the next most significant variant within the ±1Mb region (p-value <5×10⁻⁶ in Stage 1) present in Stage 2. For each genome-wide significant locus (defined as ±1Mb from each Stage 1 sentinel variant), secondary independent association signals were identified using conditional analysis implemented in GCTA-COJO73,74 using --cojo-cond on each sentinel variant with default settings. Individual-level genomic data from UK Biobank Europeans was used as an LD reference given it was the largest contributing cohort-ancestry group in each meta-analysis. Independent sentinel variants from Stage 1 were subsequently meta-analysed with Stage 2 to generate joint meta-analysis association statistics.
Further, for fine-mapping and variant-to-gene mapping purposes, a genome-wide meta-analysis of both stages which included ∼17.2M variants represented in either Stage 1 or Stage 2 was also performed.
Fine-mapping
Utilising summary statistics from the genome-wide meta-analysis of Stage 1 plus Stage 2, fine-mapping was performed on each locus with a genome-wide significant sentinel variant in either the joint meta-analysis, or in Stage 1 only if the sentinel variant was not represented in Stage 2.
PolyFun75-informed SuSiE76 was used to perform functionally-informed multi-variant fine-mapping of each autosomal locus. Functional prior causal probabilities specified by PolyFun were proportional to stratified LDSC (S-LDSC) heritability estimates based on the baseline-LF 2.2.UKB model, which includes variant annotations related to presence in coding regions, conservation, regulation, MAF and LD77–79. Pre-computed LD matrices based on unrelated British UK Biobank individuals were used as a reference. As PolyFun does not currently support X-chromosome analyses, the single-variant fine-mapping Wakefield80 method was used in this case, with the prior W set as 0.04 in the approximate Bayes factor formula. Both Bayesian methods were used to calculate 95% credible sets which were subsequently filtered for variants with PIP >10% to generate refined credible sets.
Variant-to-gene mapping
The refined credible sets variants (and where required, LD proxies with D’ >0.9) were used as the input for all gene mapping analyses to identify putative causal genes. The variant-to-gene mapping approach included: (i) identification of the nearest gene, (ii) variant annotation and pathogenicity estimates, (iii) eQTL analysis, (iv) pQTL analysis, and (v) PoPS.
(i) Nearest genes
Variants were annotated with nearest protein-coding gene within ±250kb using ANNOVAR81. The nearest genes were identified for positional mapping.
(ii) Variant annotation and pathogenicity estimates
Variants were annotated with functional consequence using ANNOVAR81, and with deleteriousness predictors (SIFT, PolyPhen-2 and CADD82) using Variant Effect Predictor83. The nearest genes to variants annotated as deleterious by SIFT, probably damaging or possibly damaging by PolyPhen-2 or with a CADD Phred score ≥12.37 were identified.
(iii) eQTL
The results of eQTL analyses from three datasets were investigated in FUMA v1.3.784: GTEx v825 (restricted to adrenal, artery, blood, brain, esophagus, heart, ileum, liver, lung, muscle, nerve, pituitary, spleen and stomach tissues), eQTLGen26 and BRAINEAC27. As little is known about the mechanism of ACEI-induced cough we included tissues involved in ACEI pharmacodynamics and pharmacokinetics, as well as tissues of the respiratory, cardiovascular and nervous systems. Variants with FDR <0.05 were defined as significant eQTLs. Only significant cis-eQTLs (i.e. within 1Mb of the gene with affected gene expression) in our refined credible sets were used to identify genes.
(iv) pQTL
The deCODE Genetics28 dataset, which includes 4,719 proteins measured by 4,907 aptamers, and the SCALLOP Consortium29 dataset, which includes 90 cardiovascular proteins, were investigated. To define a variant as a significant pQTL the same p-value thresholds were used as by the authors in the original publications, that is p-value <1.8×10⁻⁹ for deCODE Genetics and p-value <5×10⁻⁸ for the SCALLOP Consortium. Significant pQTLs were defined as cis-pQTLs if they were located within 1Mb of the transcription start site (TSS) of the gene encoding the measured protein or trans-pQTLs if they were located on a different chromosome, or more than 1Mb away from the TSS of the gene that encodes the measured protein. Only significant pQTLs in our refined credible sets were used to identify genes.
(v) PoPs
Finally, a similarity-based prioritisation method, PoPS30, which utilises genome-wide summary statistics (in this case, the genome-wide summary statistics from the Stage 1 plus Stage 2 meta-analysis) and genetic enrichments, including single-cell expression, biological pathways and protein-protein-interactions, was used to calculate gene-level associations and subsequently a priority score for all protein-coding genes. For this analysis, the European population from 1000 Genomes Project66 Phase 3 was used as an LD reference and the gene with the highest polygenic priority score within ±250kb of each variant was identified.
Genes supported by at least 2 out of the 5 criteria of the variant-to-gene mapping strategy were defined as putative causal genes, and database (GeneCards31, Open Targets Platform32 and Online Mendelian Inheritance in Man33 [OMIM]) and literature searches were used to retrieve information about their biological functionality.
Exploring pleiotropic effects of associated variants
Further follow-up analyses were performed on each variant with the highest PIP per credible set, calculated from fine-mapping of genome-wide significant loci in joint Stage 1 and Stage 2 meta-analysis, or in Stage 1 only (without representation in Stage 2).
Phenome-wide association study
The Deep-PheWAS44 pipeline was used to perform single-variant association testing with up to 1,913 phenotypes defined in UK Biobank individuals of European ancestry. These phenotypes included: (i) composite phenotypes defined using linked hospital data, primary care data and field-IDs, (ii) Phecode-based phenotypes, (iii) field-ID phenotypes, (iv) combined field-ID phenotypes (more than two quantitative field-ID phenotypes into a single measure), all generated using the phenotype matrix generation pipeline, and (v) formula phenotypes developed within the group.
Significant variant-trait associations had a Benjamini-Hochberg corrected FDR ≤ 0.01.
Database queries
Open Targets Genetics85 was queried to identify traits for which the highest PIP variants were in LD (r2 >0.8) with genome-wide significant lead GWAS variants. Open Targets Genetics includes published results from NHGRI-EBI GWAS Catalogue86 and UK Biobank phenotypes from Neale Lab Round 287 and The University of Michigan SAIGE analysis88.
Genetic architecture and overlap
Utilising the UK Biobank European-only summary statistics for ACEI-induced cough, we performed two LD score regression-based analyses using LDSC45,46; (i) SNP-heritability, and (ii) genetic correlation with chronic dry cough, defined in UK Biobank. Both analyses utilised LD Scores pre-computed from 1000 Genomes Europeans, and all summary statistics were filtered for the HapMap3 variants.
Genetic correlation traits
Chronic dry cough was defined using a combination of UK Biobank field-IDs 22502 (‘cough on most days’) and 22504 (‘bring up phlegm/sputum/mucus on most days’), as in the PheWAS. The chronic dry cough GWAS included 102,941 individuals (8,388 cases; 94,553 controls) of European ancestry and was performed using regenie (v1.0.6.2)69 (as above) using an approximate Firth logistic regression model adjusted for age, age2, sex, ever smoking status, genotyping array, and the first 10 genetic principal components.
Resource availability
Lead contact
Further information and requests should be directed to the lead contact, Chiara Batini (cb334{at}leicester.ac.uk).
Materials availability
This study did not generate new materials.
Data Availability
UK Biobank (https://www.ukbiobank.ac.uk/enable-your-research/apply-for-access) and EXCEED (https://exceed.org.uk/research/) individual-level data are available to approved researchers upon application or data access request. GWAS summary statistics from the eMERGE Network study (Stage 2) are available from the respective study authors. GWAS summary statistics from the discovery (Stage 1) analysis are being deposited at the NHGRI-EBI GWAS Catalog (https://www.ebi.ac.uk/gwas/) and accession numbers will be added as soon as they are available. The phenotyping algorithm is publicly available (https://doi.org/10.5281/zenodo.6780065); scripts used to run additional analyses are available upon request to the lead contact.
Data and code availability
UK Biobank (https://www.ukbiobank.ac.uk/enable-your-research/apply-for-access) and EXCEED (https://exceed.org.uk/research/) individual-level data are available to approved researchers upon application or data access request. GWAS summary statistics from the eMERGE Network study (Stage 2) are available from the respective study authors. GWAS summary statistics from the discovery (Stage 1) analysis are being deposited at the NHGRI-EBI GWAS Catalog (https://www.ebi.ac.uk/gwas/) and accession numbers will be added as soon as they are available. The phenotyping algorithm is publicly available (https://doi.org/10.5281/zenodo.6780065); scripts used to run additional analyses are available upon request to the lead contact.
Author contributions
Conceptualization: MDT and CB; Methodology: KC, DJS, MDT and CB; Software: KC and RCF; Validation: KC; Formal Analysis: KC and RP; Investigation: KC, MDT and CB; Resources: DJS, RP, CJ, RCF, EJH, LVW and MDT; Data Curation: KC, CB; Writing – Original Draft: KC, MDT and CB; Writing – Review & Editing: all authors; Visualization: KC; Supervision: MDT and CB; Funding Acquisition: EJH, LVW and MDT.
Declaration of interests
RP and CJ report funding from Orion Pharma outside of the submitted work. LVW has held research grants from GlaxoSmithKline (as principal investigator) and Orion Pharma (as co-investigator), unrelated to current work, and reports consultancy for Galapagos. MDT has research collaborations with Orion Pharma and GlaxoSmithKline unrelated to the current work.
Acknowledgements
We thank all cohort study participants from UK Biobank and EXCEED who have made this project possible. We also thank authors of the eMERGE Network study for sharing GWAS summary statistics for use in this project. The UK Biobank genetic and phenotypic data were obtained under UK Biobank Application 59822. This study used the ALICE and SPECTRE High Performance Computing Facilities at the University of Leicester.
KC was supported by the University of Leicester (College of Life Sciences) and Health Data Research UK. CJ held a Medical Research Council Clinical Research Training Fellowship (MR/P00167X/1). LVW holds a GSK/Asthma + Lung UK Chair in Respiratory Research (C17-1). MDT holds a Wellcome Trust Investigator Award (WT202849/Z/16/Z), which has partially supported EXCEED, and NIHR Senior Investigator Award (NIHR201371). CB was supported by a UKRI Innovation Fellowship at Health Data Research UK (MR/S003762/1).
This study used data from the Extended Cohort for E-health, Environment and DNA (EXCEED) study. EXCEED is supported by the University of Leicester, the National Institute for Health and Care Research (NIHR) Leicester Respiratory Biomedical Research Centre, the Wellcome Trust (WT 202849), and Cohort Access fees from studies funded by the Medical Research Council (MRC), Biotechnology and Biological Sciences Research Council, NIHR, the UK Space Agency, and GlaxoSmithKline. It was previously supported by MRC grant G0902313. EXCEED is supported by BREATHE - The Health Data Research Hub for Respiratory Health (UKRI_PC_19004) in partnership with SAIL Databank. BREATHE is funded through the UK Research and Innovation (UKRI) Industrial Strategy Challenge Fund and delivered through Health Data Research UK. The research was partially supported by the NIHR Leicester Biomedical Research Centre and the NIHR Nottingham Biomedical Research Centre; views expressed are those of the author(s) and not necessarily those of the NHS, the NIHR or the Department of Health. This research was funded in whole, or in part, by the Wellcome Trust. This work was supported by the University of Leicester and Health Data Research UK, an initiative funded by UKRI, Department of Health and Social Care (England) and the devolved administrations, and leading medical research charities.
For the purpose of open access, the author has applied a CC BY public copyright licence to any Author Accepted Manuscript version arising from this submission.
Footnotes
↵5 Lead contact
References
- 1.↵
- 2.↵
- 3.↵
- 4.↵
- 5.↵
- 6.↵
- 7.↵
- 8.↵
- 9.↵
- 10.↵
- 11.↵
- 12.↵
- 13.↵
- 14.
- 15.
- 16.
- 17.
- 18.
- 19.
- 20.↵
- 21.↵
- 22.↵
- 23.↵
- 24.↵
- 25.↵
- 26.↵
- 27.↵
- 28.↵
- 29.↵
- 30.↵
- 31.↵
- 32.↵
- 33.↵
- 34.↵
- 35.↵
- 36.↵
- 37.↵
- 38.↵
- 39.↵
- 40.↵
- 41.↵
- 42.↵
- 43.↵
- 44.↵
- 45.↵
- 46.↵
- 47.↵
- 48.↵
- 49.↵
- 50.↵
- 51.↵
- 52.↵
- 53.↵
- 54.↵
- 55.↵
- 56.↵
- 57.↵
- 58.↵
- 59.↵
- 60.↵
- 61.↵
- 62.↵
- 63.↵
- 64.↵
- 65.↵
- 66.↵
- 67.↵
- 68.↵
- 69.↵
- 70.↵
- 71.↵
- 72.↵
- 73.↵
- 74.↵
- 75.↵
- 76.↵
- 77.↵
- 78.
- 79.↵
- 80.↵
- 81.↵
- 82.↵
- 83.↵
- 84.↵
- 85.↵
- 86.↵
- 87.↵
- 88.↵


