
Abstract
Immune waning is key to the timely anticipation of COVID-19 long-term dynamics. We assess the impact of periodic vaccination campaigns using a compartmental epidemiological model with multiple age structures and parameterised using empiric time-dependent vaccine protection data. Despite the inherent uncertainty, we show that vaccination on its own, especially if restricted to individuals over 60 years old, seems insufficient to prevent a large number of hospital admissions.
Introduction
From the beginning, Covid-19 pandemic management had to deal with numerous unknowns and strongly relied on mathematical modelling to guide the implementation of non-pharmaceutical interventions (NPIs). The rapid discovery and implementation of efficient vaccines led to the hope that public health policy planning could soon return to normal. However, long-term forecasts are difficult because vaccine protection has been reported to decrease with time [UKHSA, 2022]. Furthermore, the emergence of variants of concerns (VOC) raises major concerns regarding epidemic management. This is particularly true for lineages from the Omicron variant that exhibit strong immune escape properties.
The waning of immune protection is challenging to capture with classical compartmental models because it implies an exponential increase in the number of model compartments, which makes parameterization arbitrary. We extend a non-Markovian approach [Reyné et alii, 2022], that readily accounts for the time spent in each compartment. By using published data, we explore long-term epidemic dynamics in a qualitative way. In our scenarios, we account for immunity waning as well as Omicron-specific phenotypic traits and compare four vaccination campaign strategies.
An epidemiological model with time structures
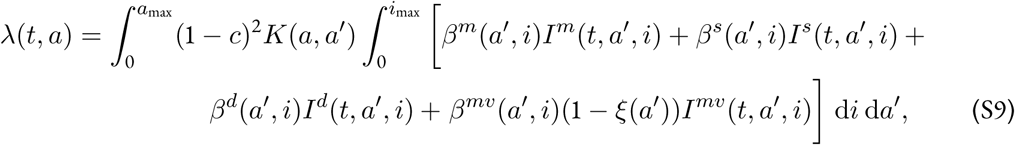
We analyse an epidemiological compartmental model (Figure 1A) in which susceptible individuals of age a (the density of which is denoted Sa) can either become fully vaccinated (Va), or contract a mild  or severe infection
  . Mildly-infected individuals always recover and move to the compartment Ra. Both recovered and vaccinated individuals can be (re)infected, but at a reduced rate compared to susceptible individuals. If this (re)infection is mild, individuals move to a separate compartment
  to account for a potential immunity-induced reduction in infectiousness. Vaccinated and recovered individuals may be (re)vaccinated and move to the booster compartment (Ba), where their protection increases. Finally, severely infected
  and previously immunised mildly infected individuals
  also end up in the booster compartment upon recovery. Overall, the boosted compartment consists of individuals with booster vaccination dose(s), two natural infections, one vaccination and one infection, or having recovered from a severe infection.
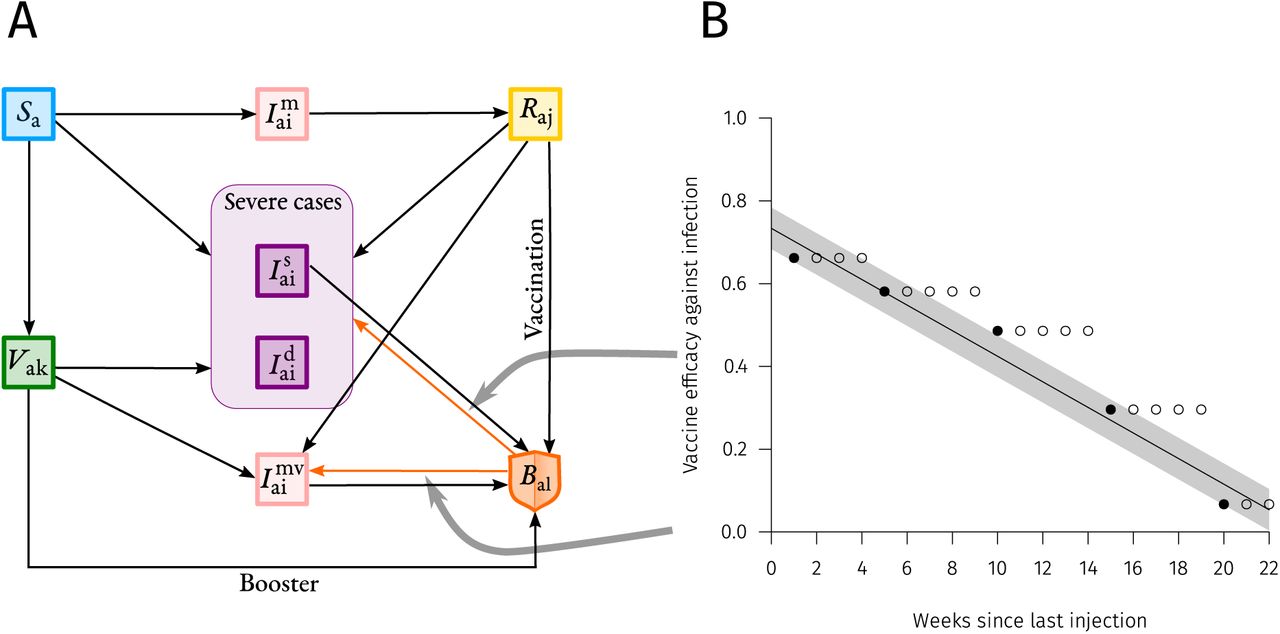
Arrows show transitions between compartments. Sa stands for Susceptible individuals of age 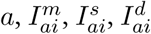 and
and  stand respectively for mildly/severely/severely-that-will-die/mildly-partly-immune infected individuals of age a infected since i days, Vak stands for Vaccinated individuals of age a vaccinated k days ago, Raj stands for Recovered individuals of age a that cleared the disease j days ago and finally Ba𝓁 stands for individuals of age a that received a booster vaccine dose 𝓁 days ago. Orange arrows show some of the transitions that depend on the time spent in the compartment (here 𝓁 days) that are parametrized through real immune waning data shown on panel B. B. Immunity waning implementation. Dots corresponds to real data from UKHSA [2022] for the Pfizer/BioNTech vaccine (BNT162b2) after a booster dose. The lines correspond to the baseline of the immunity decrease model implementation and the shaded areas to the uncertainty used within the sensitivity analysis. Here, we show the protection against an Omicron VOC infection for individuals that received a booster dose.
The model records the time spent by the individuals in each compartment. Knowing the time since vaccination (k) for vaccinated individuals, the time since clearance (j) for recovered individuals, and the time since the entry into the booster compartment (l), allows us to readily account for the waning in immune protection.
This model is based on a system of partial differential equations (Appendix S3). Its parameterization reflects the French epidemic and the Omicron VOC (Table S1) [Sofonea et alii, 2022].
Contact rates were allowed to vary with time and were fitted using the hospital admissions time series up to May, 6th 2022. Following a parsimony principle, we used the last fitted value as the baseline until the rest of the simulations, since spontaneous or policy-induced behavioural changes are unpredictable.
External factors, such as the weather, are known to impact transmission dynamics [Ma et alii, 2021]. We include this seasonality by assuming sinusoidal variations such that in summer the contact rate is decreased to –10% and increased by +10% in the winter.
For each parameter, we indicate the default value used, the range in the sensitivity analyses, and the references.
Immune waning
In contrast to earlier models, we could calibrate immunity waning using epidemiological data UKHSA [2022]. More precisely, we used time series of vaccine protection (whether initial doses or boosters) against both symptomatic disease and hospitalisation, for both Delta and Omicron VOC. We fitted linear models on the different time series (Figure 1B).
Vaccination campaign scenarios
All vaccinated individuals are assumed to receive a booster dose 6 months after entering the vaccinated (Va) compartment. Then, we investigate four different scenarios.
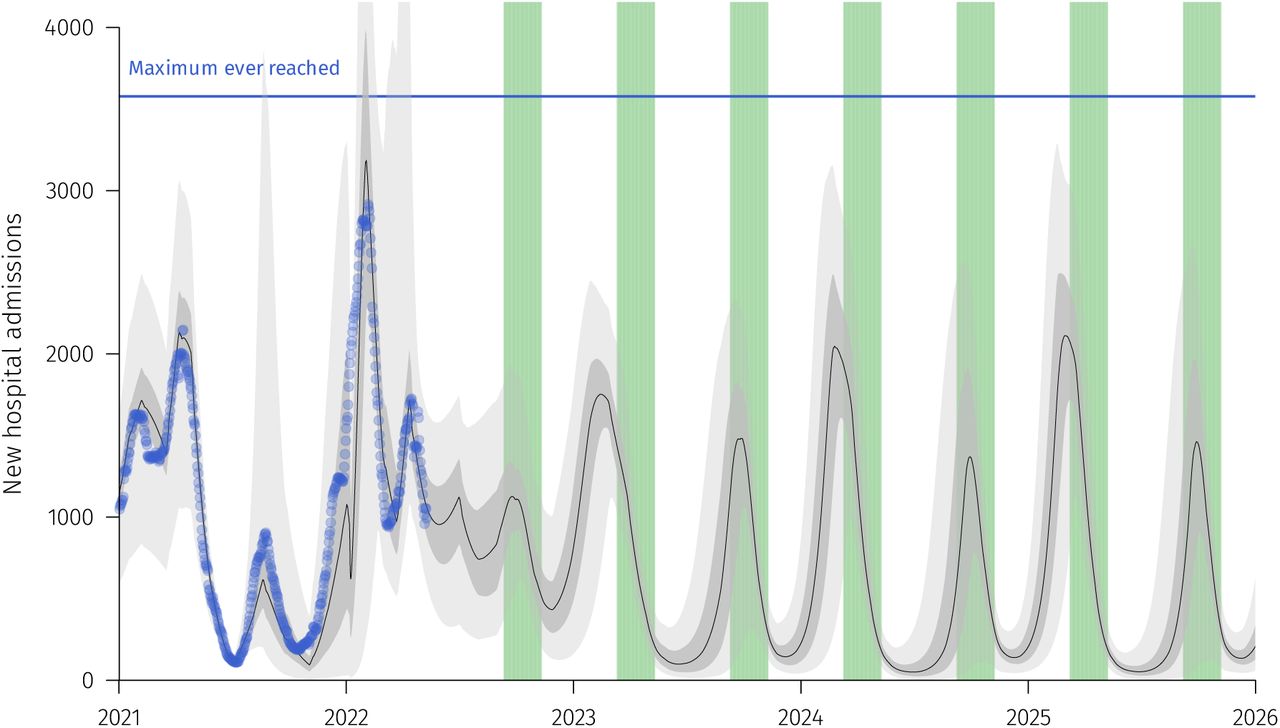
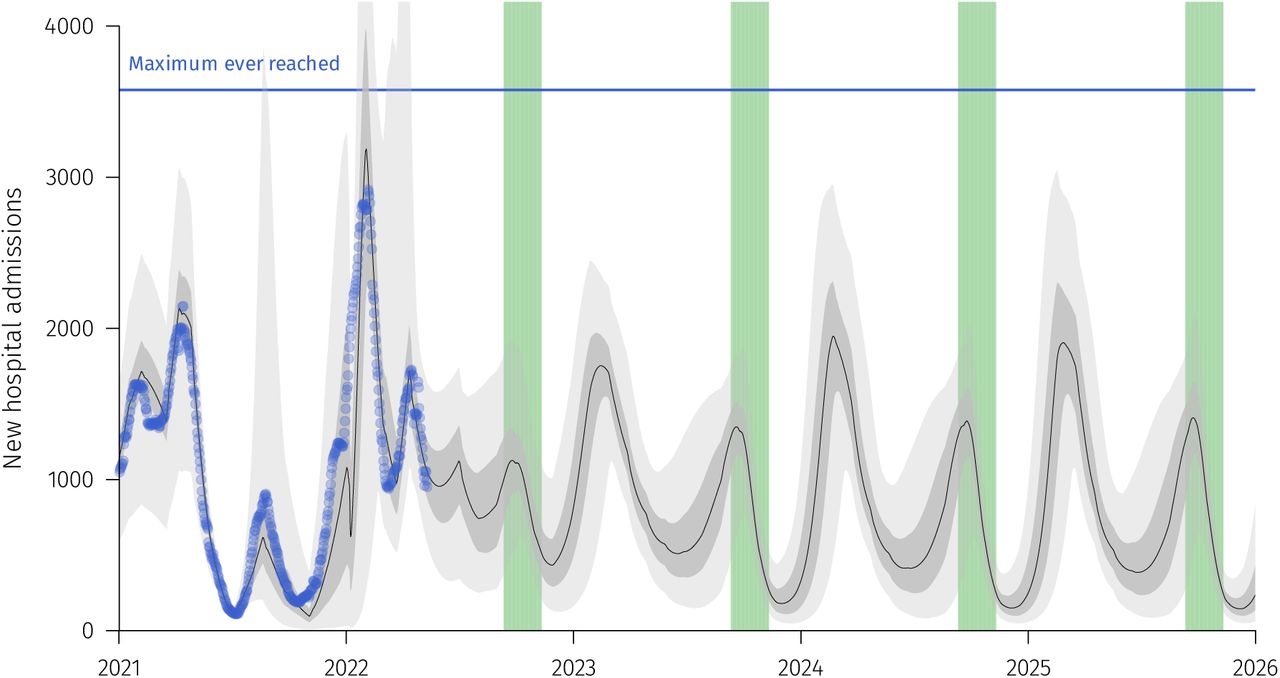
In Scenario A, boosted individuals are not vaccinated again. This leads to a high level of daily hospital admissions (Figure 2A) with yearly oscillations attributable to seasonality.

Blue dots corresponds to real data and green shaded areas to vaccination campaigns periods. The four panels correspond to scenarios without additional booster (A), with an annual vaccination campaign in September-October for every individuals above 60 y.o. (B), an annual vaccination campaign in September-October for the whole population (C), and bi-annual vaccination campaign for the whole population (in September-October and in March-April).
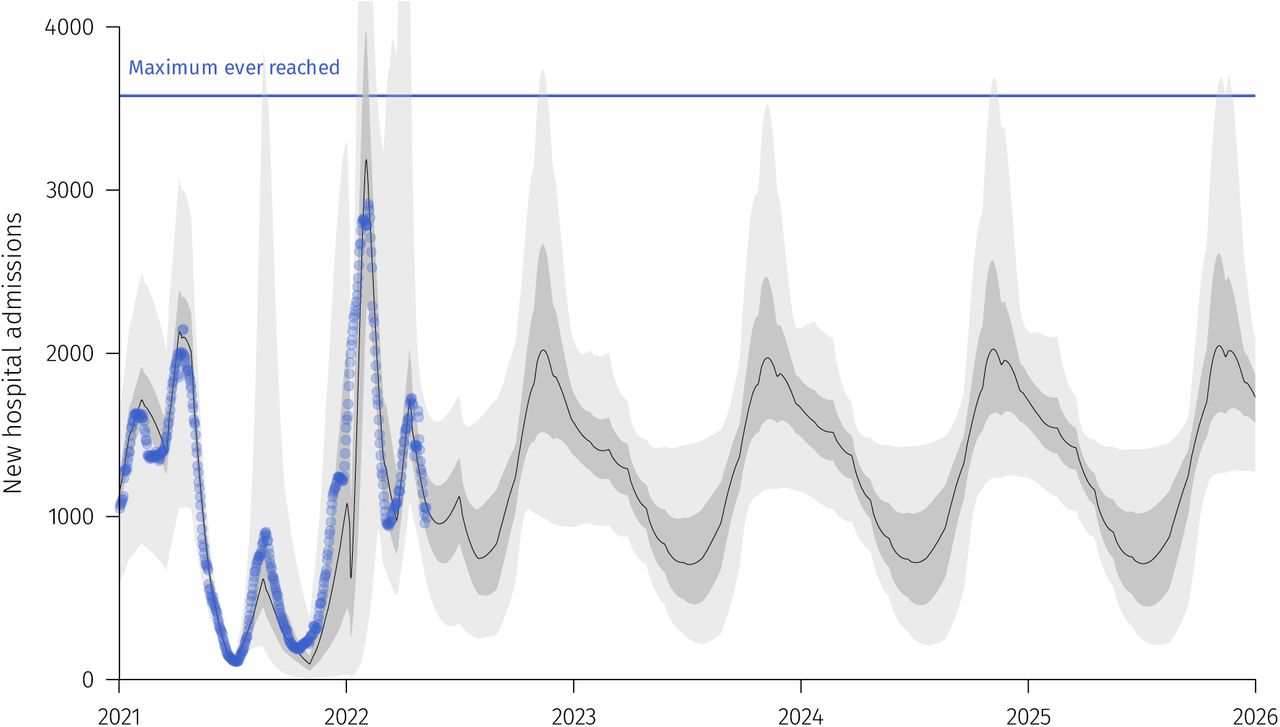
Scenario B consists in implementing annual vaccination campaigns before winter (in September and October) but only for individuals above 60 years old. This improves the overall situation compared to not vaccinating but the median number of hospital admissions always remains above 500 per day (Figure 2B).
Third, we extend the yearly vaccination campaign to all the population (Figure 2C). This further lowers the number of daily hospital admissions and it also yields an epidemic wave in the early spring.
Finally, the fourth scenario assumes two national vaccine campaigns per year (in September – October and in March – April) for all the population (Figure 2D). This lowers the number of daily hospital admissions even further but it does not prevent two marked epidemic waves per year.
Figure 3 shows the annual total number of hospital admissions for each scenario. As expected, the more the people are vaccinated, the more the daily hospital admissions lower.

Blue line corresponds to real data for 2021. The four type of boxplots correspond to scenarios without additional booster (A), with an annual vaccination campaign in September-October for every individuals above 60 y.o. (B), an annual vaccination campaign in September-October for the whole population (C), and bi-annual vaccination campaign for the whole population (in September-October and in March-April).
Discussion
COVID-19 management will now face the challenge of post-infection and post-vaccination immune waning combined with the emergence risk of new VOCs. We investigated the behaviour of long-term epidemiological dynamics, assuming periodic vaccination campaigns over the next three years.
Long term scenarios are obviously extremely uncertain but they can provide valuable insights. Also in the French context, Bosetti et alii [2022], tried to determine under what booster administration and NPIs implementation a new epidemic could be contained. However, their work was done before the Omicron phenotypical traits were known, and only on a six-month horizon. Regarding long-term dynamics, Kissler et alii [2020] investigated the potential effects of the seasonality observed in other epidemics than that of SARS-CoV-2. They highlighted the need for NPIs, but their results were obtained before vaccine implementation and the emergence of the different VOCs. Finally, Saad-Roy et alii [2021] studied different vaccine administration patterns for several scenarios of immunity duration, but it was done at the time there was no data on immune protection waning.
Leaning on immune protection data, we show that immune waning may cause yearly epidemic hospitalization peaks comparable to the largest one seen in 2021. Vaccination appears to mitigate this impact. However, vaccination itself seems insufficient to suppress the epidemic.
These results should be taken with caution due to the numerous sources of uncertainty (Appendix S1). In particular, comparisons should be restricted to our four scenarios that share the same core assumptions.
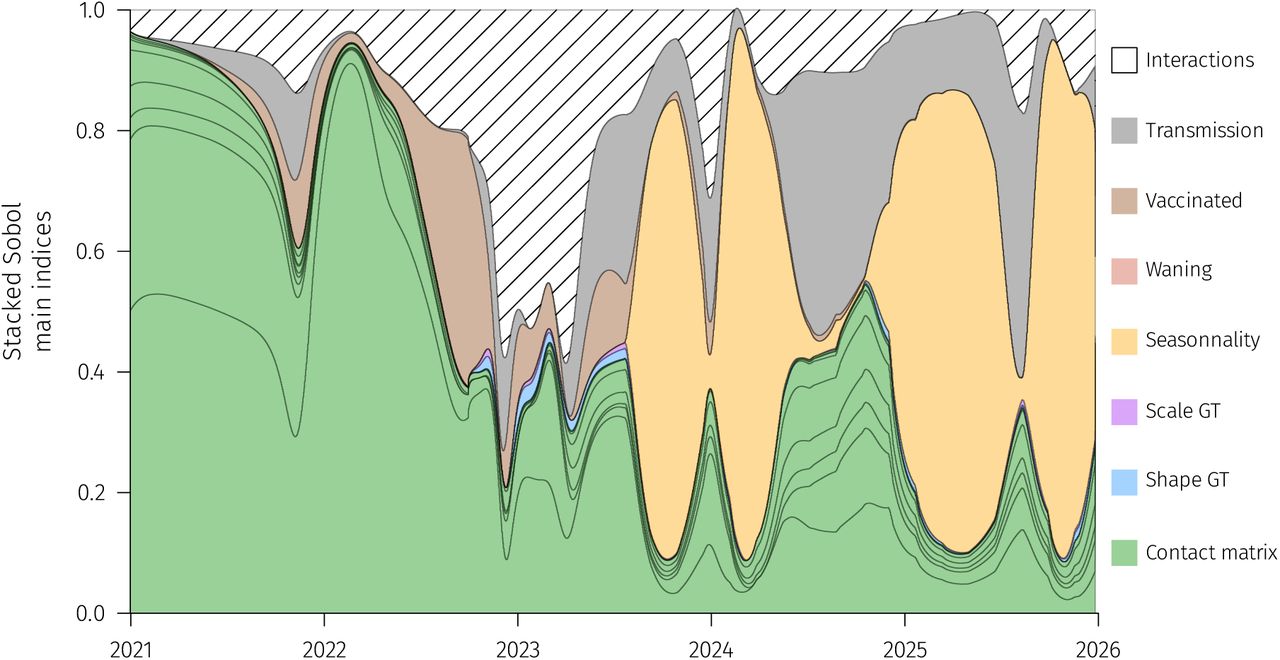
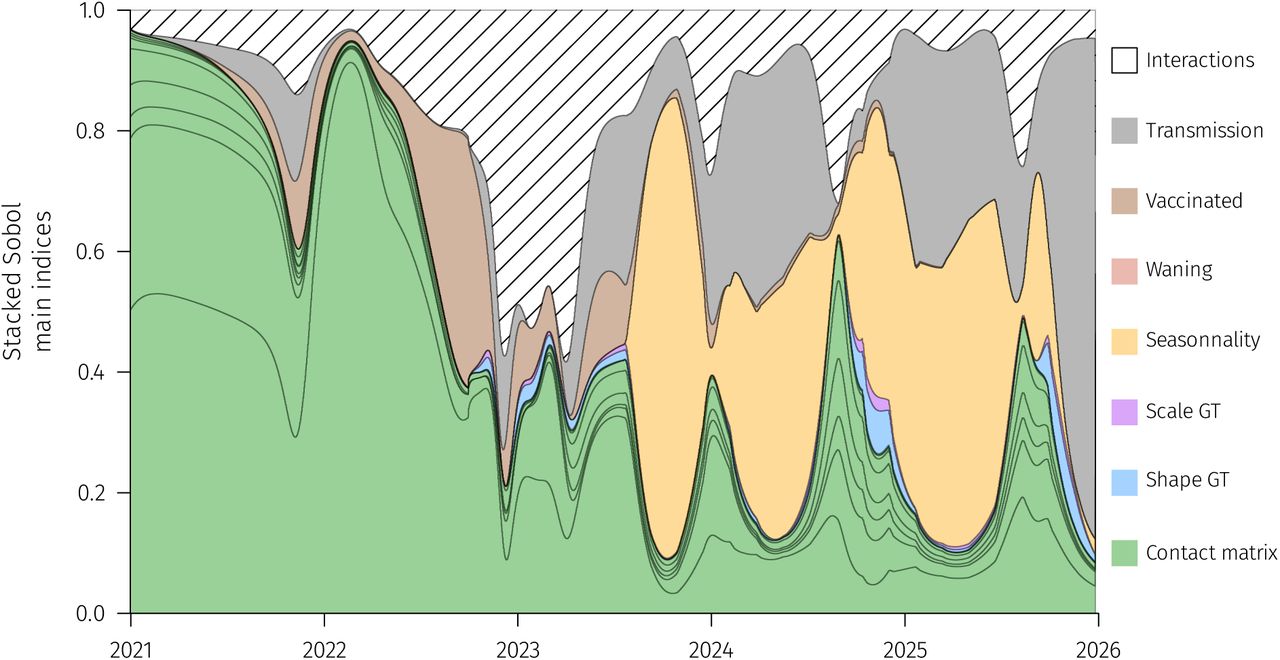
The sensitivity analyses (Appendix S2) highlight the main sources of uncertainty. As discussed by Reyné et alii [2022], the uncertainty mostly originates from factors that are difficult to predict such as the time-varying contact matrix or the potential seasonality. Regarding virus-related model parameters, the reduction in contagiousness due to immunity, which is difficult to estimate [Bosetti et alii, 2022; Prunas et alii, 2022], contributes to most of the variance in the model output.
Finally, we assumed that the intensity of non-pharmaceutical interventions will remain identical to that enforced in early spring 2022. This discards any changes in government policies that would probably be required since vaccination on its own is unlikely to be sufficient to avoid a strong burden for hospitals in terms of COVID-19 admissions. Future work is required to identify the optimal balance between vaccination campaigns and other types of NPIs such as improving indoor air quality or mask-wearing.
Data Availability
The scripts are available on demand.
S1 Supplementary results
Blue dots corresponds to real data. The black line correspond to the median trajectory. Lighter shaded area correspond to the 95% confidence interval while the darker area correspond to the interquartile range. The horizontal blue line indicates the highest national incidence in hospital admissions reached during the first COVID-19 wave in France.
Green shaded areas correspond to vaccination campaigns periods for individuals above 60 y.o. See Figure S1 for additional details.

See Figure S2 for additional details.
See Figure S2 for additional details.
S2 Sensitivity analysis

The graphs shows the origin of the variance captured by each model parameter using Sobol indices (see Reyné et alii, 2022 for methodological details). A large part of the variations originates from the unknowns in the contact matrix between ages, as in Reyné et alii, 2022. The magnitude of seasonality also matters for the long-term trends, as well as the transmission rate (i.e. the intensity of the NPIs).
See for details.

See for details.

See for details.
S3 Model equations
The model partial differential equations system is given by:


 with
with
 for any (t, a, i, j, k) ∈ ℝ+ × [0, amax] × [0, imax] × [0, jmax] × [0, kmax].
The parameter notations are the following:
ρ is the vaccination rate,
γm,s the recovery rates for respectively mildly and severely infected individuals,
μ is the death rate,
εR,V,B the immunity-induced reduction of risk of infection for individuals respectively in the R, V and B compartments,
c the intensity of NPI policy,
K(a, a′) the contact matrix coefficient between age groups a and a′,
βm,s,d,mv the generation time distributions, and
ξ the immunity-induced reduction in transmission (for ‘breakthrough’ infections).
The previous system is coupled with the following boundary conditions:


 where
where
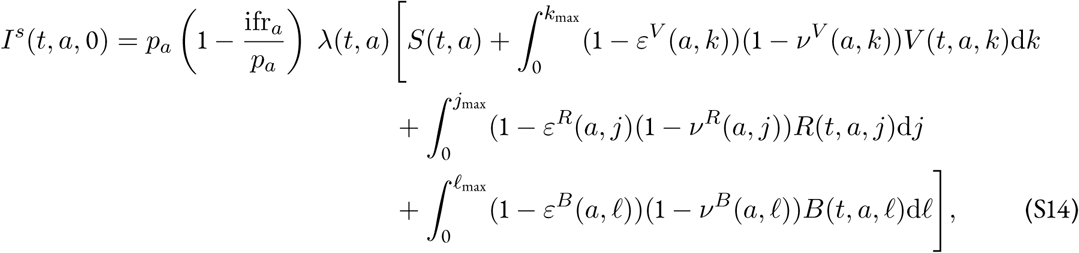
pa is the probability of developing a severe form,
ifra is the infection fatality rate, and
νV,R,B is the immunity-induced reduction of virulence for individuals respectively in the R, V, and B compartments.
S4 Omicron related parameters and vaccine efficacy
Regarding the omicron generation interval, we used the data provided by UKSHA [2022]. In particular, we fitted different Gamma distributions on the non-parametric data available. We tested different parameters combinations for the Gamma distribution to explore a range of generation time distributions that reflect the epidemiology of both BA.1 and BA.2 variants. In Figure S9, we show a subset of these Gamma distributions explored within the sensitivity analysis.
Regarding the parameterisation of vaccine effectiveness, we used data provided by the UKHSA [2022] report (https://assets.publishing.service.gov.uk/government/uploads/system/uploads/attachment_data/file/1070356/Vaccine-surveillance-report-week-16.pdf). The raw data was not available so we used the online tool WebPlot Digitalizer (https://apps.automeris.io/wpd/) to retrieve the values. For simplicity, we assumed that individuals received the Pfizer/BioNTech (BNT162b2) vaccine, which was the most widespread in France. We fitted linear models on vaccine effectiveness against symptomatic disease and hospital admissions for the Delta and Omicron VOC. Note that the intrinsic virulence of Omicron is assumed to be divided by 3 (parameter pa in the model) compared to Delta following UK data Nyberg et alii, 2022.

Shaded areas data originate from the UKSHA [2022] report. The lines correspond to a subset of the Gamma distributions used in the sensitivity analysis. The thicker line corresponds to the baseline Gamma distribution.
In the sensitivity analysis, we included variations in vaccine protection against symptomatic disease and against hospitalization risk. We used the linear model best fit as our baseline and generated variation by applying a coefficient to the intercept spanning from −0.05 to 0.05 (Figure 1B).
The reduction of transmission (in so-called ‘breakthrough’ infections) was assumed to be of 50% for vaccinated individuals, as in others modelling works [Bosetti et alii, 2022]. This reduction in transmission was also applied to recovered people that got reinfected.
S5 Model parameters with sensitivity analyses ranges
We show in Table S1 the baseline for the different parameters and the range used for parameters included in the sensitivity analysis. Several parameters were not included in the sensitivity analysis, as they already were included in that in Reyné et alii [2022]. We expect these earlier results to hold and these parameters have limited relevance in the contact of the Omicron epidemic.
For each parameter, we indicate the default value used and the references used.
Acknowledgements
The authors acknowledge the ISO 9001 certified IRD i-Trop HPC (South Green Platform) at IRD Montpellier for providing HPC resources that have contributed to the research results reported within this paper. We thank all the ETE modelling team for discussions and apologize to Baptiste Elie for that reckless rm -r *. BR is funded by the Ministère de l’Enseignement Supérieur et de la Recherche.
References


