
Abstract
The offering of grocery stores is a strong driver of consumer decisions, shaping their diet and long-term health. While processed food has been increasingly associated with unhealthy diet, information on the degree of processing characterising an item in a store is virtually impossible to obtain, limiting the ability of individuals to make informed choices. Here we introduce GroceryDB, a database with over 50,000 food items sold by Walmart, Target, and Wholefoods, unveiling the degree of processing characterizing each food. GroceryDB indicates that 73% of the US food supply is ultra-processed, and on average ultra-processed foods are 52% cheaper than minimally-processed alternatives. We find that the nutritional choices of the consumers, translated as the degree of food processing, strongly depend on the food categories and grocery stores. We show that there is no single nutrient or ingredient “bio-marker” for ultra-processed food, allowing us to quantify the individual contribution of over 1,000 ingredients to ultra-processing. GroceryDB and the associated http://TrueFood.Tech/ website make this information available, aiming to simultaneously empower the consumers to make healthy food choices, and aid policy makers to reform the food supply.
Introduction
Food processing has drastically increased productivity and shelf-time, and decreased the cost of food, ultimately helping humanity to fight famine [1, 2]. Yet, there is increasing evidence that our over-reliance on ultra-processed food has fostered unhealthy diet [3, 4]. Indeed, recent studies have linked the consumption of ultra-processed food to non-communicable diseases like metabolic syndrome [5–11], and exposure to industrialized preservatives and pesticides [12–17]. Currently, in developed nations, up to 60% of consumed calories come from ultra-processed foods [18, 19]. Much of this food reaches consumers through grocery stores, offering an abundance of ultra-processed food choices. Indeed, in 2020 the average number of items carried by a US grocery store reached 31,119 [20]. Given the high percentage of ultra-processed items and their potential adverse impact on health, three important questions arise: How do we know the degree of processing characterising a particular item on the shelf? How can we quantify the extent of food processing in the food supply? How do we design food substitution recommendations that only minimally alter an individual’s diet, but help reduce the consumption of ultra-processed food? Despite the increasing evidence linking ultra-processing to adverse outcomes, consumers do not have access to information pertaining to the degree of processing characterising a particular item on the shelf.
The degree of food processing is currently provided by the NOVA classification system [21], the result of manual curation which defines four discrete categories: unprocessed or minimally-processed (NOVA1), like fruits, vegetables, grains, legumes, meat, fish, and milk; processed culinary ingredients (NOVA2), like oils, fats, table sugars, and salt; processed foods (NOVA3), mainly items with a minimal number of ingredients without additives, like simple canned foods, some breads, and cheese. The largest class is ultra-processed foods (NOVA4), that captures multiple types of breads, cereals, sauces, spreads, hamburgers, carbonated drinks, hot dogs, and pizzas. The NOVA classification does not differentiate between the degrees of processing for foods found in the NOVA4 class, considering them equally ultra-processed, facing the conclusions that 60% of the global, 73% of the USA, and 80% of the South Africa food supply is ultra-processed [22–25]. This homogeneity in food classification makes it difficult to address the impact of ultra-processing with substitution or reformulation strategies [26–28]. Indeed, altering health-related behaviours is a challenging task [29, 30], hence effective and sustainable food substitution strategies must recommend minimal changes to an individual’s diet. We recently showed that substituting only a single ultra-processed food item in a person’s diet with a minimally-processed alternative from the same category can significantly reduce the risk of developing metabolic syndrome (12.25% decrease in odds ratio) and vitamin deficiency (4.83% and 12.31% increase of vitamin B12 and vitamin C blood concentration) in the US population [24]. Yet, the fact that we classify 73% of the food supply in a single ultra-processed NOVA4 category significantly limits our ability to design effective food substitution recommendations. This could be achieved with a processing-based classification that captures the degree of processing of each food in the NOVA4 category.
The National Health and Nutrition Examination Survey (NHANES) indicates that in the USA over 60% of the food consumed comes from grocery stores (Figure S1). Prompted by this information, here we introduce GroceryDB, a database of foods and beverages containing over 50,000 products, collected from publicly available online markets of three major US grocery stores: Walmart, Target, and WholeFoods. For each food, we determined the extent of food processing using FoodProX, a ML-based classifier that provides a continuous and fully automated food processing score (FPro) [24]. FPro translates the nutritional information provided for each product into its degree of processing. In Figure 1, we illustrate the use of FPro by offering the processing score of three products in the breads and yogurt categories, allowing us to compare their degree of processing. Indeed, the Manna Organics multi-grain bread is made from whole wheat kernels, barley, and rice without additives, added salt, oil, and even yeast, resulting in a low processing score of FPro = 0.314. However, the Aunt Millie’s and Pepperidge Farmhouse breads include ‘resistant corn starch’, ‘soluble corn fiber’, and ‘oat fiber’, requiring additional processing to extract starch and fiber from corn and oat to be used as an independent ingredient (Figure 1a), resulting in much higher processing score of FPro = 0.732 and FPro = 0.997. Similarly, the Seven Stars Farm yogurt (FPro = 0.355) is a whole milk yogurt made from ‘grade A pasteurized organic milk’, yet the Siggi’s yogurt (FPro = 0.436) uses ‘Pasteurized Skim Milk’ that requires more processing to obtain 0% fat. Finally, the Chobani Cookies & Cream yogurt relies on cane sugar as the second most dominant ingredient, and on a cocktails of additives like ‘caramel color’, ‘fruit pectin’, and ‘vanilla bean powder’ making it a highly processed yogurt, resulting in a high processing score FPro = 0.918.

FPro allows us to assess the extent of food processing in three major US grocery stores, and it is best suited to rank foods within the same category. (a) In breads, the Manna Organics multigrain bread, offered by WholeFoods, is mainly made from ‘whole wheat kernels’, barley, and brown rice without any additives, added salt, oil, and yeast, with FPro = 0.314. However, the Aunt Millie’s (FPro = 0.732) and Pepperidge Farmhouse (FPro = 0.997) breads, found in Target and Walmart, include ‘resistant corn starch’, ‘soluble corn fiber’, and ‘oat fiber’ with additives like sugar, wheat gluten, and monocalcium phosphate. (b) The Seven Stars Farm yogurt (FPro = 0.355) is made from the ‘grade A pasteurized organic milk’. The Siggi’s yogurt (FPro = 0.436) declares ‘Pasteurized Skim Milk’ as the main ingredients that has 0% fat milk, requiring more food processing to eliminate fat. Lastly, the Chobani Cookies & Cream yogurt (FPro = 0.918) has cane sugar as the second most dominant ingredient combined with multiple additives like ‘caramel color’, ‘fruit pectin’, and ‘vanilla bean powder’, making it a highly processed yogurt.
GroceryDB, shared publicly at the http://TrueFood.Tech/ website, provides the data and methods to quantify food processing and map the organization of ingredients in our food supply, ultimately, empowering consumers to make informed choice for health purposes.
Results
Processing alters the nutrient profile of food, changes that are detectable and categorizable using machine learning [24]. Food and beverage companies are mandated by law to report the nutrient profile and ingredient list of all branded products [31]. Hence, for each food in a grocery store, we could assess the extent of food processing by using as input the respective nutrient profiles, obtaining FPro for all branded products with nutrition facts (Section S3). FoodProX takes as input 12 nutrients (Table S1) and returns a continuous food processing score (FPro), that ranges between 0 (unprocessed foods like fruits and vegetable) and 1 (ultra-processed foods like instant soups and shelf-stable breads). We find that the distribution of the FPro scores in the three stores is rather similar: in each store we observe a monotonically increasing curve (Figure 2a), indicating that minimally-processed products (low FPro) represent a relatively small fraction of the inventory of grocery stores, the majority of the offerings being in the ultra-processed category (high FPro). We do observe, however, systematic differences between the stores: WholeFoods offers more minimally-processed and fewer ultra-processed items, in contrast with a particularly high fraction of ultra-processed offerings by Target (high FPro). These differences in the distribution of the FPro scores is driven by multiple factors, from the cost of food to the socio-economic status of the customers, and the distinct declared missions of the chains: “quality is a state of mind” for WholeFoods Market and “helping people save money so they can live better” for Walmart [32, 33].

(a) To investigate the extent of processing in grocery stores, we collected 50,000 foods and beverages from Walmart, Target, and WholeFoods websites, calculating the FPro score of items with nutrition facts (Section S3). The distribution of FPro scores from the three stores follows a similar trend, a monotonically increasing curve, indicating that the number of low FPro items (unprocessed and minimally-processed) offered by the grocery stores is relatively lower than the number of high FPro items (highly-processed and ultra-processed items), and the majority of offerings are ultra-processed. (b) Distribution of FPro scores for different categories of GroceryDB. The distributions indicate that FPro has a remarkable variability within each food category, confirming the different degrees of food processing offered by the stores. Unprocessed foods like eggs, fresh produce, and raw meat are excluded (Section S5). (c) The distributions of FPro scores in GroceryDB compared to two USDA nationally representative food databases. The USDA Food and Nutrient Database for Dietary Studies (FNDDS) provides a representative sample of food products in the supply chain, while the USDA FoodData Central Branded Products (BFPD) collects branded foods. The similarity between the distributions of FPro scores in GroceryDB, BFPD, and FNDDS suggests that GroceryDB offers a comprehensive coverage of foods and beverages (Section S4).
FPro also captures the inherent variability in the degree of food processing. As illustrated in Figure 2b, we find a small variability of FPro scores in categories like jerky, popcorn, chips, bread, biscuits, and mac & cheese, indicating that consumers have limited choices in terms of degree of processing in these categories (see Section S5 for harmonizing categories between stores). Yet, in categories like cereals, milk & milk-substitute, pasta-noodles, and snack bars, FPro varies widely, indicating that should consumers be aware of processing information, they could choose between items with different degrees of processing.
We compared the distribution of FPro in GroceryDB with the latest USDA Food and Nutrient Database for Dietary Studies (FNDDS), offering a representative sample of the consumed food supply (Figure 2c). The similarity between the distributions of FPro scores obtained from GroceryDB and FNDDS suggests that GroceryDB also offers a representative sample of foods and beverages in the supply chain. We also compared GroceryDB with the USDA Global Branded Food Products Database (BFPD), which contains 1,142,610 branded products, finding that the distributions of FPro in GroceryDB and BFPD follows similar trends (Figure 2c). While BFPD contains 22 times more foods than GroceryDB, surprisingly only 44% of the products in GroceryDB are present in BFPD (Section S4). This indicates that while BFPD offers an extensive representation of branded products, it does not map into the current offering of stores. Furthermore, we compare GroceryDB with Open Food Facts (OFF), another extensive collection of branded products collected through crowd sourcing, containing 426,000 products with English ingredient lists. We find that less than 30% of the products in GroceryDB are present in OFF (Figure S4), a small overlap suggesting that monitoring the products currently offered in grocery stores may offer a more accurate account of the food supply available to consumers.
Food Processing Offers Cheap Calories
Prior studies suggest that ultra-processing may result in the production of cheaper calories [19, 22]. We confirm and quantify this hypothesis by finding that a 10% increase in FPro results in 8.7% decrease in the price per calorie of products (Figure 3a). Yet, the relationship between FPro and price per calorie strongly depends on the food category (Section S6). For example, in soups & stews the price per calorie drops by 24.3% for 10% increase in FPro (Figure 3b), a trend observed also in cakes, mac & cheese, and ice cream (Figure S8). This means that on average, the most processed soups & stews, with FPro ≈ 1, are 66.87% cheaper per calories than the minimally-processed alternatives with FPro ≈ 0.4 (Figure 3e). In contrast, in cereals price per calorie drops only by 1.2% for 10% increase in FPro (Figure 3c), a slow decrease observed also for seafood and yogurt products (Figure S8). Interestingly, we find an increasing trend between FPro and price in the milk & milk-substitute category (Figure 3d), partially explained by the higher price of plant-based milk substitutes, that require more extensive processing than the dairy based milks.

(a) Using robust linear models, we assessed the relationship between price and food processing (see Figure S8 for regression coefficients of all categories). We find that price per calories drops by 24.3% and 1.2% for 10% increase in FPro in soup & stew and cereals, respectively. Also, we observe a 8.7% decrease across all foods in GroceryDB for 10% increase in FPro. Interestingly, in milk & milk-substitute, price per calorie increases by 1.6% for 10% increase in FPro, partially explained by the higher price of plant-based milks that are more processed than regular dairy milk. (b-d) Distributions of price per calorie in the linear bins of FPro scores for each store (Figure S7 illustrates the correlation between price and FPro for all categories). In soup & stew, we find a steep decreasing slope between FPro and price per calorie, while in cereals we observe a smaller effect. In milk & and milk-substitute, price tends to slightly increase with higher values of FPro. (e) Percentage of change in price per calorie from the minimally-processed products to ultra-processed products in different food categories, obtained by comparing the average of top 10% minimally-processed items with the top 10% ultra-processed items. In the full GroceryDB, marked with the red star, on average the ultra-processed items are 52.15% cheaper than their minimally-processed alternatives.
Taken together, we find that relying on cheap ingredients like sugar, emulsifiers, preservatives and highly processed oils can help the production of cheap calories [34, 35]. Yet, the relationship between ultra-processing and food price depends on the food categories.
Choice Availability and Food Processing
The inventory of grocery stores is a strong driver of consumer decisions [36–38], eventually shaping our diet. Not surprisingly, GroceryDB documents differences in the offering of the three stores we analyzed: while WholeFoods offers a selection of cereals with a wide range of processing levels, from minimally-processed to ultra-processed, in Walmart the available cereals are limited to products with higher FPro values (Figure 4a). To understand the roots of these differences, we investigated the ingredients of cereals offered by each grocery store, one of the most popular stable crops, consumed by 283 million Americans in 2020 [39]. We find that cereals offered by WholeFoods rely on less sugar, less natural flavors, and added vitamins (Figure 4b). In contrast, cereals in Target and Walmart tend to contain corn syrup, a sweetener associated with enhanced absorption of dietary fat and weight gain [40, 41]. Corn syrup is largely absent in the WholeFoods cereals, partially explaining the wider range of processing scores characterising cereals offered by the store (Figure 4a).

The nutritional choices offered to consumers, translated into FPro, varies depending on the grocery store and food category. (a) Grocery stores differentiate themselves at the food category level. For example, in cereals, WholeFoods shows a higher variability of FPro, implying that consumers have a choice between low and high processed cereals. Yet, in pizzas all supermarkets offer choices characterised by high FPro values. Lastly, all cheese products are minimally-processed, showing consistency across different grocery stores. (b) The patterns of ingredients in cereals varies depending on the store, explaining the wider range of FPro in cereals offered by WholeFoods compared to Walmart and Target. The top 30 most reported ingredients in cereals shows that WholeFoods tends to eliminate corn syrup, uses more sunflower oil and less canola oil, and relies less on vitamin fortification. In total, GroceryDB has 1,245 cereals from which 400, 347, and 498 cereals are from Walmart, Target, and WholeFoods, respectively. (c) The brands of cereals offered in stores partially explains the different patterns of ingredients and variation of FPro. While Walmart and Target have a larger intersection in the brands of their cereals, WholeFoods tends to supply cereals from brands not available elsewhere.
The brands offered by each store could also help explain the different patterns. We found that while Walmart and Target have a large overlap in the list of brands they carry, WholeFoods relies on different suppliers (Figure 4c), largely unavailable in other grocery stores. In general, WholeFoods offers less processed soups & stews, yogurt & yogurt drinks, and milk & milk-substitute (Figure 4a). In these categories Walmart’s and Target’s offerings are limited to higher FPro values. Lastly, some food categories like pizza, mac & cheese, and popcorn are highly processed in all stores (Figure 4a). Indeed, pizzas offered in all three chains are limited to high FPro values, partially explained by the reliance on substitute ingredients like “imitation mozzarella cheese,” instead of “mozzarella cheese”.
While grocery stores offer a large variety of products, the offered processing choices can be identical in multiple stores. For example, GroceryDB has a comparable number of cookies & biscuits in each chain, with 373, 451, and 402 items in Walmart, Target, and WholeFoods, respectively. The degree of processing of cookies & biscuits in Walmart and Target are nearly identical (0.88 < FPro < 1), limiting consumer nutritional choices in a narrow degree of processing (Figure 4a). In contrast, WholeFoods not only offers a large number of items (402 cookies & biscuits), but it also offers a wider choices of processing (0.57 < FPro < 1)
Organization of Ingredients in the Food Supply
Strategies to reformulate the food supply with the aim to offer less ultra-processed choices require an in-depth understanding of how food producers use the over 15,000 ingredients found in branded products (Section S7.2) [42]. Food and beverage companies are required to report the list of ingredients in the descending order of the amount used in the final product. When an ingredient itself is a composite, consisting of two or more ingredients, FDA mandates parentheses to declare the corresponding sub-ingredients (Figure 5a-b) [43]. We organized the ingredient list as a tree, allowing us to compare a highly processed cheesecake with a less processed alternative (Figure 5). In general, we find that products with complex ingredient trees are more processed than products with simpler and fewer ingredients (Section S7.3). For example, the ultra-processed cheesecake in Figure 5a has 42 ingredients, 26 additives, and 4 branches with sub-ingredients. In contrast, the minimally-processed cheesecake has only 14 ingredients, 5 additives, and 1 branch with sub-ingredients (Figure 5b). As illustrated by the cheesecakes example, ingredients used in the food supply are not equally processed, prompting us to ask: which ingredients contribute the most to the degree of processing of a product? To answer this we introduce the Ingredient Processing Score (IgFPro), defined as
 where
where  ranks an ingredient g in decreasing order based on its position in the ingredient list of each food f that contains g (Section S7.5). IgFPro ranges between 0 (unprocessed) and 1 (ultra-processed), allowing us to rank-order ingredients based on their contribution to the degree of processing of the final product. We find that not all additives contribute equally to ultra-processing. For example, the ultra-processed cheesecake (Figure 5a) has sodium tripolyphosphate (a stabilizer used to improve the whipping properties with IgFPro = 0.926), polysorbate 60 (an emulsifier used in cakes for increased volume and fine grain with IgFPro = 0.922), and corn syrup (a corn sweetener with IgFPro = 0.909) [44], each of which emerging as signals of ultra-processing with high IgFPro scores. In contrast, both the minimally-processed and ultra-processed cheesecakes (Figure 5) contain xanthan gum (IgFPro = 0.817), guar gum (IgFPro = 0.806), locust bean gum (IgFPro = 0.780), and salt (IgFPro = 0.771). Indeed, the European Food Safety Authority (EFSA) reported that xanthan gum as a food additive does not pose any safety concern for the general population, and FDA classified guar gum and locust bean gum as generally recognized safe [44].

GroceryDB organizes the ingredient list of products into structured trees, where the additives are marked as orange nodes (Section S7). (a) The highly processed cheesecake contains 42 ingredients from which 26 are additives, resulting in a complex ingredient tree with 4 branches of sub-ingredients. (b) The minimally-processed cheesecake has a simpler ingredient tree with 14 ingredients, 5 additives, and a single branch with sub-ingredients.
On the same token, we looked into the oils used as ingredients in branded products to assess which oils contribute the most to ultra-processed foods. IgFPro identifies brain octane oil (IgFPro = 0.573), flax seed oil (IgFPro = 0.686), and olive oil (IgFPro = 0.712) as the highest quality oils, having the smallest contribution to ultra-processing. In contrast, palm oil (IgFPro = 0.890), vegetable oil (IgFPro = 0.8676), and soy bean oil (IgFPro = 0.8684) represent strong signals of ultra-processing (Figure 6a). Indeed, flax seed oil is high in omega-3 fatty acids with several health benefits [45]. In contrast, the blending of vegetable oils, a signature of ultra-processed food, is one of the simplest methods to create products with desired texture, stability, nutritional properties, and affordable price [46].

To investigate which ingredients contribute most to ultra-processed products, we extend FPro to the ingredients listed on the nutrition fact labels using Eq. 1. (a) The IgFPro of all ingredients that appeared in at least 10 products are calculated, rank-ordering ingredients based on their contribution to ultra-processed foods. The popular oils used as an ingredient are highlighted, with the brain octane, flax seed, and olive oils contributing the least to ultra-processed products. In contrast, the palm, vegetable, and soybean oils contribute the most to ultra-processed products (Section S7.5). (b) The patterns of ingredients in the least-processed tortilla chips vs. the ultra-processed tortilla chips. The bold fonts track the IgFPro of the oils used in the three tortilla chips. The minimally-processed tortilla chips (FPro = 0.477) uses avocado oil (IgFPro = 0.812), and the more processed El Milagro tortilla (FPro = 0.769) has corn oil (IgFPro = 0.866). In contrast, the ultra-processed Doritos (FPro = 0.982) relies on a blend of vegetable oils (IgFPro = 0.868), and is accompanied with a much more complex ingredient tree, indicating that there is no single ingredient “bio-marker” for ultra-processed foods.
Finally, to illustrate the ingredient patterns characterising ultra-processed foods in Figure 6b, we show three tortilla chips, ranked from the minimally-processed to the ultra-processed. The minimally-processed Siete tortilla (FPro = 0.477) is made with avocado oil and blend of cassava and coconut flours. The more processed El Milagro tortilla (FPro = 0.769) is cooked with corn oil, grounded corn, and has calcium hydroxide, generally recognized as a safe additive made by adding water to calcium oxide (lime) to promote dispersion of ingredients [44]. In contrast, the ultra-processed Doritos (FPro = 0.982) has corn flours, blend of vegetable oils, and relies on 12 additives to ensure a palatable taste and the texture of the tortilla chip, demonstrating the complex patterns of ingredients and additives needed for ultra-processing (Figure 6b).
In summary, complex ingredient patterns accompany the production of ultra-processed foods (Section S7.4). IgFPro captures the role of individual ingredients in the food supply, enabling us to diagnose the processing characteristics of the whole food supply as well as the contribution of individual ingredients.
Discussion
Governments increasingly acknowledge the impact of processed foods on population health, and its long-term affect on healthcare. For example, the United Kingdom spends 18 billion £ annually on direct medical costs related to non-communicable diseases like obesity [47]. To reduce obesity and cardiovascular diseases, the UK recently introduced limitations on the promotion of foods high in fat, sugar and salt [48], common characteristic of ultra-processed food. GroceryDB offers crucial information to both consumers and policy makers, helping them assess the extent of processing in the food supply, information that is virtually impossible to obtain from other sources. Indeed, evidence on ultra-processing is hidden by the unrealistic serving sizes and subtle shifts in nutrient profiles printed with small fonts on food packages, limiting the ability of individuals to make informed decisions and better food choices. Our goal in offering this information is to empower the consumers in making healthier food choices, enabling the implementation of effective substitution strategies that seek minimal changes in an individual’s diet.
Our results indicate that there is no single ingredient that serves as a “bio-marker” of ultra-processing (Figure 6b), but ultra-processing introduces complex changes in ingredients and subtle shifts in nutrient profiles. Therefore, here we provide the tools to diagnose the state of our current food supply, aiding policy makers to develop the necessary reforms to alter the food systems towards healthier choices.
Designing strategies to reduce our reliance on ultra-processed food is a very complex task. Indeed, prioritizing which products or ingredients should be the target of policy reforms is not trivial due to the lack of technologies to quantify the extent of food processing and the large number of ingredients in the branded products. For example, the GS1 UK data crunch analysis on the impact of bad data on profits and consumer service in the UK grocery industry reports an average of 80% inconsistency in products data [49]. GroceryDB has over 15,000 ingredients annotated with over 500 descriptors (Section S7.2), helping decide which group of branded products and ingredients should be prioritized to ultimately reduce the extend of ultra-processing in the supply chain, and population diet.
Finally, we developed a food recommendation algorithm that offers similar, but less processed choices for any food in GroceryDB. The recommendation system, based on the normalized labels in ingredient trees (Figure 5), offers a natural way to compare branded products. GroceryDB and the food recommendation system are publicly available via (http://TrueFood.Tech/), a platform designed to empower consumers by comparing products with each other and offering less processed food alternatives. GroceryDB along with the TrueFood platform demonstrate the value of data transparency on the inventory of grocery stores, a factor that directly influences consumer decisions.
Data Availability
All code and data are available at BarabasiLab GitHub repository via https://github.com/Barabasi-Lab/GroceryDB/. Furthermore, GroceryDB is available to the public and consumers at http://TrueFood.Tech/.
Competing Interests
A.-L.B. is the founder of Scipher Medicine and Naring Health, companies that explore the use of network-based tools in health and food, and Datapolis, that focuses on urban data.
Code and Data Availability
All code and data are available at BarabasiLab GitHub repository via https://github.com/Barabasi-Lab/GroceryDB/. Furthermore, GroceryDB is available to the public and consumers at http://TrueFood.Tech/.
Author contributions
G.M., B.R., and A.-L.B. conceived and designed the research. B.R. performed data collection, data modeling, statistical analysis, data query and integration, and wrote the manuscript. P.M. performed data cleaning, data integration, statistical analysis, and contributed to writing the manuscript. G.M. and A.-L.B. contributed to the conceptual and statistical design of the study and to writing the manuscript.
Supplementary Materials
1 Food Sources in NHANES
The majority of people rely on grocery stores as the primary source of food. To investigate this hypothesis, we looked into the National Health and Nutrition Examination Survey (NHANES), offering the variable DR1FS that corresponds to “Where did you get (this/most of the ingredients for this)?”, found at (https://wwwn.cdc.gov/Nchs/Nhanes/2017-2018/DR1IFFJ.htm#DR1FS). We find that over 60% of all foods reported by NHANES 2017-2018 participants are from stores (Figure S1), indicating the high degree of reliance of the US population on grocery stores.

2 Data Collection and Processing
We built GroceryDB by collecting information regarding branded products from the publicly available data on the online websites of Walmart, Target, and WholeFoods. For data storage, we used MongoDB that offers highly flexible data structures with high input/output throughput.
2.1 Identification of Additives
We used the “Substances Added to Food” database provided by the US Food and Drug Administration (FDA) as our primary dictionary to identify additives and their synonyms in food products [1]. We also used the “Dictionary of Food Ingredients” (DFI) to further enrich and categorize the identification of additives [2]. Non-trivially, many substances declared on the nutrition fact labels have a broad range of synonyms. Thus, in addition to the synonyms provided by FDA, we also manually identified many synonyms of additives to better clean and normalize ingredient lists.
A major issue with cleaning ingredient lists is the high level of mismatch between labels provided by the FDA and the declared ingredients on nutrition fact labels printed by food producers. This is aligned with the GS1 UK data crunch analysis, reporting 80% inconsistency in products data in the UK grocery industry [3]. This inconsistency could be partially explained by the high level of difficulty to find the common name of an additive. For example, the FDA food labeling guide encourages the use of common names, stating “always list the common or usual name for ingredients unless there is a regulation that provides for a different term. For instance, use the term ‘sugar’ instead of the scientific name ‘sucrose’ [4].” However, the FDA does not provide a strictly standardized database on the common names and synonyms of additives. While building GroceryDB, we frequently faced the issue that common ingredient names were not used on food packages. For example, the additive commonly known as “baking soda” is frequently declared as “sodium bicarbonate” on product labels. Similarly, “carmine”, a common coloring additive, is found in GroceryDB both as its standard name, “carmine”, and as “cochineal extract”, named after the insect at the origin of its red color.
Lastly, as a note on terminology, the FDA distinguishes between “additives” and “substances added to food.” In our analysis we equate the label “additive” to the FDA’s “substance added to food.”
3 Food Processing Score (FPro)
We used FoodProX, a random forest classifier, to calculate FPro for the branded products in GroceryDB [5]. To train FoodProX, we used the manual NOVA classification on two USDA datasets, namely, FNDDS and Standard Reference (SR). For items with manual NOVA1, NOVA2, and NOVA3, we combined all unique nutrient profiles (12 nutrients) from FNDDS 2001-2018 (9 cycles), plus all the unique nutrient profiles from SR 20-28 (9 versions). This enables us to have more nutrient profiles among unprocessed and processed foods. However, for items with manual NOVA4, we only combined the latest nutrient profile for each food code from FNDDS 2001-2018 and SR 20-28. The reason for not including all unique nutrient profiles in NOVA4 class is to balance the training dataset, otherwise including all unique profiles in NOVA4 would make the training data from NOVA4 extremely dominant, not giving the classifier a chance to learn the characteristics of nutrient profiles in NOVA1-2-3 classes. The fraction of foods in each NOVA class is represented in Figure S2. The addition of SR database to the training data increased the number of training samples for NOVA1 and NOVA3 classes, hence balancing the training dataset.
We used the 12 nutrients in Table 1 to train FoodProX, since FDA requires reporting these nutrients on nutrition fact labels [6]. Although providing the minimum of 12 nutrients is mandated by the law, not all food labels declare those nutrients. Hence, we decided to rely on 10 nutrients and assume value 0 for Vitamins C and A, if these vitamins are not reported. The number of products that reported at least 10 nutrients in GroceryDB is shown in Figure 3. For consistency, we decided to ignore all foods that do not meet the minimal requirement of 10 nutrients [7]. If necessary, the value of missing nutrients could be imputed to measure the degree of food processing for all foods currently excluded.

12 Nutrient Panel for Branded Products

4 Comparison with USDA FoodData Central and Open Food Facts Databases
Initially, with the goal of obtaining the missing nutrition facts, we matched GroceryDB with the USDA FoodData Central Global Branded Food Products Database (BFPD) according to the ingredient lists. However, BFPD only covered 44% of the products in GroceryDB (with Similarity Score ≥ 0.95), lacking also nutrition facts for the products with missing nutrients in GroceryDB (Figure S3A). Similarly, OFF covers 38% of GroceryDB (Figure S3B).
Specifically, within the 22,900 items with missing nutrition facts, only 9,600 were matched with Similarity Score ≥ 0.95 from which only 537 had full nutrition facts. These findings suggest that GroceryDB offers a more up to date picture of the food supply, and many products do not report the full nutrient panel required by the FDA.

GroceryDB offers a complementary picture of the food supply compared to BFPD and Open Food Facts (OFF). (A) We derived similarity scores based on ingredient lists declared in USDA BFPD and GroceryDB, using the the TF-IDF (Term Frequency-Inverse Document Frequency) algorithm. The USDA BFPD (April 2021 version) has 1,142,610 branded products and GroceryDB has 50,467 items from which 2,754 items are excluded because of not having an ingredient list. We calculated the similarity score for the remaining 47,713 items, finding that BFPD only covers 44% of the products in GroceryDB with Similarity Score ≥ 0.95. (B) Similarly, we investigated the overlap between OFF and GroceryDB. Among 426,479 products in OFF with English list of ingredients (as of January 2022), only 18,948 products exist in the entire GroceryDB with Similarity Score ≥ 0.95, covering 38% of the products in GroceryDB.
5 Category Harmonization
Grocery stores classify foods into multiple categories and sub-categories, for a total of over 200 main categories and 866 sub-categories that are hierarchically organized in levels. Grocery store categories tend to be organized according to the store layout, helping consumers navigate the store. In contrast, epidemiological databases tend to categorize foods based on processing methods and the origin of food (type of plant or animal parts). For instance, FNDDS 2017-2018 has multiple categories for milk: ‘Milk and Milk Products’, ‘Milks, milk drinks, yogurts, infant formulas’, ‘Milk, fluid, evaporated and condensed’, and ‘Milk, fluid, imitation’ (declared by first 5 digits of food codes). Another approach to food classification is used by the What We Eat in America (WWEIA) database, aiming to provide categories that better resonate with consumers. For example, WWEIA contains 10 categories for milks, separating milk flavors and fat concentrations, ranging from ‘Milk, whole’, ‘Milk, reduced fat’, and ‘Milk substitutes’, to ‘Flavored milk, whole’, ‘Flavored milk, nonfat’, and ‘Milk shakes and other dairy drinks’ [8]. In GroceryDB, we followed a similar approach as WWEIA, with additional emphasis on the consumer’s use of products to enable effective food substitution strategies. For instance, we placed meat-based and plant-based burgers into a single category, ‘Prepared Meals & Dishes’, since from the consumer perspective these are both ready-to-cook burgers. This method of categorization leads to broader food categories and higher food variability, allowing more opportunities for meaningful food substitution recommendations.
We harmonized foods from grocery stores into 42 broad categories designed for assisting food recommendation algorithms that aim at finding alternative food choices within the same category. For instance, in grocery stores the frozen-foods category includes items ranging from frozen fruits and vegetables to frozen lasagna and breakfast egg bites. We therefore broke the frozen-foods category into “Packaged Produce”, “Breakfast”, and “Prepared Meals & Dishes”. The list and size of the harmonized categories in GroceryDB are shown in Figure S5.
The reason for observing such a large number of categories in stores is due to the lack of a standard classifying method across the stores. For example, breads as Level 1 category are marked as “bread bakery”, “bakery bread”, and “breads rolls bakery” in Walmart, Target, and WholeFoods, respectively (Figure S6).
Lastly, since the focus of this paper is investigating the extent of food processing in grocery stores, we decided to not include the categories that are naturally unprocessed in all analysis, except in Figure 2A and Figure 2C that illustrate the distributions of FPro. Food categories such as fresh produce, raw beans, eggs, and raw meat are example of categories that are naturally unprocessed.


(A-B) Breakdown of frozen and pantry foods commonly found in the category hierarchy of grocery stores (inner cycles), mapped onto the GroceryDB harmonized categories (outer cycle).
6 Price and Food Processing
To investigate the hypothesis that processing impacts food prices, we calculated the PricePerCalories of the branded products as the total package price divided by the package calories (Figure S7A-B-B). Items with zero calories like Coke Zero are ignored in this analysis. Next, we calculated the Spearman’s correlation coefficient between FPro and PricePerCalories, as captured by the correlation matrix in Figure S7C. We find that depending on the store and categories, food processing correlates with cheaper calories, as in case of the strong negative correlation for breakfast, mac-cheese, pudding-jello, cakes, and pastry-chocolate-candy. Finally, in a few categories like milk-milk-substitute and pasta-noodles the more processed foods tend to have a higher price (Figure S7C).
To further assess the relationship between PricePerCalorie and FPro, we used robust linear models [9, 10]. The regression coefficients and p-values are illustrated in Figure S8. Note that in Figure 3, we did not include the pasta-noodles category. The reason is lack of data in this category, as out of 256 items we have price for 164 that are highly segmented (Figure S9), leading to the observation that on average the highly processed pasta-noodles are 46% expensive than minimally processed-alternatives (comparing the averages in the top and bottom 10% of FPro).


7 Organization of Ingredients
This section describes the methods we developed to quantify the organization of ingredients in the food supply.
7.1 Cleaning Ingredient Lists
The ingredient lists are regulated by the FDA food labeling guidelines, however there are numerous nuances that cause inconsistency and require normalization [11]. For example, corn starch is reported as “cornstarch”, “corn-starch”, and “corn starch” in the ingredient lists, and needs to be normalized to one format. Similarly, FDA allows using a variety of synonyms for an ingredient, like the common synonyms “soybean”, “soy”, and “soya” used for soybeans. Additionally, ingredient lists often provide a variety of information for individual ingredients, like the processes involved in their preparation or the intended purpose of their use. We normalized these information by identifying the general name of an ingredient and using descriptors to mark any extra information provided in each ingredient label.
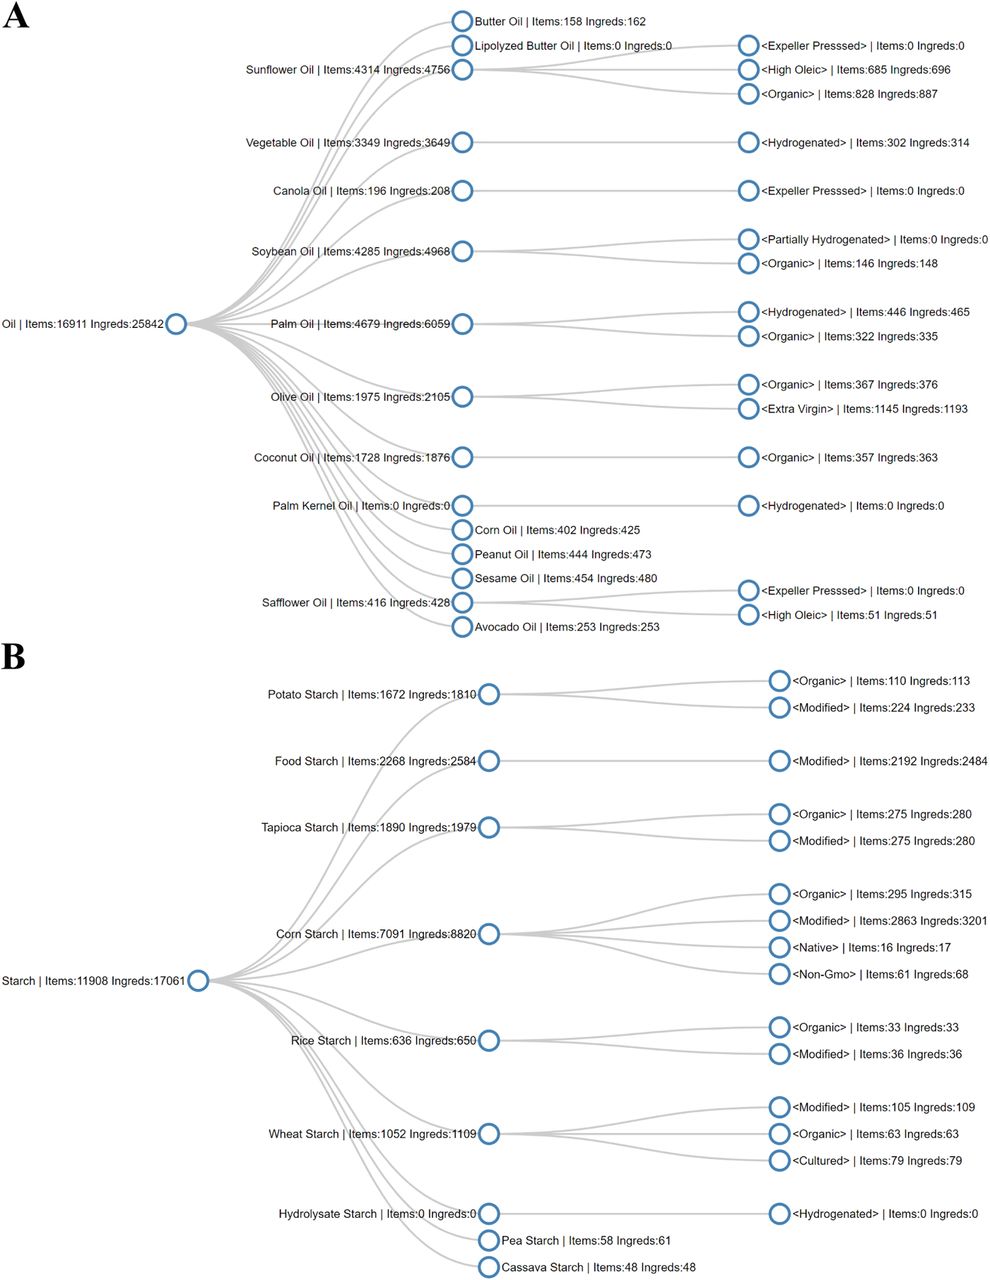
The heterogeneity and variability of declared labels in the ingredients lists requires a base-knowledge to organize the list of ingredients into ingredient trees. Hence, we built a set of semantic trees by leveraging the dictionary of food ingredients [2], and by manually investigating the ingredient list of products in GroceryDB. The purpose of a semantic tree is to capture the common forms representing the same ingredient label by distinguishing the differences in the origin of an ingredient, the alterations caused by food processing, and the semantic synonyms. For instance, we have a semantic tree for oil that covers 25 types of oils ranging from seed and vegetable oils (like sesame and corn) to fruit based oils (palm and avocado), also annotating the markers of processing such as expeller pressed, hydrogenated, and partially hydrogenated (Figure S11A). Similarly, we obtained a semantic tree for common generic terms like ‘starch’, that captures various types of starches declared on food labels, from potato starch (organic or modified) to corn starch (native or non-GMO, Figure S11B). Lastly, we organized this extra information with descriptors, annotated as “<descriptor>” in cleaned ingredient labels.

Finally, the breakdown of raw ingredients normalized to structured labels is illustrated in Figure S12. The raw format of ingredients as reported on product packages contains over 32,000 unique labels, including a broad range of heterogeneous synonyms and semantically duplicate labels. Through text curation, we were able to reduce this number to approximately 20,000 ingredients. See Section S7.2 for a robust assessment of the number of ingredients, additives, and descriptors in GroceryDB.

Two example of semantic trees used to organize ingredient lists into ingredient trees, with the number of products and ingredients for ingredients and their descriptor.

Breakdown of the raw labels obtained from the declared ingredients on branded products normalized into structured labels in GroceryDB.
7.2 Approximating the Number of Ingredients in GroceryDB
Given the high level of data inconsistency in the grocery industry [3], it is difficult to find the exact number of ingredients and additives in GroceryDB. Hence, we use the population proportion estimation statistics (Cochran’s sample size formula) to estimate the number of ingredients, additives, and descriptors. We estimate the number of unique ingredients to be 20,097 (Figure S13A), including 6,925 additives (Figure S13B). We present two quantities, one considering descriptors and another without descriptors, providing two levels of ingredient specificity. With descriptors, for example, the string “bleached wheat flour” is counted separately from “enriched wheat flour.” Without descriptors, both are considered “wheat flour.”
This task is difficult as there is not a one-to-one mapping between unique strings in the ingredient lists, and an actual ingredient. For example, for the ingredient “vitamin b12”, we found typos like “vitemin b12”, branded strings (“Walmart vitamin b12”), and synonyms (“vit. b12”), which all point to the same ingredient. A full cleaning of ingredient strings to achieve a one-to-one mapping is a goal of future work, but we can approximate the number of unique ingredients in the U.S. food system with the current state of GroceryDB.
To estimate the number of ingredients and additives, we collected samples of ingredient labels after running our data cleaning pipeline (Figure S10). Then, we manually investigated these samples to count the number of labels that are correctly classified vs. incorrectly classified (due to the lack of a comprehensive dictionary of synonyms and the large level of data inconsistency in the grocery industry). Next, we used the Cochran’s formula to estimate the number of ingredients and additives based on the proportion of correctly classified labels. Lastly, the limitations of this approach are presented in Section S8.

(A-B) Estimation for the unique number of ingredients and additives in GroceryDB based on Cochran’s formula with 95% confidence interval. The descriptors add a significant complexity in estimating the number of ingredients and additives in the food supply. Examples of ingredients with descriptors are “bleached wheat flour” and “enriched wheat flour” where ‘bleached’ and ‘enriched’ are descriptors. (C) The number of descriptors that appeared at least in 10 products. Although we manually created a dictionary of descriptors with 168 labels, we mainly relied on natural language processing to automatically identify descriptors. This process resulted in identifying new descriptors. (D) Ahuja et al in [12] analyzed a subset of BFPD, resulting in the identification of 6,500 ingredients from 5 out of 31 food categories in BFPD. Our data cleaning led to the identification of a similar number of ingredients without descriptors, for a total of 6,690 ingredients.
7.3 Characteristics of Ingredient Trees
The branded products with more complex list of ingredients are more likely to be highly processed. To test this hypothesis, first we introduce two measures characterizing ingredient trees: tree width and depth. The tree width, denoted by W, represents the number of main ingredients in a product, and the tree depth, D, approximates the extent of the reliance on mixtures of sub-ingredients. We define depth-sum of an ingredient tree, denoted by Ds, as the sum of the depth of all its branches. Figure 5 presents two cheesecakes with FPro = 0.953 and FPro = 0.720 along with their corresponding ingredient trees. The highly processed cheesecake has a complex ingredient tree with W = 10 and Ds = 4 (Figure 5A). In contrast, the less processed cheesecake has a simpler ingredient tree with W = 5 and Ds = 2 (Figure 5B).
Theoretically, by the definition of branch depth sum, Ds may be considered as another representation of W, if most main ingredients of products have sub-ingredients. Yet, we find that W and Ds show varying characteristics, depending on food categories. For example, cheeses tend to have high W and low Ds, whereas cakes have relatively lower W and higher Ds, showing distinct behaviors as illustrated in Figure S14A. In contrast, when comparing cakes and pizzas (Figure S14B), the difference between W and Ds is less striking. Moreover, the distributions of W and Ds show more differences than similarities as illustrated in Figure S15A-B-B, indicating that they are presenting different information. Interestingly, we find that WholeFoods tend to offer foods with both smaller W and shorter Ds compared to the other stores. That is, products in WholeFoods tend to have less ingredients and also rely less on mixing sub-ingredients.

Tree Width vs Depth-Sum (Ds).
Finally, We analyzed the relationship between W and Ds of ingredient trees in all categories. The Spearman’s correlation between W and Ds suggests that these metrics capture unique information about the products. We find both positive and negative correlations between W and Ds, depending on the categories (Figure S15C). The strongest correlation between W and Ds is in the culinary ingredients and spices-seasoning, since these are the categories that in principle should least rely on the mixture of sub-ingredients, as generally spices and culinary ingredients are made of simple ingredients. In milk & milk-substitutes, we also find a strong correlation between W and DS, partially explained by the transition from simple whole milk to chocolate and milk-substitutes (like almond and oat milks), increasing the number of main ingredients and sub-ingredients (Figure S15). On the other hand, in breads, ice cream, and sausage, we find a negative correlation between W and Ds partially explained by the use of more complex ingredients. For instance, flour, dough conditioner, and cookie dough are often reported with a long mixture of sub-ingredients, resulting in a higher Ds in breads and ice creams.

7.4 Correlation between Characteristics of Ingredient Lists and FPro
To test the hypothesis that branded products with more complex list of ingredients are more likely to be highly processed, we also investigate the relationship between W, Ds, and FPro. For example, in cereals, pasta-noodles, and baking categories, the items that have simpler ingredient trees also have a significantly lower FPro (Figure S16A-C-C). However, this effect is weaker in prepared Meals & dishes, where we find lower values of FPro with relatively large ingredient trees (Figure S16D).
Lastly, we further investigate the Spearman’s correlation between W, Ds, and FPro. Generally, we find a strong correlation between W, Ds, and FPro indicating that products with complex ingredient trees tend to have a higher FPro (Figure S17). Also, some categories show stronger correlation with Ds and FPro, signaling that mixing many sub-ingredients may drive food processing. For example, in breakfast products, pizzas, popcorn, we find that Ds has a stronger correlation with FPro compared to W and even the total number of ingredients (defined as the sum of all ingredients and sub-ingredients including additives, Figure S17).

Complex ingredient trees tend to have a higher FPro. (A-C) In cereals, pastanoodles, and baking categories, we find that FPro increases as tree width W and Ds increases. (D) This effect is weaker in prepared meals & dishes.

7.5 Ingredient Processing Score (IgFPro)
An ingredient tree can be created in two ways: (a) emphasize on better visualization of the main and sub-ingredients, similar to a recipe, as illustrated in Figure 18A, and (b) emphasize on capturing the order of ingredients as a proxy for their amount in a final product as illustrated in Figure S18B, where the distance from root, d, reflects the amount of an individual ingredient relative to all ingredients. We decided to use the latter type of ingredient trees to calculate IgFPro, as ranking the amount of an ingredient in a food is essential to quantify the contribution of individual ingredients to ultra-processing. In Eq. 1, we used  to rank the amount of an ingredient in each food, capturing the distance from root, namely
  for an ingredient g in food f (see Figure S18B for an example).
Finally, IgFPro shows a remarkable variability, when its compared to the average FPro of products containing an individual ingredient (Figure S18). This variability indicates that IgFPro is capturing signals on the contribution of an ingredient to food processing, that goes beyond a simple average.


The general form of ingredients is used without descriptors. For example, the general name of ‘milk <pasteurized>’ without descriptors is ‘milk.’ Also, only the general ingredients that are present in at least 10 products are considered, resulting in IgFPro measures for over 1,200 ingredients, as ranked in Figure 6.
8 Limitations
The problem of inferring the exact level of industrialized processing affecting food constitutes extremely difficult challenges, since we are bounded to the information reported on the nutrition fact labels, which are regulated by the FDA [11]. The NOVA classification also can not exactly determine the extent of food ultra-processing, instead NOVA assigns the majority of foods in the NOVA4 (ultra-processed) category by relying on the ingredient lists and additives, ignoring the nutrient information [13]. Moreover, on the top of experiencing a high level of data inconsistency in the grocery industry [3], we also lack a source of data on the actual processes applied during food preparation. Indeed, the lack of data on actual food processing methods is a major source of ambiguity in the literature for reaching consensus over a definition of ultra-processed food [14–16]. Despite the lack of data on food processing and the limited 12 nutrient panel mandated by FDA (Table S1), GroceryDB and FPro provide a novel data-driven approach that enabled the creation of the substitution algorithms implemented at http://TrueFood.Tech/. We emphasize that there is no single ingredient or nutrient “bio-marker” for food processing, yet FPro utilizes machine learning that learns the combinatorial domain of nutrient-values and their hidden inter-correlated space.
Moreover, GroceryDB paves the way towards systematically quantifying the organization of ingredients in the food supply. Indeed, the level of data inconsistency is estimated to be 80% in the grocery industry [3, 12]. Given this high level of data inconsistency, future work will extend the current efforts on data cleaning, integration, and normalization, to better approximate the number of unique ingredients and additives in the food supply. Yet, GroceryDB provides the data structure, methods, and pipeline needed to systematically unify the ingredient lists in the food supply, and unveil the organization of ingredients.
Finally, the analysis conducted in this paper are based on a single snapshot from the online stores of three major grocery stores. The current study may not contain all information about the inventory of products in grocery stores. Yet, GroceryDB provides an updated picture of the food supply when compared to USDA BFPD and OpenFoodFacts (Section S4).
Acknowledgments
We thank Dwijay Shanbhag at Northeastern University for his help on data collection and cleaning. A.-L.B is partially supported by NIH grant 1P01HL132825, American Heart Association grant 151708, and ERC grant 810115-DYNASET.


