
Abstract
Treatment of acute ischemic stroke is heavily contingent upon time, as there is a strong relationship between time clock and tissue progression. We sought to a develop a deep learning algorithm for classifying time since stroke (TSS) from MR images by comparison to neuroradiologist assessments of imaging signal mismatch and validation on external data. This retrospective study involved patients who underwent MRI from 2011-2019. The models were trained to classify TSS within 4.5 hours; performance metrics with confidence intervals were reported on both internal and external test sets. A total of 772 patients (66 ± 9 years, 319 women) were used for model development and evaluation. Three board-certified neuroradiologists’ assessments, based on majority vote, yielded a sensitivity of 0.62, a specificity of 0.86, and a Fleiss’ kappa of 0.46. The deep learning method had higher sensitivity and accuracy than the radiologists and previously reported methods while maintaining the same level of specificity, with the best model achieving an average test accuracy of 0.791, sensitivity of 0.777, and specificity of 0.802. This model achieved higher generalization performance on the validation dataset than the current state of the art for TSS classification. Code in this paper will be available online soon.
Introduction
For acute ischemic stroke (AIS) patients, the benefit of thrombolytic therapy is positively associated with earlier reperfusion time 1,2. Until recently, thrombolysis was only recommended for AIS patients with a known symptom onset time (TSS) within 4.5 hours 2,3. AIS with unknown or unclear TSS has been reported in as many as 35% of patients 4; in one study 5 only 6.5% of patients hospitalized for AIS received intravenous thrombolysis, with unknown TSS being the primary reason for treatment exclusion 3. Many studies have sought clinical factors to assess eligibility and risk for thrombolytics, with significant focus on neuroimaging 6–8. The Efficacy and Safety of MRI-Based Thrombolysis in Wake-Up Stroke (WAKEUP) trial showed that signal mismatch between diffusion-weighted imaging (DWI) and fluid-attenuated inversion recovery (FLAIR) mismatch can be used to select AIS patients with unknown TSS for thrombolytic treatment 9. Accordingly, use of DWI-FLAIR mismatch is now recommended (level IIa) to identify unwitnessed AIS patients who may benefit from thrombolytic treatment in the updated American Heart Association-American Stroke Association (AHA-ASA) guidelines 2. DWI-FLAIR mismatch, like any subjective assessment, is prone to reader variability that may result in erroneous exclusion of patients who could benefit from thrombolytic treatment 10. TSS on the other hand, is an objective surrogate biomarker in clinical settings. Thus, an automated method that classifies TSS could broaden the number of patients eligible for thrombolytic treatment. Machine learning has shown utility for stroke-specific clinical decision support 11,12. Deep learning specifically has been widely explored for imaging-based tasks 13,14. However, models may suffer from reduced performance on unseen external datasets, requiring external validation of these algorithms 15.
In this retrospective work, we evaluate three methods to assess TSS: DWI-FLAIR mismatch assessments by neuroradiologists, a previously published state-of-the-art machine learning method, and our new deep learning algorithm. We report their performance and compare them to the mismatch assessments. Using an external validation set, we explore the algorithms’ generalizability by varying the amounts of new data used for model refinement and retraining. We also explore the performance of our proposed deep learning model refined on DWI-FLAIR mismatch labels. Finally, we use occlusion and gradient-based visualizations to gain insight into model behavior.
Materials and Methods
Datasets
This study was retrospective, observational dataset comprising patients from two institutions. The first cohort comprises 417 patients who: 1) were diagnosed with acute ischemic stroke from 2011-2019, 2) underwent diffusion-weighted MRI as part of their clinical workflow prior to any treatment, and 3) had a known TSS. Patients were determined to have a known TSS if their reported last known well time was known to be within or outside of the 4.5-hour treatment window 16. The cohort had a median age of 70 (55-80) years, a median National Institutes of Health Stroke Scale (NIHSS) score of 8 (4-15) and were 53% female (222/417). The median onset to MRI was 222 (105-715.25) minutes. The second dataset, published by Lee et al., has 355 patients, the demographics of which have been previously summarized 12. Clinical features of these patients are summarized in Figure 1. To ensure consistency across both datasets, DWI, FLAIR, and apparent diffusion coefficient (ADC) images were subjected to a preprocessing pipeline 16. Briefly, images had the neck and skull removed via the Brain Extraction Tool and were subjected to N4-bias field correction using the FMRIB Software Library (17,18). The T2 series was registered to the MNI-152 T2 atlas, then the remaining series were all co-registered to the T2 volume. Finally, they underwent intensity normalization and histogram matching 19.

Patient flowchart illustrating inclusion criteria for this study.
DWI-FLAIR Mismatch Assessments
For each patient in the test sets, three neuroradiologists independently assessed mismatch between DWI and FLAIR series. These labels served as a proxy for TSS, as mismatch indicates that a stroke occurred recently enough such that there are regions that have experienced ischemia (visible on DWI) but are not yet infarcted (visible on FLAIR). All three radiologists performed these assessments on workstations within the same facility, and they were blinded to model classifications and EHR data. An overarching determination was assessed for each patient by majority vote among the three experts.
TSS Classification Models
Deep Learning Model
Following image pre-processing, the deep learning (DL) model utilized DWI, ADC, and FLAIR volumes 16. Model input encompasses three corresponding MRI slices, one from each series, of a single hemisphere of the brain. The model leverages a Resnet-34 backbone to perform 2.5D convolutions on the input 20. Features are generated in a 2D fashion for the entire hemisphere volume and the resulting outputs are then added together using a weighted scalar for each slice in a softmax decision layer.
Based on the slice thickness of the MR images in clinical stroke protocol, we designed a multi-slice 2.5D model to incorporate the inter-slice information into 2D CNNs to extract neighboring slices’ spatial information while maintaining a lightweight structure. DWI, FLAIR, and ADC image series were stacked as channels and fed into a shared convolutional layer and ResBlock. Intermediate features of neighboring slices were grouped and fed through individual weight-sharing subnetworks based on a ResNet34 backbone. The output of each set of neighborhood slices were fed into a softmax layer to fuse the features across subnetworks. This softmax was trainable, enabling the model to learn the importance of certain subnetworks over others. Channel and spatial attention modules were attached at the last two ResBlocks to extract multi-scale features 21 these outputs were then fused with backbone features. Finally, these outputs were fed through a fully connected layer to generate a patient-level TSS classification. A schematic of our model is illustrated in Figure 2. We adopted our previously published transfer learning schema to the model for the training process. The model was trained for 100 epochs with early stopping using the Adam optimizer with weight decay, and a learning rate of 0.0001, with a batch size of 12.

The deep learning architecture used DWI, FLAIR, and ADC series as input. The model split the volume into slices z1,…, zM and stacks the image series as channels. Each slice zm was fed into a shared set of convolutional layers. Intermediate output features from groups of adjacent slices were then propagated through neighborhood subnetworks network1,…, networkN, where weights are shared among the slice neighborhoods. Each subnetwork contained convolutional ResBlocks as well as convolutional attention modules to assist the model with localization. The resulting outputs from each subnetwork are aggregated using a weighted softmax function to generate a TSS classification for the entire image volume.
Machine Learning Model
A previously published machine learning (ML) method 12 was implemented for performance comparison. Beginning with infarct segmentation via normalized absolute thresholding, regions of interest (ROI) were used as the basis for radiomic feature extraction, using DWI and FLAIR series and a FLAIR-ADC ratio map. These features were subjected to univariate t-tests to extract the most informative features, and these selected features were fed into random forest, support vector machine, and logistic regression models.
Model Evaluation
The models were run in replication to generate a confidence interval for performance metrics, which include sensitivity, specificity, accuracy, and receiving-operator characteristic area under the curve (AUC). Repeated experiments account for randomness in machine learning and reflect the stability of the model performance. These statistics were compared to the corresponding metrics of the majority radiologist classification. Additionally, Fleiss’ kappa was calculated to measure the level of agreement among the three radiologist assessments. We also report the inter-label agreement between the clinically recorded TSS and the DWI-FLAIR mismatch. Both internal and external datasets have held out test sets used for all experiments.
To evaluate the clinical utility of the machine learning and deep learning algorithms, we conducted the following experiments: 1) training and testing on data from the same institution, 2) training on one institution’s data and testing on the other, 3) training on data from both institutions 22. For the last experiment, we investigated increasing the training set size by adding incremental amounts of external data and replacing training samples from the internal dataset with increasing amounts of samples from the external set. We report the performance on both internal and external test sets. We also sought to assess the concordance of a TSS classification model with one that evaluates DWI-FLAIR mismatch. Accordingly, we trained a DL model using the majority radiologist mismatch assessment as training labels, and we tested this model on the test set from the other institution.
Deep Learning Visualizations
We implemented three visualization methods used for model interpretability: occlusion sensitivity, class activation maps (CAMs), and integrated gradients. Each method provides unique feature importance maps for a given input. Occlusion sensitivity involves perturbing patches of input images and calculating the effect each perturbation has on the target class prediction23. To generate CAMs, an activation map is computed using the output from the last convolutional layer of the network; this serves to identify regions of the image that provide the greatest discrimination for the correct label 24. Finally, outputs are backpropagated through the network to create pixelwise maps of network gradients for individual input images. We also visualize the class activation map (CAM) and gradients generated via guided backpropagation 25.
Ethics Approval
This study was approved by the UCLA Medical Institutional Review Board #3 (MIRB3) under IRB#18-000329 “A Machine Learning Approach to Classifying Time Since Stroke using Medical Imaging”. Patient records were collected in accordance with IRB approval and HIPAA compliance standards. Informed consent was waived under Exemption 4 for retrospective data.
Results
Our study utilized two datasets. Of the internal set, 222 patients had a TSS under 4.5 hours, with the remaining 195 patients had a TSS over 4.5 hours. For validation, we utilized an external dataset totaling 355 patients, of which 182 underwent MRI within 4.5 hours of onset and 173 after 4.5 hours of onset 12. Additional details of these datasets are summarized in Table 1; the patient workflow is summarized in Figure 1.
Distribution of clinical demographics for the datasets: internal (left) and external (right, reproduced from 12). Represented as n (%) or median (interquartile range). NIHSS: National Institutes of Health Stroke Scale.
DWI-FLAIR Mismatch Assessments
Among the 130 patients assessed from both datasets, 37.8% (28/74) and 55% (31/54) of patients were found to have DWI-FLAIR mismatch in the internal and external test sets, respectively. Inter-reader agreement among the radiologists as pairs and collectively are summarized in Table 2. Fleiss’ was 0.460 for the internal dataset and 0.575 for the external dataset, which are both typically classified as a moderate level of agreement. Performance of the human readers, compared to time clock assessment, is illustrated in Table 3 for the internal and external datasets. The majority radiologist assessment of mismatch for the internal test set, when compared to the EHR-derived TSS, had low sensitivity (0.622) with high specificity (0.865). The aggregate assessment achieved higher accuracy (0.743) compared to the average accuracy of any individual radiologist (0.658). The mismatch assessments for the external test set had higher sensitivity (0.743) while maintaining a high specificity (0.800). For the internal dataset, the aggregate assessment achieved higher performance when compared to any individual radiologist.
Calculated using Cohen’s kappa, except for All Radiologists, which is computed Fleiss’ kappa.
Performance metrics for individual and aggregate radiologist assessments for the internal and external datasets. Rad: Individual Radiologist. Agg: Aggregate reading by radiologists.
TSS Classification Models
The performance results of the DL and ML methods trained on the internal, external, and combination training sets, are summarized in Table 4. As a result of the thresholding technique applied by the ML method, 204 patients out of 417 patients from the internal dataset had an extracted ROI, and 343 out of 355 patients from the external dataset had an extracted ROI. In total, 201 and 12 patients were excluded from these analyses, respectively. Additionally, the ML model selected different radiomics features depending on the dataset. By applying univariate t-tests on each of the features from positive and negative samples, only significantly different features were selected for the ML models. In applying these tests to 89 radiomics features, 37 features were selected for the internal training set and 35 were selected for the external training set. Only seven features were selected for both datasets. When compared to the radiologist assessments, both the ML and DL model had higher sensitivity, though lower specificity.
In our DL training, all cases were used. The internally trained model achieved an AUC of 0.768 (0.03), with an accuracy of 0.726 (0.02), a sensitivity of 0.712 (0.08) and a specificity of 0.741 (0.09). On the external validation dataset, the model achieved an AUC of 0.737 (0.03), an accuracy of 0.724 (0.04), a sensitivity of 0.757 (0.04), and a specificity of 0.679 (0.07). When trained on the aggregate, performance on both test sets improved, achieving an average AUC of 0.840 (0.03) on the internal dataset and 0.814 (0.01) on the external dataset. The average accuracy achieved on the combined test set was 0.794 (0.04), which is higher than the performance by the aggregate assessments of DWI-FLAIR mismatch by the neuroradiologists.
External Evaluation
The impact of external training data on model AUC is summarized in Figure 3. The model achieves lower performance on the external test set when no refinement is performed; however, the model can achieve comparable performance for both test sets when as few as 40 external samples are introduced into the training set. Moreover, when about half of the external dataset is added (160 patients), there is better performance on both the internal and external datasets. Intuitively, this corroborates the idea that deep learning algorithms achieve higher performance when trained on larger amounts of data and is illustrated in the second panel of Figure 3, where the performance on both cohorts did not improve with replacement of internal data with external data.
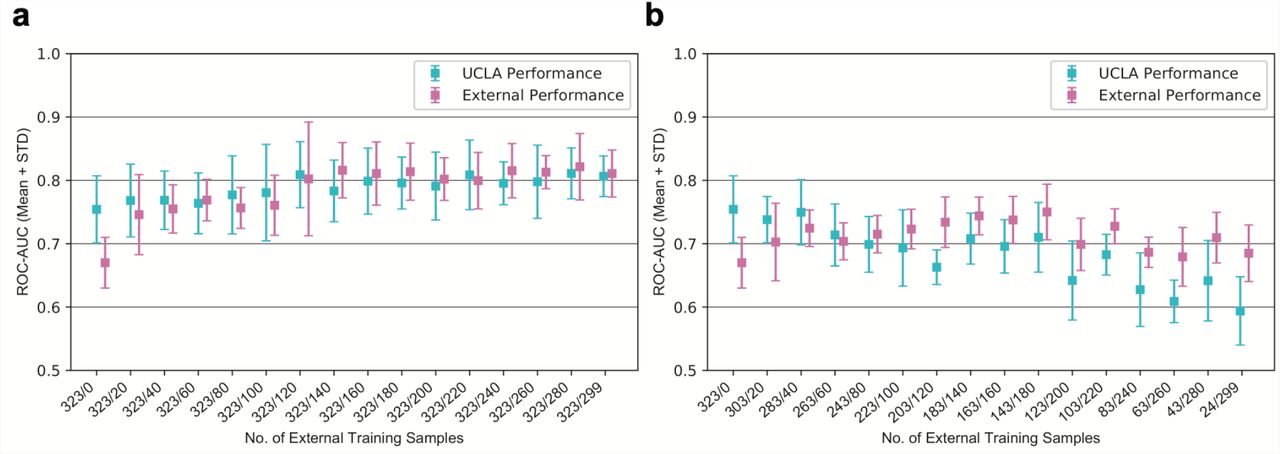
Performance of Models when Varying Training Data. Receiving-operator characteristic area under curve (AUC) of models with varying amounts of external training data, both when added to (a) or replacing (b) samples in the internal training set. Performance on both internal and external test sets are reported, in blue and pink, respectively, with 95% confidence intervals. Numbers on the x-axis indicate the number of internal/external samples used for training.
Deep Learning Visualizations
Visualizations were generated to reveal image regions on which the model focused. Four patients from our internal test set are shown in Figure 4. Figure 4A illustrates a case in which radiologist DWI-FLAIR assessment and TSS align with each other and the model prediction. The model does not solely focus on areas of high imaging signal, including the white matter hyperintensity seen on the FLAIR series, suggesting that our model localizes to lesions with other signal differences present. Figure 4B shows a case with a stroke onset time just under the 4.5-hour threshold that the neuroradiologists agreed contained no signal mismatch. In this instance, the model’s classification was outside the window. The gradients and CAM localize to the stroke lesion, while the occlusion method shows that areas outside the stroke volume were most salient to the prediction. Figure 4C shows a case just over the 4.5-hour threshold in which the radiologists were unanimous in identifying signal mismatch, despite the onset time being outside the window. Our model predicted this case to be within the treatment window. This discrepancy highlights that clock time may not encapsulate physiological state. Finally, Figure 4D shows a case well over the window for tPA. The radiologists agree that there is no mismatch, yet our model predicted that this case was within the window. The occlusion-based visualization shows that the model is unable to localize the stroke on either the ADC or FLAIR series. The class activation map (CAM) highlights that there is not a strong region of activation. Notably, the signal intensity of the stroke is relatively low, which may account for the model’s behavior. It is possible that changes to the preprocessing protocol may better distinguish the lesion and improve model performance for such cases. While these examples represent just four of the many cases in the test set, the visualizations enabled us to interpret the model beyond evaluation metrics and to gain insight into potential improvements.

Visualizations of the deep learning algorithm for four specific patients (a-d), ordered with respect to time since stroke onset (TSS). For each patient, three visualizations were generated: occlusion, guided backpropagation (GBP), and class activation mapping (CAM). The table below lists the TSS, age, radiologist-assessed mismatch, and prediction yielded by the model.
Discussion
Our experiments yielded several findings. The radiologists’ readings for DWI-FLAIR mismatch were in moderate agreement. Our DL model achieved higher average performance than any of the ML models and higher sensitivity than the majority vote radiologist readings. The model was also able to generalize to unseen external datasets. While there was a performance gap between internal and external test sets, retraining the model with small amounts of external data improved classification performance. When retrained on a small subset based on mismatch, the model achieved high sensitivity and overall better cross-validation AUC.
The relationship between TSS and imaging features has been studied extensively; nevertheless, it remains unclear which signal patterns accurately capture the time course of ischemic tissue. DWI-FLAIR mismatch was recently added as an eligibility measure for thrombolysis in the most recent treatment guidelines. In our study, the inter-reader agreement for DWI-FLAIR mismatch aligns with that found in previous studies26,27. Despite the neuroradiologists having an average of 12 years of experience, there was a high amount of variability, which could mean that a patient’s treatment options and therefore potential outcomes are reader dependent. Using TSS as the eligibility metric (“time clock”), the radiologist assessments identified 62% (23/37) of test set patients who were within the 4.5-hour window of stroke onset. The DL model, by contrast, identified 76% (29/37) of patients within the window of eligibility. If we evaluate our TSS labels using the majority radiologist assessment (“tissue clock”), the DL model identifies 68% (19/28) of the patients also identified by radiologists. We conducted preliminary experiments to dissect the differences between TSS and DWI-FLAIR mismatch, and we found that the model was able to learn the assessment labels with high performance. The lack of agreement among radiologists for the DWI-FLAIR mismatch assessments, along with the discrepancy between “tissue clock” and “time clock”, illustrate the need for more research into this relationship.
Our evaluation reports the average performance of 10 replicates and evaluates two methods on the same datasets, revealing insight into the generalizability of these algorithms. The DL model achieved higher performance statistics on external datasets than the currently published state-of-the-art.
Previous models, including the ML model evaluated in this study, have utilized segmentation models that identify the stroke region of interest from diffusion-weighted imaging 12,28. When compared to expert segmentation, performance of these methods has been fair, primarily under-segmenting the stroke lesion. Moreover, these methods fail to incorporate penumbral regions that could inform vascular stroke progression status 29. In contrast, the DL model utilizes the ipsilateral brain hemisphere, thereby including information from both the ischemic core and the penumbra Global cerebral circulation i.e., tissue outside diffusion-weighted lesions, may provide key insights into the tissue clock; additional research is needed to determine the role of collateral flow in determining salvageable ischemic tissue through thrombolysis. Additionally, it was determined that the ROI thresholding method may exclude cases; utilizing brain hemispheres also keeps more cases that would not be able to be analyzed due to ROI generation process.
When evaluated on external data, our model was able to achieve higher performance than the current state-of-the-art. For the ML model, the selection of statistically significant features in the training set may induce bias into the model that favors the training data; our DL model, in contrast, distills features from the entire input. There is still a performance gap between the internal and external datasets, which motivated our external validation experiments. Including all the data from the external dataset improves performance on the test sets, which indicates that a larger dataset overall has a synergistic effect, particularly when diverse populations comprise the training set.
Our study has several areas of potential improvement. While our dataset comprises the largest used for TSS classification from two institutions, it cannot fully represent all patients seen in practice. Our preprocessing ideally minimizes dataset variation, but further analysis is needed to assess applicability to all patient populations. Second, for our mismatch experiments, we were only able to evaluate this model for a small set of patients for which the radiologists assessed mismatch. A common bottleneck when using machine learning for medical image tasks is that acquiring the label, e.g., having multiple neuroradiologists assess images for DWI-FLAIR mismatch, is labor-intensive and may not be feasible on a large scale. Given that TSS is collected during standard clinical workflow, one potential area of future research could be to perform semi-supervised learning on stroke imaging to classify mismatch. Third, TSS is not a perfect surrogate biomarker, as it does not always correlate to underlying tissue changes informing ischemia 9. Nonetheless, given the low inter-reader agreement of DWI-Mismatch, a TSS classification using an automated method may aid the radiologist in clinical decision-making.
In conclusion, the proposed DL model allowed prediction of TSS based on MR images and achieved higher AUC than the ML model when external data was introduced, showing a more robust automated algorithm to determine stroke onset time. The results of this study indicate that a small amount of external data can improve generalized performance across test sets from multiple institutions. Moreover, the DL model can be refined based on revised labels. These findings support the future study of implementation of a deep learning algorithm for clinical decision support in the setting of acute ischemic stroke treatment.
Data Availability
The datasets presented in this article are not readily available due to protection of patient privacy. We are willing to validate other models internally on our data as part of collaborations. Program code and derived data (e.g., model weights) will be made available upon publication. Requests to access the datasets should be directed to the corresponding author.
Author Contributions Statement
J.P.., H.Z., S.E., W.S., and C.A. contributed conception and design of the study. J.P. & H.Z generated the first institutional dataset. N.K. and D.K. provided the second institutional dataset. K.N., B.Y., and N.S. performed imaging assessments. J.P. & H.Z. designed the deep learning algorithms and performed the comparative analyses. J.P. & H.Z. wrote the first draft of the manuscript. H.Z., W.S., K.N., and C.A. wrote sections of the manuscript. All authors contributed to manuscript revision, read, and approved the submitted version.
Data Availability Statement
The datasets presented in this article are not readily available due to protection of patient privacy. We are willing to validate other models internally on our data as part of collaborations. Program code and derived data (e.g., model weights) are publicly available at https://github.com/zhanghaoyue/stroke_tss_DL. Requests to access the datasets should be directed to the corresponding author.
Additional Information
Competing Interests
The authors of this manuscript declare relationships with the following companies: Kambiz Nael, MD, serves as a consultant for Olea Medical. All other authors declare that the research was conducted in the absence of any commercial or financial relationships that could be construed as a potential conflict of interest.
Acknowledgments
We thank Dr. Hyunna Lee and Dr. Eun-Jae Lee at Asan Medical Center, University of Ulsan College of Medicine, for sharing their de-identified dataset with us and making their code publicly available, enabling us to reproduce their method for this study.
References


