
Abstract
Lung cancer is the leading cause of cancer-related death in the world. In contrast to many other cancers, a direct connection to lifestyle risk in the form of cigarette smoke has long been established. More than 50% of all smoking-related lung cancers occur in former smokers, often many years after smoking cessation. Despite extensive research, the molecular processes for persistent lung cancer risk are unclear. CT screening of current and former smokers has been shown to reduce lung cancer mortality by up to 26%.
To examine whether clinical risk stratification can be improved upon by the addition of genetic data, and to explore the mechanisms of the persisting risk in former smokers, we have analyzed transcriptomic data from accessible airway tissues of 487 subjects. We developed a model to assess smoking associated gene expression changes and their reversibility after smoking is stopped, in both healthy subjects and clinic patients. We find persistent smoking-associated immune alterations to be a hallmark of the clinic patients. Integrating previous GWAS data using a transcriptional network approach, we demonstrate that the same immune and interferon related pathways are strongly enriched for genes linked to known genetic risk factors, demonstrating a causal relationship between immune alteration and lung cancer risk. Finally, we used accessible airway transcriptomic data to derive a non-invasive lung cancer risk classifier.
Our results provide initial evidence for germline-mediated personalised smoke injury response and risk in the general population, with potential implications for managing long-term lung cancer incidence and mortality.
Introduction
Through international efforts and public health campaigns the prevalence of cigarette smoking worldwide has substantially decreased during the last 30 years [1]. However, lung cancer remains a major cause of death in current and former smokers: over 40% of all lung cancers occur more than 15 years after smoking cessation [2,3]. Low-dose CT screening studies in asymptomatic smokers and former smokers, stratified for risk by age and smoking history, have shown a reduction in lung cancer related death by up to by 26% [4,5]. Although CT lung screening has been demonstrated to be cost-effective [6,7], improvements in risk stratification of participants could further improve cost-effectiveness thereby making screening more widely accessible.
Transcriptional profiles have been proposed as potential molecular biomarkers of a personalised smoke-injury response related to increased risk, and as potential predictors of the presence of lung cancer. Early studies in the bronchus provided a broad characterisation of the genes affected by cigarette smoke exposure [8] and their post-cessation reversibility [9], and included initial attempts to derive predictive cancer gene expression signatures [10]. Following the model of a ‘field of injury’ throughout the airway epithelium, later efforts focused on more accessible tissues from the nasal or buccal cavity to assess the personal smoke injury response [11,12]. Sridhar et al. [13] and Zhang et al. [14] provided initial evidence on 25 patients that nasal epithelium might act as a proxy for smoking-induced gene expression changes in the bronchus. More recently, the AEGIS Study Team presented a large multi-centre study in which they showed that a classifier based on gene expression in bronchial epithelium improved the diagnostic performance of bronchoscopy in patients being investigated for suspected lung cancer [15]. They followed this with a similar large study based on nasal gene expression [16]. They showed significant concordance between gene expression in bronchial and nasal epithelium, and that a lung cancer classifier based on nasal gene expression together with clinical risk factors had significantly improved performance over a classifier based on clinical risk factors alone.
Both of these studies addressed the important question of improving the diagnostic management of patients in whom lung cancer is already suspected, either on clinical or radiological grounds. Risk stratification for screening in the healthy smoker and former smoker population is an important but different question, for which a different classifier is required. For any such classifier, it would be an advantage to know the cellular mechanisms that underlie the classifier, and whether they are causally related to risk. That might open the way to risk reduction, and could be particularly relevant to the large burden of lung cancer that results from persisting risk in former smokers.
To answer those questions, our study provides an in-depth characterisation of the smoke injury response in the healthy population, and its differences to the response in a group of clinic patients under investigation for possible lung cancer. We have collected RNA-seq data from nasal and bronchial epithelial samples from 373 current and former smokers attending our lung cancer investigation clinics and from 114 healthy volunteer current, former, and never smokers from the Cambridge Bioresource. We analyse the long-term dynamics of gene expression in the nasal epithelium after smoking cessation, identify master regulators of transcriptional response to cigarette smoke and demonstrate key differences in smoke injury response between clinic-referred patients and healthy volunteers. We derive classifiers for assessing cancer risk in the clinic population as well as for predicting risk among the general population of asymptomatic current and former smokers. Using germline genotype data we associate individual differences in smoke injury response with known lung cancer GWAS risk loci, providing strong evidence for causal involvement of inherited variation in immune and interferon-related pathways, consistent with evidence for a role of immune escape in lung cancer development [17,18].
Results
Study subjects
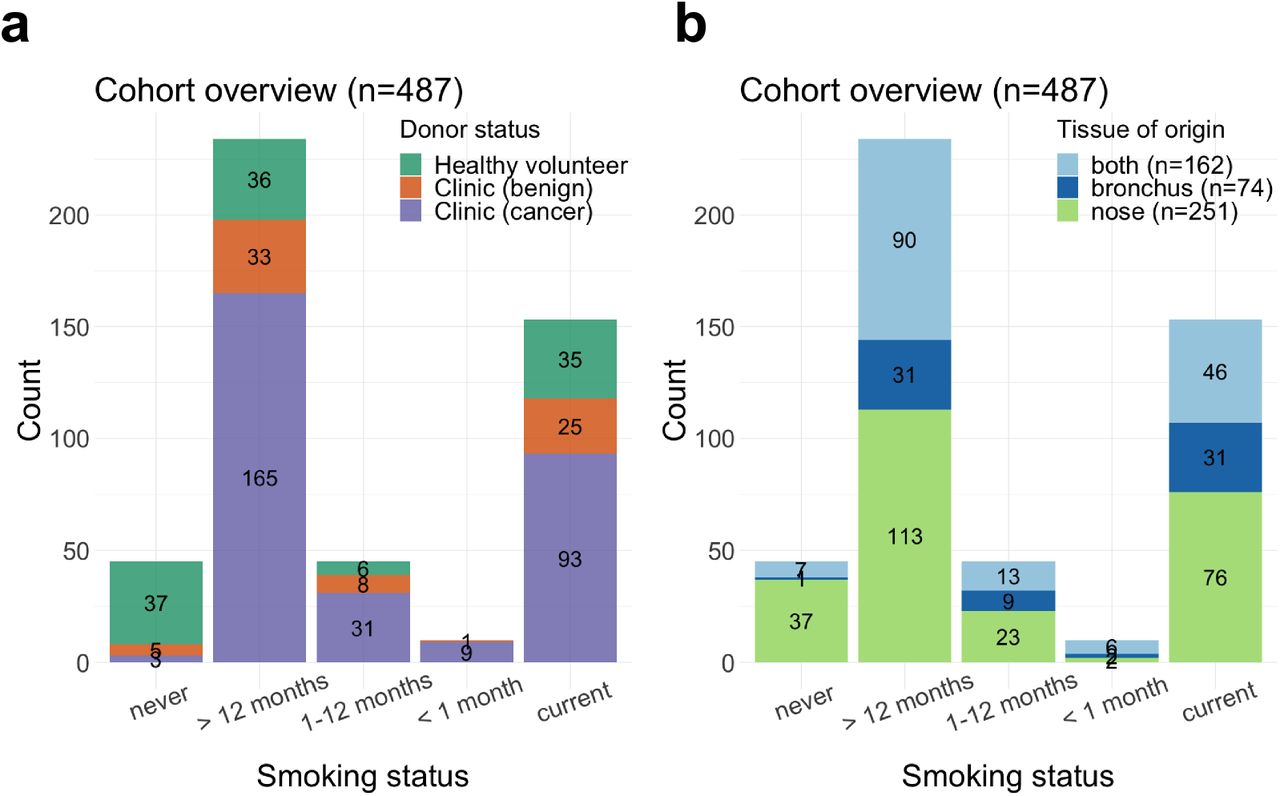
We recruited 487 subjects among which were 114 healthy volunteers from the Cambridge Bioresource (https://www.cambridgebioresource.group.cam.ac.uk/) and 373 patients referred to the out-patient clinic at Royal Papworth Hospital (Cambridge, UK) or Peterborough City Hospital (Peterborough, UK) on suspicion of lung cancer (clinic group). Within the clinic group, 301 were diagnosed with cancer and 72 had a final diagnosis of a benign condition, the majority of which were due to inflammation or infection (Sup. Tab 1). From these donors we collected a total of 649 samples: 413 nasal epithelial samples by mini-curette (Methods) from 114 healthy donors and 299 clinic patients, and 236 bronchial brushings from clinic patients. For 162 clinic patients both nasal and bronchial samples were collected (Table 1, Fig. 1a-b).

(a-b) Cohort overview: number of patients in each smoking status category, stratified by (a) disease status and (b) tissue of origin of the collected samples.
Smoking history was obtained for all subjects and recorded as never smokers (NV, n=45), current smokers (CS, n=153) and former smokers (FS, n=289). Former smokers were stratified into 3 categories based on their time from smoking cessation: former smokers who had quit less than one month (n=10), 1 to 12 months (n=45), or more than 1 year (n=234, median=168 months) prior to sample collection (Fig. 1, Methods). Cumulative smoke exposure was measured in pack-years, and stratified into 4 categories: none, 0-10, 11-30, >31 pack-years. In addition to smoking status, sex, age, lung cancer subtype and stage and presence of chronic obstructive pulmonary disease (COPD) were recorded according to the GOLD criteria (Table 1). While most clinic patients with cancer were diagnosed with non-small cell lung cancer (NSCLC; n=245), 56 subjects presented with metastatic disease from an extra-thoracic primary (n=8), small-cell lung cancer (SCLC, n=31), or a rare pulmonary cancer e.g. carcinoid (n=17). Given the different underlying biology between NSCLC and other types of tumour, these subjects (with cancer status marked as Ineligible in Table 1) were included in all analyses investigating smoke injury response, but were excluded for lung cancer risk prediction. Clinic patients with a final diagnosis of a benign condition were followed up for a minimum of 1 year to confirm absence of cancer.
Airway samples underwent RNA sequencing using standard protocols. Blood samples were taken from 467 subjects for germline genotyping with Illumina Infinium Oncoarray platform at 450K tagging germline variants. Total gene expression was quantified as variance-stabilised counts and corrected for batch effects in all downstream analyses (Methods).
Main contributors to gene expression in the airway epithelium
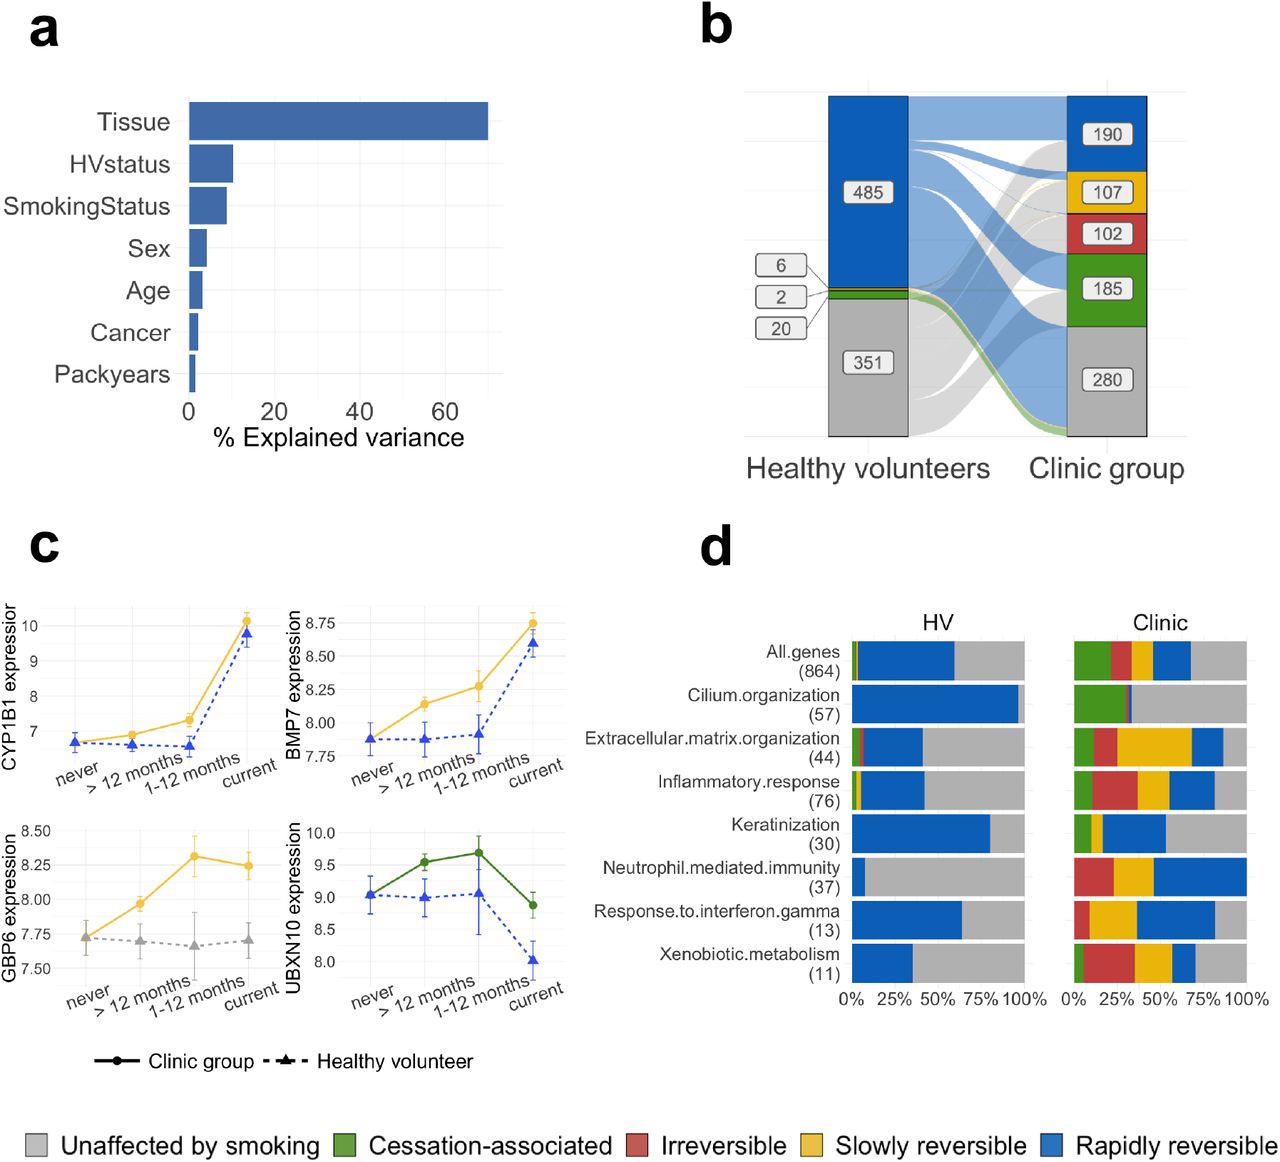
To assess the overall contribution of clinical and environmental variables to gene expression in the airway epithelium we first extracted variance components using a linear model regressing tissue, healthy volunteer status, cancer status, smoking status, pack-years, sex and age against total gene expression across 18,072 protein coding genes and all 649 samples (Methods). We found that tissue of origin contributes most to gene expression variability (70% of total explained variance, Fig. 2a), followed by healthy volunteer status and smoking status (10% and 9% of explained variance, respectively). In contrast, cancer status only accounted for 2% of the explained variance, behind sex and age. A similar trend was observed when considering nasal samples alone (n=413), with smoking status and healthy volunteer status being the major contributors to the total explained variance (32% and 29% respectively), and with cancer status accounting for only 12% (Sup. Fig. 1a).

(a) Contribution of different clinical variables to the total explained variance in gene expression calculated using a random model on all samples (for a comparison between tissues see Sup. Fig. 1); (b) Plot showing a change of reversibility dynamics for the same genes in the healthy volunteer (left) and clinic (right) donor groups; (c) Normalized gene expression over smoking status for 4 smoke injury genes with different post-cessation dynamics in the clinic and healthy groups, with linetype and shape representing donor status and colors representing the genes’ assigned reversibility classes; (d) Proportion of rapidly, slowly reversible, irreversible and cessation activated genes within different GO categories involved in smoke injury response. The top row shows the proportions for all smoke injury genes, and the numbers in parentheses give the number of smoke injury genes found in each GO category. In (b) and (d) genes classified as US in both donor groups were removed.
Differences in gene expression between clinic patients and healthy volunteers
We next tested for differential gene expression across all genes between the clinic patients (benign and cancer combined) and the healthy volunteers using nasal epithelium samples from both current and former smokers correcting for smoking status, pack-years, sex and age. We found major differences in gene expression between the healthy volunteer and clinic groups with 5359 genes differentially expressed (Padj < .05, Methods) after correction for confounders. Genes showing increased expression in clinic patients were enriched for cilium assembly and organization, while genes showing reduced expression were enriched for oxidative phosphorylation and several immune-related pathways, such as neutrophil activation, antigen processing and presentation and response to interferon gamma (Sup. Table 2). When performing the same comparison in current smokers only, similar enrichment was found in the genes with increased and reduced expression. In former smokers who had quit for more than 1 year, there was no increased expression compared to healthy volunteers for genes related to ciliary function, but there was reduced expression of genes related to immune pathways such as inflammatory response, neutrophil activation and response to interferon gamma. Our results suggest that an immunosuppressed state can be detected in nasal epithelium in subjects from the clinic group during active smoking and for years after smoking cessation.
In contrast, comparing gene expression between patients with and without cancer in the clinic group and accounting for the same confounding (analysing current and former smokers together) yielded only 28 significantly altered genes (Padj < .05, Methods) in the bronchus, and no significantly differentially expressed genes in the nose. Among the 28 differentially expressed genes in the bronchus, 3 were up-regulated in patients with cancer: MMP13, a metalloproteinase known to increase lung cancer invasion and metastasis [19], EDA2R, a member of the tumour necrosis factor (TNF) receptor superfamily, members of which modulate immune response in the tumour microenvironment [20], and CTSL, a lysosomal cysteine protease involved in epithelial-mesenchymal transition [21]. The 25 genes down-regulated in cancer patients were enriched in immune related GO terms, in particular neutrophil-mediated immunity (Sup. Table 3), consistent with our finding in the comparison between clinic patients and healthy volunteers in nasal tissue.
In summary, we observe major gene expression differences in nasal epithelium between healthy volunteers and clinic patients. However, we find only a limited signal when comparing patients with cancer with those with a benign diagnosis within the clinic group. This result is in contrast to that obtained in the AEGIS study [16], which reported a difference between cancer and benign. However this may be explained by differences in the nature of the benign diagnoses. In the current study the majority of non-malignant diagnoses were due to inflammation/infection whereas the AEGIS group also included cases of sarcoidosis, fungal and mycobacterial infections.
Characterising the smoke injury response in the nasal epithelium of healthy subjects
Individual differences in the airway response to smoke injury may arguably influence individual risk of cancer and persistence of some aspects of the injury response might contribute to the persisting risk after smoking cessation. We thus set out to describe the healthy smoke injury response and the time-dependent reversion of the expression levels of each gene after smoking cessation, to search for differences between individuals that correlate with risk. Using the 37 healthy never smokers as a baseline, and accounting for sex and age (Methods), we conducted a reversibility analysis on all 18072 protein coding genes through a Bayesian linear regression model which predicts gene expression in the nasal epithelium of healthy volunteers as a function of smoking status. This model was used to classify genes based on their behaviour in relation to smoking status and after smoking cessation. Genes with no discernible effect of smoking status on expression were classified as unaffected by smoking (US). Genes for which a difference in expression was observed in healthy current compared to never smokers were assigned to one of three reversibility classes: rapidly reversible (RR), if no difference was observed between former and never smokers; slowly reversible (SR), if a slope across the current and former smoker categories showed a trend of returning to never-smoker expression levels; irreversible (IR) if the expression difference between current and never smokers persisted after smoking was stopped. Hence, irreversible genes are dysregulated by cigarette smoke and remain dysregulated even years after smoking cessation. Finally, genes were classified as cessation-associated (CA) if no difference was present between current and never smokers, but elevated or reduced expression was observed in former smokers (see Sup. Fig. 2 for a schematic description of the model).
In healthy volunteers a total of 5755 genes were found to be affected by smoke and classified as rapidly reversible, slowly reversible, irreversible or cessation activated, out of which 513 genes show a strong difference between never smokers and current smokers, or former and never smokers in the case of cessation activated genes (effect size > 0.4 for rapidly reversible, slowly reversible, irreversible genes, > 0.25 for cessation activated genes, Methods, Sup. Table 4). The majority (485/513) of these genes were assigned as rapidly reversible, in line with previous findings in bronchial tissue [9]; 6 genes showed a slow reversal behaviour (CCK, STATH, CXCL13, SRCRB4D, CLU, PLCB2) and only 2 (SULF1, FRMD3) were found to be irreversible. Finally, 20 genes fell into the cessation-associated group. To evaluate this reversibility classification we performed a principal component analysis (PCA) of nasal samples’ gene expression values for genes in the rapidly reversible category alone and in the slowly reversible and irreversible categories together. PCA showed a clear separation of current smokers from all other subjects for rapidly reversible genes, while slowly reversible and irreversible genes placed patients on a trajectory from never smokers to current smokers, as expected (Sup. Fig. 3a).
Out of the slowly reversible genes, CXCL13 is of particular interest. It has been shown to play an important role in polycyclic aromatic hydrocarbon induced carcinogenesis [22] and only reverts slowly back to baseline levels in our cohort. Both the irreversible genes, SULF1 and FRMD3, are known tumour suppressor genes and both show downregulation in current and former smokers in our analysis. SULF1 is downregulated in many cancers and has been shown to impede angiogenesis and carcinogenesis both in vitro and in vivo [23]. FRMD3 is a tumour suppressor frequently silenced in NSCLC and has been shown to reduce clonogenicity [24]. Irreversibility of these genes in our analysis might point towards a mechanism for increased long-term risk of developing lung cancer even in the healthy population after smoking cessation. Within the 20 genes in the cessation-associated group, no global enrichment for any pathways could be detected, but the set included the Fragile-Site Associated Tumor Suppressor Homolog (FATS), a known regulator of TP53 activity and DNA damage response gene [25]. GO enrichment analysis (Methods) of the rapidly reversible genes revealed up-regulation of cellular detoxification, response to oxidative stress (e.g. CYP1A1, CYP1B1, AHRR, NQO1, GPX2, ALDH3A1) and keratinization (e.g. KRT6A, KRT13, KRT17, SPRR1A, SPRR1B, CSTA) pathways, and down-regulation of cilium organization (e.g FOXJ1, DNAH6, IFT81, CEP290, UBXN10), extracellular matrix organization (e.g. FN1, COL3A1, COL5A1, COL9A2) and interferon signaling (e.g IFI6, IFIT1, IFI44, RSAD2) pathways in current compared to never smokers. Genes involved in inflammatory response were found both among the up-regulated (IL36A, IL36G, S100A8, S100A9, CLU) and down-regulated (SAA1, SAA2, IL33) genes.
Differences in gene expression dynamics between the healthy volunteer and clinic groups
To identify deviations from the healthy smoke injury response in the clinic group, we repeated the reversibility analysis on clinic subjects, again using the healthy volunteer never smokers as a baseline. We found 4112 genes with smoking-dependent expression changes. Out of these, 584 showed strong differences between the healthy never smokers and the current smokers in the clinic group (effect size > 0.4 for rapidly reversible, slowly reversible, irreversible genes, > 0.25 for cessation-associated genes, Methods) and were selected for further analysis (Supp. Table 4). We evaluated our classification with a PCA on clinic subjects using the 584 genes, similar to what was done for healthy volunteers, (Sup. Fig. 3b), and found that patients clustered according to their smoking status, as expected. We also showed that these genes correctly separate bronchial samples from clinic patients according to their smoking status, confirming that smoke injury in nasal tissue mirrors smoke injury in bronchial tissue (Sup. Fig. 3c).
As expected, the genes identified in the healthy volunteer and clinic patients showed significant overlap, with 233 genes shared by both groups (chi-squared test P < .001). Interestingly, almost all genes in the healthy group showed rapid reversibility while many genes in the clinic group showed slow or irreversible behaviour (Fig. 2b). Within the 233 shared genes, 227 were rapidly reversible in the healthy volunteer group, but only 112 out of those 227 were also rapidly reversible in the clinic group. Of the remaining 115 genes, 22 genes became slowly reversible, one gene irreversible and 92 genes exhibited cessation-associated dynamics. Examples of genes rapidly reversible in healthy volunteers but slowly reversible in the clinic group include CYP1B1, a well known detoxification gene, and BMP7, a gene previously shown to have a role in immunoregulation [26] (Fig. 2c). A similar behaviour can be observed for WNT5A, up-regulated in our current-smoker group, whose overexpression has been shown to induce epithelial-mesenchymal transition and invasiveness in NSCLC [27]) and SUSD2, down-regulated in our current-smoker group, a gene identified as a tumor suppressor in NSCLC [28,29]. Finally, the 92 genes that were classified as rapidly reversible in the healthy volunteer group and as cessation-associated in the clinic group showed a strong enrichment for cilia structure and function (Fig. 2d, Sup. Table 5). Consistent with cigarette smoke damaging airway cilia, we observe down-regulation of cilia-associated genes in current smokers in both donor groups. In addition, cilia-associated genes show increased expression in the clinic group compared to the healthy volunteers, both in current and ex smokers. This increased expression of cilia genes in the clinic group might be due to the decreased expression of interferon gamma-related genes in the same group, as it has been shown that interferon gamma suppresses ciliogenesis and ciliary movement [30].
There were 351 genes with a smoking-dependent expression change in the clinic group that were found to have no smoking-dependent change in the healthy volunteers (Fig. 2b). These genes were strongly enriched in extracellular matrix organization and immune-related genes (including response to interferon gamma, neutrophil activation, chemotaxis and inflammation, Fig. 2d). One such example is GBP6, an interferon-induced gene whose expression is constant over smoking status in the healthy volunteers while being down-regulated in smokers in the clinic group and showing slowly reversible post-cessation dynamics (Fig. 2c). Down-regulation of GBP6 is known to be associated with reduced overall survival in squamous cell carcinoma of the head and neck [31]. These results are in line with the differences in immune response found between the clinic and healthy volunteer groups observed by differential expression analysis, and highlight again the presence of immune alterations in clinic subjects.
Overall, we observe a strikingly different response to smoke in the clinic patients compared to the healthy subjects, with generally slower reversibility post-cessation and a large number of alterations specific to the clinic group. From here on we define the union of the genes that show smoking-dependent expression changes in the healthy and clinic groups as smoke-injury genes (N=864), as they depict direct or indirect effects of smoke exposure.
Master regulators of the smoke injury response reveal irreversible alterations in immune response and inflammation
To better understand the differences in smoke injury response between healthy volunteers and clinic patients, and in particular the persisting changes after stopping smoking in the clinic group, we adopted a ‘master regulator’ approach. We inferred activity for all transcription factors (TFs) in nasal epithelium, using gene expression data and a nasal-specific interaction network (Methods). Analogous to the gene-level analysis, we then used our Bayesian model to categorise each TF into reversibility classes based on the dynamics of its activity over smoking status, separately in the healthy volunteer and clinic groups. In the healthy volunteer group we detected 155 TFs with smoking-dependent activity levels, all of which were classified as rapidly reversible. In the clinic group, we detected 171 smoking-dependent TFs. Forty-one of these were also found in the healthy volunteer group: 18 remained rapidly reversible, 4 switched to slowly reversible and 19 to cessation-associated. Overall, as with the gene-level results, we observed a shift toward slower reversibility in the clinic group: out of 171 smoke-injury TFs, 32 were classified as rapidly reversible, 56 as slowly reversible, 45 as irreversible and 38 as cessation-activated (Sup. Fig. 4a).
To ascertain that the identified smoke injury TFs accurately summarized the gene-level smoke injury response we tested for overrepresentation of all 864 smoke-injury genes identified in the healthy volunteer and clinic groups within the targets of each of the 285 smoke injury TFs. We found a significant enrichment for 130/285 TFs (Padj < .05, Methods). Around 70% of smoke injury genes (616/864) were contained within the targets of 25 smoke injury TFs (Sup. Fig. 4b). These “core” TFs can be considered master regulators of the smoke injury response. In a TF-TF interaction network based on the overlap of their targets (Methods), they form smaller groups and each group regulates one of the main biological functions we identified as disrupted by smoking: ciliary function, keratinization, oxidative stress response, extracellular matrix organization and immune response and inflammation (Fig. 3a, Sup. Table 6).
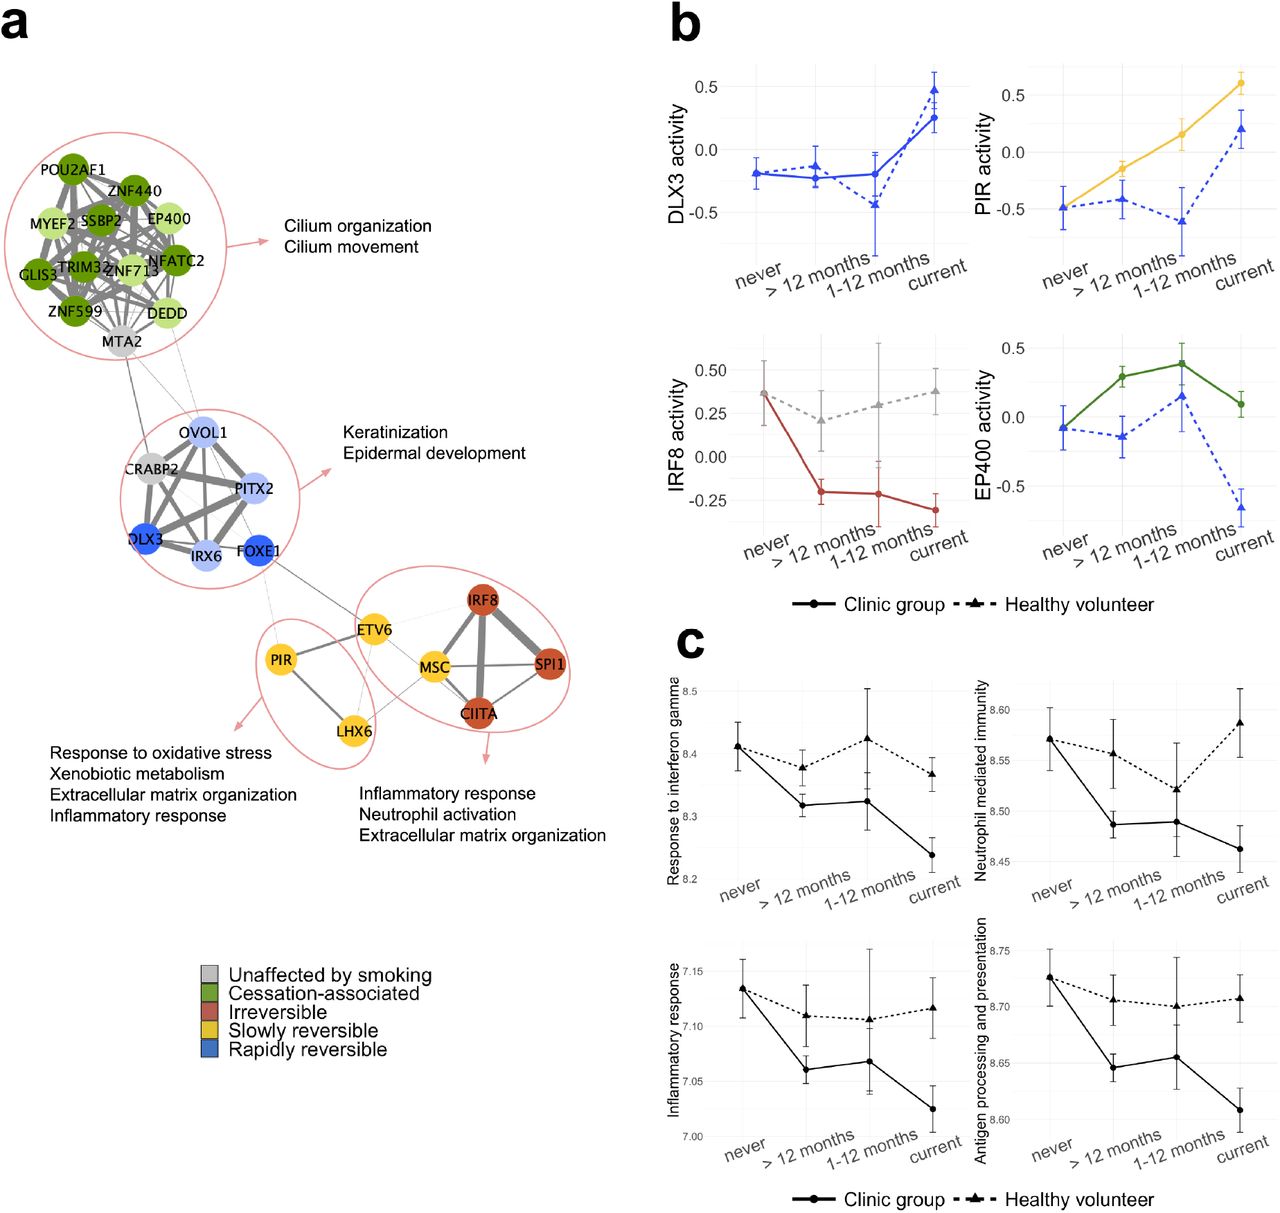
(a) Network representation of 25 “core” TFs summarizing the smoke injury response in nasal epithelium. Edge thickness indicates the overlap of TF target genes (Jaccard coefficient). Nodes are colored based on their reversibility class in the clinic group; a lighter color shade is used for TFs that are classified as rapidly reversible, slowly, reversible, irreversible or cessation associated but do not pass the effect size thresholds. (b) 4 TFs belonging to the 4 functional groups in (a) and their activity over smoking status in the healthy and clinic donor groups. (c) Comparison of geneset metascore over smoking status for 4 immune-related GO terms in healthy and clinic subjects.
Of the 25 core smoke injury TFs, 5 showed the same activity dynamics (rapid reversibility) in the healthy volunteers and clinic patients (2/5 pass the effect size threshold, see Methods); all of them belong to the group regulating keratinization. Keratinization is a mark of squamous metaplasia, a pre-neoplastic alteration of airway epithelium induced by exposure to cigarette smoke [32,33]. Rapid reversibility of these genes suggests that squamous metaplasia induced by smoke in the airway epithelium is quickly resolved once the damaging agent is removed. The remaining 20 master regulators have different reversibility classifications in healthy and clinic subjects. A group of 11 TFs change their classification from rapidly reversible in the healthy volunteers to cessation-associated in the clinic group (7/11 pass the effect size threshold, see Methods). These 11 TFs all regulate ciliary function confirming the trend observed at the gene-level. LHX6 and PIR, regulating xenobiotic metabolism and oxidative stress response genes, switch from rapidly reversible to slowly reversible in the clinic group, indicating that alterations of these pathways persist longer in clinic patients than in healthy subjects. Most importantly, 5 master regulators show no smoking-dependent change in healthy subjects, while being classified as slowly reversible or irreversible in the clinic group. As such, those 5 TFs highlight a major difference in smoke injury response between healthy and clinic patients. We find that those 5 TFs mainly regulate immune-related smoke injury genes, including interferon signalling genes, and have lower activity in clinic current and former smokers compared to healthy never smokers, suggesting that cigarette smoke induces an impaired immune response in clinic current and former smokers. Fig. 3b shows 4 examples of master regulator TFs and their differential dynamics in healthy and clinic subjects, one for each functional group on the TF network.
To further describe the overall reversibility dynamics of smoking-associated pathways, we aggregated the expression of genes belonging to 8 pathways of interest (Keratinization, Xenobiotic metabolism, Extracellular matrix organization, Cilium organization, Inflammatory response, Response to interferon gamma, Antigen processing and presentation and Neutrophil mediated immunity) to calculate geneset metascores (Methods). The metascore trends over smoking status were in agreement with the behaviour revealed for these functions by the TF activity analysis, with keratinization showing similar dynamics in the 2 donor groups and xenobiotic metabolism showing slower reversibility in the clinic group (Sup. Fig. 5). In particular, the dynamics of immune-related gene sets, namely response to interferon gamma, neutrophil-mediated immunity, antigen processing and presentation, and acute inflammatory response confirm that these pathways are uniquely disrupted in clinic patients, and that their activity does not revert to healthy never-smoker level even long after smoking cessation (Fig. 3c, Sup. Fig. 6).
Overall, these results indicate smoking-associated immune alterations to be a hallmark of the clinic group, and a potential contributor to lung cancer risk in both current and former smokers.
Risk gene expression levels predict disease status and may improve risk stratification for population screening
We postulated that the smoke-injury genes we identified might provide evidence for a personalised smoke injury response and act as candidate genes for a molecular biomarker of lung cancer risk. In the clinic group, where patients already show evidence of lung disease, such a biomarker would help identify patients with the highest need for further investigation (rule-in test). In the general smoker and former smoker population it could be added to existing methods of risk stratification to improve the identification of individuals who would most benefit from lung cancer screening thereby sparing those at lowest risk who would have least to benefit from screening (rule-out test).
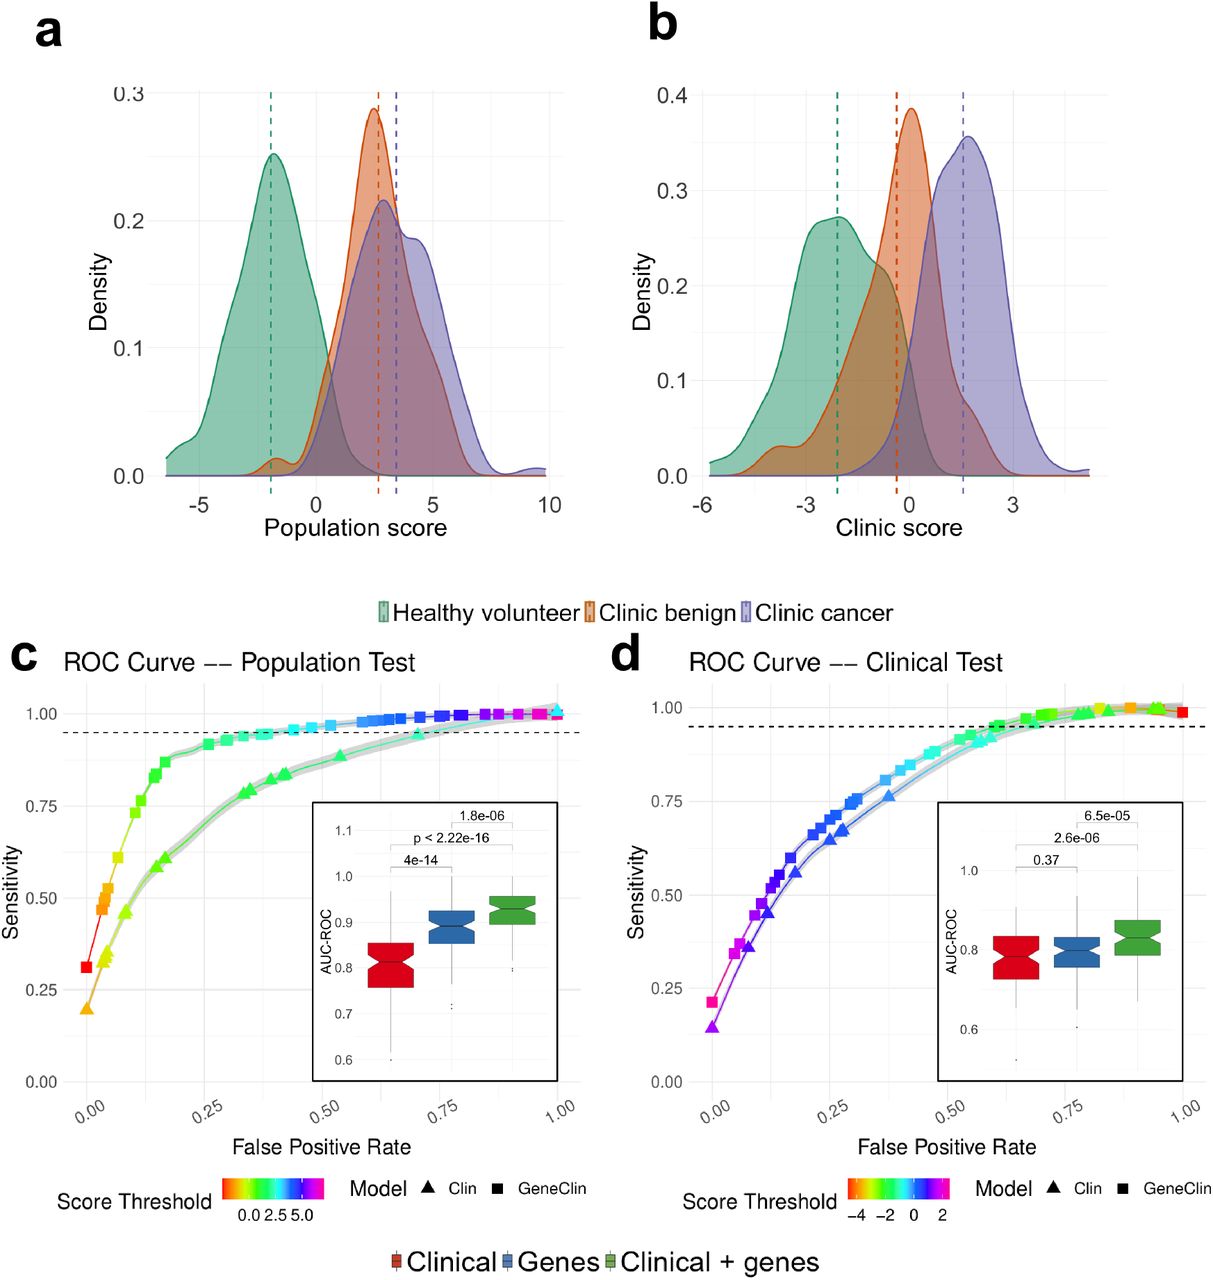
Therefore, we trained two independent classifiers: a ‘clinic classifier’ that predicts the cancer status of each sample (cancer vs clinic benign and healthy volunteer: potentially of use in the clinic), and a ‘population classifier’ that predicts the donor group the samples were taken from (clinic benign or cancer vs healthy volunteer: potentially of use in risk stratification for population screening). For both classifiers, we used gene expression data from genes that show different dynamics in the healthy volunteers and the clinic patients (n=749, named “risk genes” in the following) together with clinical information (sex, age, smoking status and pack-years; Methods) in a lasso-penalized multivariate logistic regression, and derived a log-odds score from each classifier. In line with the observed strong expression differences between healthy volunteers and clinic patients, the ‘population’ score clearly separates healthy volunteers from clinic subjects (Fig. 4a). Interestingly, the ‘clinic’ score (Fig. 4b) additionally distinguishes the benign and cancer patients within the clinic group, placing benign subjects between healthy volunteers and cancer subjects. As expected, the two scores are highly correlated (Pearson correlation = 0.8, P < .001, Sup. Fig. 7a). Both scores yielded high area under the curve (AUC) values for both precision-recall (clinic score: mean AUC-PR=0.83 after 10-fold cross validation; population score: mean AUC-PR=0.85, 10-fold cross validation, Fig. 4c-d) and receiver-operator characteristics (clinic score: mean AUC-ROC=0.84, 10-fold CV; population score: mean AUC-ROC=0.92, 10 fold CV, see also Methods) and performed significantly better than a model using the same number of randomly selected genes (Sup. Fig. 8). In practice, to reach a sensitivity of 95% for the population score, one would use a score threshold of 2.69, that would result in an average false positive rate of 42.8%, while to reach a similar sensitivity using clinical data alone would result in a false positive rate of 74.5%. For the clinic score, a score threshold of -1.46 gives a 95% sensitivity and false positive rate of 62.1%, while similar sensitivity with clinical data alone would result in a false positive rate of 67.8% (Fig. 4c-d). These results indicate that models incorporating gene expression data of the risk genes defined above performed significantly better than models built on clinical covariates alone (see also inset of Fig. 4c-d for a comparison of the performance of models based on gene expression data alone, clinical covariates alone or a combination of gene expression data and clinical covariates). In addition, both scores retained their ability to separate the patient groups after regressing out all potential confounders, confirming that gene expression data improves classification compared to using clinical covariates alone (Sup .Fig. 7b-c).

(a & b) Risk score distribution for the population test (a) and the clinic test (b) predicted from the clinical variables and the expression of the smoke injury genes using a penalized regression (See Methods). The risk distributions are presented separately for healthy volunteers (green), clinic patients without cancer (orange) and clinic patients with cancer (purple) (c & d) ROC curves for the population (c) and clinic (d) test. For each case, we present the ROC curve for the model trained on clinical data (triangles) or on gene expression and clinical data (squares). Each curve is an average obtained across 100 cross validation (CV) experiments and the grey area surrounding the curve gives the standard error. The color of the curve represents the test threshold corresponding to the represented Sensitivity / False Positive Rate compromise. (Inset) Area under the ROC curve, in 100 CV rounds, for a clinical-only model (red) the model constructed on the smoke injury genes (blue) and a model constructed on a combination of clinical information and smoke injury genes (green) for the population (c) and clinic (d) classifiers.
Finally, applying our two classifiers to previously published nasal gene expression data [16], we found a good separation between cancer and no cancer subjects despite the different technologies and populations of origin of the patients (Sup. Fig. 9a-b), although we found a stronger separation between cancer and no-cancer patients using the AEGIS nasal classifier [16] on the same data (Sup. Fig. 9c). However, we note that the AEGIS classifier [16], when applied to our data, mostly differentiates healthy volunteers and clinic patients while the difference between the scores of the cancer and no-cancer patients is only modest (Sup. Fig. 9d). These results confirm the performances of our classifiers, even when applied to patients from different clinical contexts.
We also assessed the performance of the trained population and clinic risk score models separately on current and former smokers. We found that the population risk score is equally applicable to current and former smokers: a significant difference in the risk score of the healthy volunteers and clinic subjects can be observed, even after regressing out clinical covariates and confounding (Sup. Fig. 10). While the clinic risk score performs well on both groups, the added value from gene expression data appears less important in the clinic score, in particular in former smokers (Sup. Fig. 11). Finally, we find that our classifiers are efficient at separating subjects regardless of their cancer stage, cancer type (squamous carcinoma or adenocarcinoma), and COPD status (Sup. Fig. 12), and that our classifiers capture differences in risk that persist for more than 10 years after smoking cessation (Sup. Fig. 13).
Overall, our results demonstrate that classifiers based on nasal gene expression have the potential to improve risk stratification of current and ex-smokers in both a population screening context and a clinic context.
Immune alterations drive the lung cancer risk classification
To gain insights into mechanisms of risk, we asked which genes and pathways robustly contribute most to the classifiers by identifying genes selected in more than 80% of the cross validation (CV) rounds (Fig. 5a). Among the 46 genes selected most often in either of the risk prediction models, we found genes that were previously identified as important players in lung cancer development, e.g. SAA2 [18], HAS2 [34], [35,36] or TGM3 [37–40], in line with the current literature.

(a) The weight of the genes selected in more than 80% of cross validations in the population and clinic classifiers; the presented value is the mean over all cross validation and the error bars represent standard deviation; the annotation track on the right shows the reversibility classes of the genes in the HV and clinic groups. (b-c) Correlation between the population (b) or clinic (c) risk score and geneset metascore for 6 gene sets representing biological functions altered by smoking; correlation is shown separately for current (blue) and former (red) smokers; shaded areas around the fitted line indicate 95% confidence interval.
The genes used as predictors of risk in our model reflect a wide variety of smoking-associated alterations. In order to gain some mechanistic insight, we investigated which altered pathways contribute most to the population and clinic risk scores. To do so, we used the geneset metascores calculated for the 8 previously mentioned smoking associated GO terms (Fig. 3c and Sup. Fig. 5). We then calculated the correlation between geneset metascore in each subject and subjects’ risk scores from the population and clinic models.
We calculated these correlations for current and former smokers (> 12 months) separately, to be able to identify differences in geneset contribution to risk in the two groups that might reflect differences between acute smoke injury response and the long-term consequences of past smoke exposure. In current smokers, while Keratinization and Extracellular matrix organization did not significantly correlate with either risk score, the remaining four genesets tested showed moderate but significant correlation with both risk scores, pointing to alterations of the xenobiotic detoxification pathways, ciliary function and immune response as major contributors to patient-specific differences in risk. In former smokers, the population risk score correlated with the same 4 GO terms indicating that detoxification pathways, ciliary function and immune response are the main contributors to the lung disease risk. In contrast, only pathways related to immune alterations (Response to interferon gamma and Neutrophil-mediated immunity) correlated with the clinic risk score in former smokers, while no correlation was observed with Xenobiotic metabolism, and only a very weak correlation with Cilium organization (Fig. 5b-c, Sup. Fig. 14). These results indicate that immune alterations are significant contributors to the risk of cancer in both current and former smokers in the clinic group.
Patient-specific genetic background modulates the smoke injury response
Germline genetic variation may influence individual differences in response to airway smoke injury, and hence, risk of smoking-related lung cancer. To investigate this, we first conducted an eQTL analysis on nasal and bronchial epithelium separately and jointly to identify variants that affect the expression of neighbouring genes (Methods). We obtained 990 (bronchial), 1316 (nasal) and 1695 (combined) eQTL effect genes (e-genes) at 1% FDR. We found a significant overlap between the nasal and bronchial e-genes (Sup. Fig. S15 a), with 574 genes in common (corresponding to 58% and 44% of the bronchial and nasal eQTL respectively, Fisher’s exact test P < .001). Similarly, we found a correlation of 0.56 between the adjusted p-values of the lead variants between both sets (Sup. Fig. 15 b), confirming shared cis-regulation between the nasal and bronchial epithelium.
To further study the interaction between subject-specific genetic background and environmental factors we next leveraged this eQTL catalogue to search for genetic variants within the 749 risk genes that might modulate gene expression differently depending on subjects’ smoke exposure. We identified 78/749 genes with at least one lead eQTL variant with genome wide significance at 10% FDR, (Sup. Table 7). We then tested for an interaction effect between smoking status and genotype for all 78 lead eQTL variants on gene expression. We identified 11 genes (CH25H, LHX6, WNT5A, DRAM1, SULF1, LGALS7B, HAPLN4, FXYD5, EFCAB2, TOX and SPRR1A, see Sup. Fig. 16) whose expression changes in response to smoke are modulated by the presence of genetic variants (nominal P < .1, Sup. Table 7), suggesting that those genetic variants might modulate the response to smoke injury and to lung cancer risk. For example, up regulation of FXYD5 has been shown to correlate with tumor size [41] and poor survival [42] in NSCLC and to be implicated in many cancer types as FXYD5 enhances NFk-B transcriptional activity, to promote angiogenesis and to increase tumor cell’s migration and invasion abilities [43]. Finally, this protein also promotes inflammation in epithelial cells, notably in lung tissues [44]. Analysing the expression of this gene in our cohort, we find that subjects with a homozygous reference genotype at the 19:35660670:G:A locus have similar levels of expression both in never, ex, and current smokers (Fig. 6). On the contrary, subjects that have a heterozygous or homozygous alternative genotype present higher levels of expression of this gene in response to smoke (Fig. 6), which might increase their lung cancer risk. We observe similar trends for the 10 other risk genes stated above (Sup. Fig. 16, Sup. Table 7). This finding demonstrates how subjects’ specific genetic background can influence their reaction to cigarette smoke and in turn might affect their risk of developing lung cancer.

For each nasal sample, we present the expression level of the gene FXYD5 separately for never (pink), former (green) and current (blue) smokers. Samples are further stratified depending on the genotype of the subject at the 19:35660670:G:A locus (Ref/Ref: homozygous reference; Ref/Alt: heterozygous; Alt/Alt homozygous Alternative). The p-value gives the significance level of an interaction effect of the smoking status and the genotype at the 19:35660670:G:A on the expression of the FXYD5 gene (see Methods).
Common germline variants regulate interferon gamma genes and are linked to known cancer risk loci
We next identified GWAS hits that were in strong LD in the UK population to SNPs that we found to be regulating the expression of nearby genes in our eQTL analyses (Methods). Among the 1261 GWAS lung cancer risk loci, our analysis identified 63 GWAS risk loci from 13 different studies with variants that significantly affect the expression of a nearby gene at a 5% FWER threshold (Sup. Table 8). These 63 eQTL/GWAS variants were linked to the expression of 41 genes, notably including 10 genes implicated in the interferon gamma signaling pathway. Pathway enrichment confirmed a strong enrichment for genes involved in response to interferon gamma (hypergeometric test, Padj = 7 × 10⁻¹³), as well as for other immune-related functions (e.g. innate immune response, antigen processing and presentation of exogenous peptide antigen, regulation of immune response, T cell receptor signaling pathway; see Sup. Table 9 for the full list of enriched GO terms).
To better understand the mechanisms by which GWAS variants might increase lung cancer risk, we searched for TFs whose regulatory targets were enriched for the 41 genes linked to a GWAS risk locus. We found 4 TFs showing a strong enrichment (hypergeometric test, Padj < .05, see Methods), ETV7, SPIB, IRF1 and CIITA (Fig. 7a), all of which are known players in the interferon gamma mediated signaling pathway [45–48].We further confirmed the enrichment of GWAS genes in these 4 TFs by using a wider list of GWAS genes with a relaxed eQTL cut-off (nominal P < .05), and still found a 2 to 3 fold enrichment in all 4 TFs (Table 2). Analyzing the activity of those 4 TFs in the nasal samples, we found significant differences between healthy subjects and clinic patients, confirming the importance of these 4 TFs in the progression toward a disease status (Fig. 7b, and see Sup. Fig. 17 for the activity of the same 4 TFs in the bronchial samples of clinic patients with and without cancer). In contrast, we found that the levels of activity of those 4 TFs were similar in clinic patients with and without cancer (Fig. 7b and Sup. Fig. 17). This could imply that the GWAS hits discovered in previous studies might be important in a wider array of lung diseases than lung cancer alone.
Overrepresentation of GWAS associated genes in the regulatory network of four TFs. Regulon size: the number of genes in the regulatory network for each TF; # hit: number of genes, among each TFs regulatory network that we annotate as a GWAS-linked gene (in parenthesis: expected number of GWAS genes in the regulatory network of the TF); FDR: False discovery rate of the overrepresentation of GWAS hits in the TF regulatory network (hypergeometric test, see methods). Each test is performed for 3 sets of genes defined using a hard (P <1e-06; 44 genes); lenient (P < .05; 569 genes) or no threshold (3181 genes) on eQTL significance levels.

GWAS enrichment analysis. (a) Network representation of the 4 bronchial regulons enriched in GWAS genes. The 4 TFs are shown as squares and their targets in the bronchial network as circles. Color of the nodes indicates whether the gene/TF is a smoke injury risk gene (blue), a gene that co-localizes with a GWAS hit (i.e. no threshold on eQTL significance) (red) or both (green). The level of overrepresentation for genes in the network of those TFs can be found in Table 2 (for the GWAS) and Table 3 (for the risk genes); (b) Activity level of each of the 4 TFs in nasal tissue, depending on the disease status of the patient.
We further tested whether those TFs enriched for our set of risk genes (defined here as genes whose reversibility classification is different between healthy and clinic subjects) and found that those 4 TFs are enriched for risk genes (2 to 3 fold enrichment, nominal P < .05, Table 3). Finally, the response to injury differs for those 4 TFs in healthy subjects and in the clinic group, since they are classified as slowly reversible (ETV7) or irreversible (CIITA, IRF1, SPIB) for our smoking reversibility analysis in the clinic group but as unaffected in the healthy volunteer group. Altogether, these findings suggest that in part the effects of inherited variation on lung cancer risk may be exerted through the inflammatory response to smoke injury, creating the cellular environment that favours the final steps to the emergence of a cancer.
Overrepresentation of the risk genes in the regulatory network of four TFs. Regulon size: the number of genes in the regulatory network for each TF; # hit: number of genes, among each TFs regulatory network that we annotate as a risk gene (in parenthesis: expected number of GWAS genes in the regulatory network of the TF); P-value: the p-value of the overrepresentation of risk genes in the TF regulatory network (hypergeometric test, see methods).
Discussion
In this study, we demonstrate that gene expression data from nasal epithelium has the power to improve lung cancer risk stratification within the healthy population of current and former smokers, extending prior results from studies conducted in subjects with symptoms suspicious for lung cancer [16]. Using healthy never smokers as a baseline, we have compared smoking-dependent patterns of gene expression between healthy volunteers and clinic patients under investigation for lung cancer. We have developed transcriptional classifiers to separate these groups, thereby revealing striking differences in the long-term persistence of gene expression patterns after smoking cessation. Using pathway and master regulator analysis, we have inferred the mechanisms that underlie these differences. We found known lung cancer risk loci to be enriched in specific pathways that were deregulated in response to smoking. These pathways included neutrophil mediated immunity and response to interferon gamma, suggesting that immune dysregulation is causally involved in the etiology of NSCLC. These results are consistent with recent efforts linking immune-related genetic variants to a variety of lung-related phenotypes [49]. Together, they support and extend the model in which genetically influenced differences in immune regulation interact with smoking and other injuries to create an airway cellular environment which is associated with impaired lung function and an increased risk of lung cancer.
We thoroughly characterized the smoke injury response in the healthy and clinic donor groups. In healthy volunteers, almost all of the genes which showed changes of expression with exposure to smoke reverted rapidly to the healthy never-smoker baseline after smoking cessation. The pathways affected (Fig. 2d) are largely consistent with those from other studies of ‘smoke injury genes’ [9]. In contrast, in the clinic group, a large proportion of the genes that showed altered expression in current smokers relative to the baseline of healthy never smokers returned only slowly or not at all to that baseline after smoking cessation (Fig. 2b). Importantly, almost all these slowly reversible or irreversible genes in the clinic group showed no significant smoke-dependent changes in healthy volunteers (Fig. 2b). This suggests that these genes might either be affected by smoking exclusively in higher-risk subjects, or exhibit an overall expression difference between individuals in the healthy and clinic groups, or a combination of the two. Most of these genes showed reduced expression in current smokers, and pathway analysis showed their enrichment for immune-related genes including response to interferon gamma, neutrophil activation, chemotaxis and inflammation (Fig. 2d). Analysis at the level of transcription factor activity within a nasal epithelium gene regulatory network showed a similar pattern (Fig. 3), suggesting a role for immune-depression in determining risk for lung disease.
Starting from genes exhibiting a different response to smoke in healthy and clinic subjects, we derived two lung cancer risk classifiers, with potential application in different clinical contexts. Our population classifier is, to our knowledge, the first to address specifically risk stratification for lung cancer in the healthy smoker population. With an average cross-validated AUC (ROC) of 0.92 (Fig. 4a,c), the classifier identifies 95% of high risk individuals with a false positive rate of around 40%. If confirmed, these figures suggest considerable value for population stratification. We validated our classifier using the AEGIS dataset [16] (Sup. Fig. 9). Even though the AEGIS cohort was microarray-based, and the samples derived from a different clinical context, we were able to separate individuals with and without cancer.
We further show that our classifier is effective in both current and former smokers (Sup. Fig. 10-11), and that clinic patients have an elevated risk score more than 10 years after smoking cessation (Sup. Fig. 13), consistent with the persisting cancer risk in that group [50]. The classifier is equally efficient at identifying individuals with early or late stage disease (Sup. Fig. 12b) and squamous or adenocarcinoma (Sup. Fig. 12a). The classifier must now be validated and possibly rederived in a population similar to that in which it would be used, for example in the context of a national lung cancer screening programme. There, it could be evaluated alongside lung function or other tests to determine the best combination of power and practicality in the prediction of future lung cancer risk. The clinic classifier gives a risk distribution in which the cancer, benign and volunteer groups form distinct but overlapping groups in the risk distribution (Fig. 4a). Of interest, when we applied the AEGIS classifier [16] to our cohort (Sup. Fig. 9d), it separated healthy volunteers from clinic patients rather better than it did the cancer from non cancer patients within our clinic group. This at first perhaps surprising result likely underscores the importance of the composition of the populations from which classifiers are derived and on which they are tested.
Using a geneset metascore analysis, we identified response to interferon gamma and neutrophil mediated immunity as the pathways that contribute most to our lung cancer risk scores (Fig. 5b,c) in both current and former smokers. While these results are correlative in nature, they were confirmed by our analysis on known NSCLC GWAS risk loci, that identified causal links between risk variants and the activity of four transcription factors known to be active in interferon gamma signalling (CIITA, ETV7, IRF1, SPIB). Finally, we also identified 10 genes whose response to smoke differed between healthy and clinic subjects and whose expression was regulated by a gene-by-environment interaction between the genetic background of subjects and their smoking behavior (Fig. 6, Sup. Fig. 13). These results demonstrate how subject specific genetic background can affect their ability to respond to smoke injury, and affect lung cancer risk, but larger cohorts will be needed to systematically explore the interaction between smoking behavior and the subjects’ genetic background genome-wide. Together, these results suggest a model for smoking-related lung cancer risk in which genetically determined differences in the immune and inflammatory responses to exposures including cigarette smoke modulate the bronchial cellular environment and increase the probability of progression towards cancer. The persisting risk in former smokers is, at least in part, driven by the persistence of this altered environment (Sup. Fig. 16). Individuals in which this environment is present are more likely to be symptomatic and to attend the respiratory clinic than others, whether they have cancer or not; hence the incomplete separation between benign and cancer within the clinic group.
Recent papers [17,18,51] have investigated the role of altered immune responses in the progression of preneoplastic airway lesions. Their findings will lead to better prediction and intervention in the management of patients already deemed at sufficient risk to justify bronchoscopic surveillance. Our study adds to that of Kachuri et al [49] by extending knowledge of the mechanisms that link risk to impaired lung function at the earlier stages of smoking-related lung cancer development, with implications for risk prediction, screening, and eventually strategies for risk reduction.
Methods
Availability of the code and data
Scripts that were used to conduct the analysis presented in this paper are available in the bitbucket repository accessible with the following link: https://bitbucket.org/schwarzlab/paper-debiase-massip-2021
Data will be made available upon journal publication.
Cohort and sample collection
487 donors were recruited into the CRUKPAP cohort at Royal Papworth Hospital, Cambridge (UK), including 114 healthy volunteers (HV) and 337 patients being investigated for suspicion of lung cancer. Participants were stratified into smoking cessation categories as follows: 45 never smokers (NV), 289 former smokers (FS) and 153 current smokers (CS). Former smokers were further divided into categories: > 1 year after cessation (FS1, n=234), 1-12 months after cessation (FS2, n=45) and < 1 month after cessation (FS3, n=10). Smoking history measured in pack years was recorded and stratified into four categories: ‘none’ (PY1), < 10 years (PY2), 10-30 years (PY3) and > 30 years (PY4). For suspected lung cancer patients, both COPD status and final cancer diagnosis (lung cancer / no lung cancer) were recorded.
From these donors 413 nasal epithelial curettages were collected using Arlington Scientific ASI Rhino-pro nasal curettes. Briefly, the nostril is opened with a nasal speculum to identify the inferior turbinate. Under direct vision the tip of the nasal curette is gently scraped over the turbinate to obtain a ‘peel or curl’ of epithelial tissue. The curl of tissue is then removed by flicking the curette while the tip is submerged in RNAlater™ collection medium and presence of the curl floating in the medium is confirmed by visual inspection. This procedure is repeated twice for each nostril per donor. RNA integrity (RIN) was checked for all samples and we found >80 % of samples to have RIN 6 or better.
Bronchial brushings were collected using 2.0mm brush diameter cytology brushes (Olympus Medical, UK) from 236 patients undergoing flexible bronchoscopy as part of investigations for suspected lung cancer.
For 162 donors, both nasal and bronchial samples were available. All samples underwent short-read total RNA sequencing using Illumina TruSeq library generation for the Illumina HiSeq 2500 platform. Blood samples were taken from 467 donors and germline genotyped using the Illumina Infinium Oncoarray platform at 450K tagging germline variants. Total gene expression levels (TPM and variance stabilised) were determined for 18,072 protein coding genes for all samples using DeSeq2. Research ethics approvals for sample collection from participants in this study were given by East of England Cambridge Central REC 13/EE/0012 and the National Research Ethics Service Committee South East Coast – Surrey 13/LO/0889.
RNA extraction and sequencing
Tissue samples from bronchial brushings and nasal curettes were stored in 500μl RNALater overnight at 4oC, and then at -80oC for longer-term storage. RNA was extracted using Qiagen MiRNeasy columns according to the manufacturer’s protocols. Briefly, bronchial brushes were rinsed in PBS, brushes transferred into 700μl Qiazol and cells lysed by vortexing twice for 30 seconds. For nasal samples the RNALater containing nasal tissue (500μl) was diluted with 2ml of PBS and spun at 10,000 rpm for 10 min. The cell pellet was lysed by resuspension in 700μl Qiazol. For both types of samples, the Qiazol lysate was applied to a QiaShredder tube (#217004) and spun at 13,000 rpm for 2 mins. The homogenate was kept at room temperature for 5 mins, followed by chloroform extraction using PhaseLock tubes. Nucleic acids in the aqueous phase were precipitated using 1.5 volumes of 100% ethanol and DNA was digested using DNAse I. Finally, RNA was isolated from the mixture using RNAeasy mini spin columns. RNA was quantified using a Qbit measurement and quality assessed using an Agilent Bioanalyzer. For samples with a RIN greater than 7, a total of 500ng of RNA was used for Illumina TruSeq Library generation. Sequencing was carried out on HiSeq 2500 Illumina sequencers. Sequencing was carried out in two separate multiplexed experiments.
RNA sequencing data processing
Alignment was carried out with TopHat2, using as reference the human genome version GRCh37. Read counts were computed for all protein-coding genes with subread featureCounts v1.6.0.
The data was produced in 2 experimental batches, producing a strong batch effect that can be observed in the raw data. Moreover, a group of samples from one of the batches has lower total counts compared to the other samples.
Raw counts were normalized using DESeq2’s variance-stabilizing transformation, which had the advantage of partly correcting the previously mentioned batch effects. Genes with across-samples log variance smaller than -4 were discarded from further analysis. Total gene expression levels (variance stabilised) were determined for 18,072 protein coding genes for all samples.
Variance components analysis and differential expression analysis
Variance components analysis was performed using R package variancePartition v1.16.1. Experimental batch effect was regressed out of the vst-normalized expression before extracting variance components.
All differential expression analyses were performed with DESeq2 v1.26.0. Age, experimental batch, sex and pack-years were included as confounding variables. Genes with multiple-testing-adjusted (Benjamini-Hochberg) p-values < 0.05 were considered differentially expressed. For differential expression between clinic cancer and clinic benign in bronchial samples, 8 genes had artificially high (>20) absolute fold-change, due to their very low average expression across samples. These genes were removed from the list of differentially expressed genes.
Modelling time-dependent dynamics of smoke injury in nasal tissue
Gene expression dynamics
To identify genes affected by smoke and characterize their post-cessation expression dynamics, we applied Bayesian linear regression and model selection (R package BAS v1.5.3). We modeled the expression of each gene on smoking status, where smoking status is encoded in 3 variables:
- CS (0/1) indicating current-smoker status
- FSS (0/1) indicating former-smoker status
- FS (0/1/2/3) indicating time since smoking cessation
Additionally, the model includes age, sex and experimental batch as confounding variables.

We tested for inclusion of each of the variables into our model and inferred posterior probabilities for all eight possible models to retrieve the most likely time dynamic of gene expression changes for each gene individually. Each combination, or group of combinations, corresponds to a gene class among unaffected by smoking, rapidly reversible, slowly reversible, irreversible and cessation-associated (Sup.Fig.2). Each gene is assigned to the class with the highest posterior probability. To identify genes for which smoking has the strongest effect, we applied a threshold on the beta coefficient, and retained only genes with a beta CS greater than 0.4 for rapidly reversible, slowly reversible and irreversible genes, and beta FSS greater than 0.25 for cessation-associated genes.
Transcription factor activity dynamics
A context-specific protein-protein interaction network for nasal epithelium was built using ARACNe-AP [52] on the vst-normalized expression data and a list of 1988 human transcriptional regulators, compiled using information available on public databases, from [53]. ARACNe-AP was able to infer nasal context-specific interactions across 1548 regulators. Activity of each of these regulators in each nasal sample was inferred using VIPER v1.20.0 [54]. A Bayesian regression and model selection approach was used, similarly to what described above, to model transcription factor activity on smoking status and assign each transcription factor to a reversibility class among non significant, rapidly reversible, slowly reversible, irreversible or cessation-associated. The same thresholds on effect sizes applied for the gene expression results were applied here.
To test for enrichment of the smoke injury genes within the regulons of smoke injury TFs, we performed a hypergeometric test; we corrected p-values for multiple testing using the Benjamini-Hochberg method.
Network representations of TF-TF and TF-targets interactions were produced with Cytoscape v3.8.1. For the network representation of the 25 smoke injury master regulators, the Jaccard coefficient was calculated for each pair of TFs as the intersection of the targets of the pair, divided by their union. Based on the Jaccard coefficient, the TFs appear to cluster in smaller groups on the network. We manually defined the groups, and performed functional enrichment analysis (with Gene Ontology terms) on the union of each group’s target genes to identify the biological functions regulated by each group.
Derivation of population and clinic risk scores
L1-penalized multivariate logit regression was performed with R package glmnet 3.0-2 using only the nasal gene expression data. Patients status was encoded with a binary variable (cancer: 1; no cancer 0 for the clinic classifier; Clinic patient: 1, Healthy Volunteer: 0 for the population classifier), and patients with Ineligible status were excluded from the analysis. In the gene expression classifiers, the status of each patient was predicted based on the expression of the 749 risk genes and 4 clinical covariates, namely sex, age, smoking status and packyears, all of which were encoded as numerical variables (smoking status encoding: Never smokers: 0, Ex >1year: 1; Ex 1-12months: 2; Ex <1m: 3, current smokers: 4). For the clinical classifier we also used a lasso regression, using only sex, age, smoking status and packyears as predictors. The lasso shrinkage parameter (λ) was chosen to minimize the mean cross-validated error (“lambda-min” option in the cv.glmnet function). Area under the receiver operating characteristic curve and precision recall curves were computed using the PRROC package, after 10 rounds of 10-fold cross validation experiments. To compare performances of the risk genes to performances on random genes, we randomly drew 20 sets of 749 genes among the 18,072 protein coding genes retained for all analyses, and cross validations experiments were conducted on the same test and training set as the one used with the risk genes.
Gene ontology analysis and pathway analysis
All Gene Ontology (GO) enrichment analyses were performed using clusterProfiler v3.14.3. GO terms with adjusted (Benjamini-Hochberg) p-values < 0.05 were considered enriched.
Pathway metascores were calculated by averaging vst-normalized gene expression of genes belonging to the selected genesets, after regressing out experimental batch effect.
Genotyping data pre-processing
SNP phasing and imputation
We phased the 450,000 germline genotypes using a statistical phasing algorithm (eagle v2.4.1) and population data from the 1000 genome project. For each haplotype, we then imputed missing genotypes using the minimac4 pipeline. This allowed us to impute the genotype of each subject at 46,000,000 positions. After filtering out SNPs with low imputation quality (Rsq<0.8), we were left with 7,650,214 SNPs in total for each sample.
LD Pruning
First, we only considered SNPs that have a minor allele frequency greater than 1% in our cohort, reducing the number of SNPs to 5,772,170. Next, we removed SNPs in strong LD. To do so, we filtered out SNPs with a Variant inflation frequency larger than 20, with VIF= 1/(1-r^2). This threshold thus corresponds to removing SNPs with a multiple correlation >0.95. VIFs are calculated on 50 SNPs sliding windows over the entire chromosomes. With this threshold, 4,728,931 (81.9 %) of the total 5,772,170 SNPs were filtered out, and 1,043,239 (18.0%) were retained.
eQTL Analysis
We computed the eQTL tests for the set of 18,072 protein coding genes for which we have sufficient coverage (see filter criteria for RNAseq data above). For each gene, we tested all SNPs in a 500kb cis window (500kb upstream from the TSS, 500kb downstream from the transcription termination site). For each test, we model the effect of known clinical and technical covariates (Sex, Age, Batch, Smoking Status and PacksYear) using a fix effect. All clinical covariates were encoded as numerical values (0-4 for smoking status, 0-3 for age and packYears, and binary 0-1 for sex and batch), and genotypes are encoded as a numeric variable (0: Ref/Ref; 1: Alt/Ref; 2: Alt/Alt). P-values were computed using the R package Matrix eQTL [55].We used a two step multiple testing correction procedure, as described in [56]. First, for each gene, we correct for the number of tests using Bonferroni correction. Second, we performed a global correction across the lead variants, that is, the most significant SNPs, per eQTL, using a Benjamini-Hochberg procedure.
Gene environment interaction test
To test for a combined effect of genotype and environment on the gene expression level of the smoke injury gene, we conducted an interaction test between the genotype background and the smoking status of the patient, encoded in a 0/1/2 form (Never/Ex/Current). For each of the 749 smoke-injury gene, we retrieved the lead eQTL variant identified in the genome-wide eQTL analysis, and tested for an interaction effect between the genotype encoded in a 0/1/2 numeric and the smoking status, correcting for the effect of age, sex, smoking status, packyears, and genotype.
Identification of GWAS-linked genes
To study the mechanisms by which germline genotype background influences the lung cancer risk, we adopted the approach developed by [57].We downloaded a curated set of 1261 GWAS lung cancer risk loci from the GWAS catalog [58] (see Sup. Table 10) and mapped genotyped and imputed SNPs of all patients to the nearest GWAS risk locus as follows. For each GWAS risk locus, we retrieved a list of variants in our cohort within a 500kb cis-window using a linkage disequilibrium (LD) cutoff of R^2>0.8 in the UK population using the Linkage Desiquilibrium Calculator of the ensembl website [59], yielding 9,739 candidate variants and 135,513 gene-SNP pairs. 3,455 of those 9,739 variants had a significant effect to their corresponding e-gene at a 5% FDR threshold. Many of those 3,230 hits were in LD with the same GWAS variant, such that all eQTL variants mapped to 67 unique GWAS risk loci (Supp. Table 8) from 10 different studies and were linked to the expression of 44 genes.
Gene Enrichment on the Transcription Factor Network
To find TFs that had an overrepresentation of GWAS genes in their target network, we used a context-specific TF-TF interaction network built using ARACNe-AP on bronchial vst-normalized gene expression data and a list of 1988 human transcriptional regulators (see above). For each TF i, we first counted the number (NG(i)) of genes in its target network that were identified as a GWAS gene. We then compared the proportion of GWAS genes in each TF target network to the expected number that would be found for a similar number of randomly selected genes with a one-tailed hypergeometric test using the phyper function in R with the following parameters: m: total number of genes in the network of TF i; n: 18,062 - m; k= the number identified of GWAS genes and q = NG(i), the number of GWAS genes in the target network of the TF i. Obtained p-values where adjusted for multiple testing using a Benjamini-Hochberg correction. We applied the same procedure to test for the enrichment of risk genes in the 4 identified GWAS TFs, although we did not correct the p-values for multiple testing this time since we conducted only 4 tests.
Data Availability
Data will be made available upon journal publication.
Author contributions
MSDB and FMas processed and analysed the data, interpreted the results and wrote the manuscript; TTW, FG, MOR and IS helped in data analysis and processing; RS contributed to experimental and study design; AS oversaw all sample and data collection; AG processed patient data and provided clinical classification; KM and FMar helped design and implement the study; RCR, BAJP and RFS designed, implemented and supervised the study, guided data analysis and wrote the manuscript; all authors agreed to the final version of the manuscript.
Competing Interests
FMar is founder, director and shareholder of Tailor Bio.
Acknowledgements
RFS, MSDB and FMas would like to thank the Helmholtz Association for support. FMas was supported by a postdoctoral fellowship of the Fondation pour la Recherche Médicale (SPE201803005264). TTW was funded by the Deutsche Forschungsgemeinschaft, CompCancer Research Training Group (RTG2424), project number 377984878. Computation has been performed on the HPC for Research cluster of the Berlin Institute of Health. Parts of this work were funded by CRUK core grant C14303/A17197 and A19274 (FMar lab). This work was funded by grants to BAJP from Cancer Research UK and by the NIHR Cambridge Biomedical Research Centre (BRC-1215-20014). The views expressed are those of the authors and not necessarily those of the NIHR or the Department of Health and Social Care. BAJP is a Gibb Fellow of CRUK and NIHR Senior Investigator. RCR is part funded by the NIHR Cambridge Biomedical Research Centre (BRC-1215-20014), Cancer Research UK Cambridge Centre and Royal Papworth Hospital NHS Foundation Trust. Healthy volunteers were recruited through the Cambridge Bioresource (www.cambridgebioresource.group.cam.ac.uk). We thank the Bioinformatics and Genomics Core Facilities of the CRUK Cambridge Institute for their excellent support; and Prof. Paul Pharoah for advice. We thank Dr Doris Rassl and Radhika Prathalingham for advice about sample quality and processing. We thank the Royal Papworth Hospital Research and Development Department and Papworth Trials Unit Collaboration for overseeing the clinical phase of the work including their staff, Jenny Castedo, Theresa Green, Anne Joy, Tania Pettett, Victoria Senior, Anne Thomson and Victoria Tuck for assistance with sample and data collection. We thank Drs David Meek, Nick Carroll and Brendan Dougherty for help with bronchial sample collection. And a special thank you to Dr Lori Calvert for co-ordinating sample and data collection at Peterborough City Hospital.
References


