
Abstract
We present a systematic assessment of polygenic risk score (PRS) prediction across more than 1,600 traits using genetic and phenotype data in the UK Biobank. We report 428 sparse PRS models with significant (p < 2.5 × 10⁻⁵) incremental predictive performance when compared against the covariate-only model that considers age, sex, and the genotype principal components. We report a significant correlation between the number of genetic variants selected in the sparse PRS model and the incremental predictive performance in quantitative traits (Spearman’s ρ = 0.54, p = 1.4 × 10⁻¹⁵), but not in binary traits (ρ = 0.059, p = 0.35). The sparse PRS model trained on European individuals showed limited transferability when evaluated on individuals from non-European individuals in the UK Biobank. We provide the PRS model weights on the Global Biobank Engine (https://biobankengine.stanford.edu/prs).
Introduction
Polygenic risk score (PRS), an estimate of an individual’s genetic liability to a trait or disease, has been proposed for disease risk prediction with potential clinical relevance for some traits[1,2]. Due to training data sample size increase and methods development advances for variable selection and effect size estimation, PRS predictive performance has improved[3–14]. Rich phenotypic information in large-scale genotyped cohorts provides an opportunity to systematically assess the predictive performance of PRS across a wide range of traits.
Here, we present significant sparse PRSs across 428 traits in the UK Biobank[15,16]. We applied the recently developed batch screening iterative lasso (BASIL) algorithm implemented in the R snpnet package[9], which takes individual-level genotype and phenotype data and performs variable selection and effect size estimation simultaneously, across more than 1,600 traits (consisting of binary outcomes, including disease outcomes, and quantitative traits, including biomarkers). We evaluated their predictive performance and their statistical significance, resulting in 428 significant (p < 2.5 × 10⁻⁵) PRS models. We find a significant correlation between the number of the genetic variants selected in the model and the incremental predictive performance compared to the covariate-only models across quantitative traits, but not for the binary traits. We assess the trans-ethnic predictive performance across individuals from non-British white, African, South Asian, and East Asian ancestry in the UK Biobank. We make the coefficients of the PRS models publicly available via the PRS map web application on the Global Biobank Engine[17] (https://biobankengine.stanford.edu/prs).
Results
Significant sparse PRS models across 428 traits
To build sparse PRSs across a wide range of phenotypes, we compiled a total of 1,617 traits in the UK Biobank and grouped them into trait categories, such as disease outcomes, anthropometry measures, and cancer phenotypes (Supplementary Table 1, Methods). We aggregated over one million genetic variants and allelotypes from the directly-genotyped variants[16], imputed HLA allelotypes[18], and copy number variants[19], and characterized significant sparse PRSs using the batch screening iterative lasso (BASIL) implemented in the R snpnet package[9] with age, sex, and genotype principal components (PCs) as covariates (Methods). We evaluated the predictive performance (r2 for quantitative traits and receiver operating characteristic area under the curve [ROC-AUC] for binary traits) and their statistical significance, which resulted in 428 significant (p < 2.5 × 10⁻⁵) sparse PRS models (Fig. 1).

(A) The full list of 1,617 traits with predictive performance is shown as a sortable table. (B) The predictive performance of PRS models for binary traits is summarized as PRS score distribution stratified by case/control status (left) and odds ratio stratified by percentile bin (right). (C) The predictive performance of PRS models for quantitative traits is summarized as a heatmap comparing the predicted risk score (Z-score) and observed trait value (left) and mean and standard error of trait values stratified by percentile bin (right). (D) The coefficients of the selected features are shown as a lake plot. (E) The predictive performance evaluation in training and test sets consist of individuals of white British ancestry, as well as additional sets consisting of individuals from non-British white, African, South Asian, and East Asian ancestry groups in the UK Biobank.
The basic covariates alone are already informative for phenotype prediction. To assess the incremental utility of PRSs, we quantified the incremental predictive performance by comparing the predictive performance of the full model that considers both genotypes and covariates and that of the covariate-only model across the 428 traits with significant sparse PRS. We found most traits have a modest increase in the effect sizes of the prediction with a few notable exceptions, such as celiac disease (ROC-AUC = 0.83 in the full model vs 0.57 in the covariate-only model, p = 6.0 × 10−163), hair color (red) (ROC-AUC = 0.96 vs. 0.56, p < 1 × 10−300), never smoker (ROC-AUC = 0.62 vs. 0.58, p < 1 × 10−300), heel bone mineral density (r2 = 0.20 vs. 0.05, p = 5.2 × 10−53), and blood and urine biomarker traits[20] (Fig. 2, Fig. 3).

The predictive performance (ROC-AUC for 242 binary traits [left] and r2 for 186 quantitative traits [right]) of the full models that consider both the genotype and covariates are compared against that of the covariate-only models, and their difference (the incremental predictive performance) are shown as a histogram.

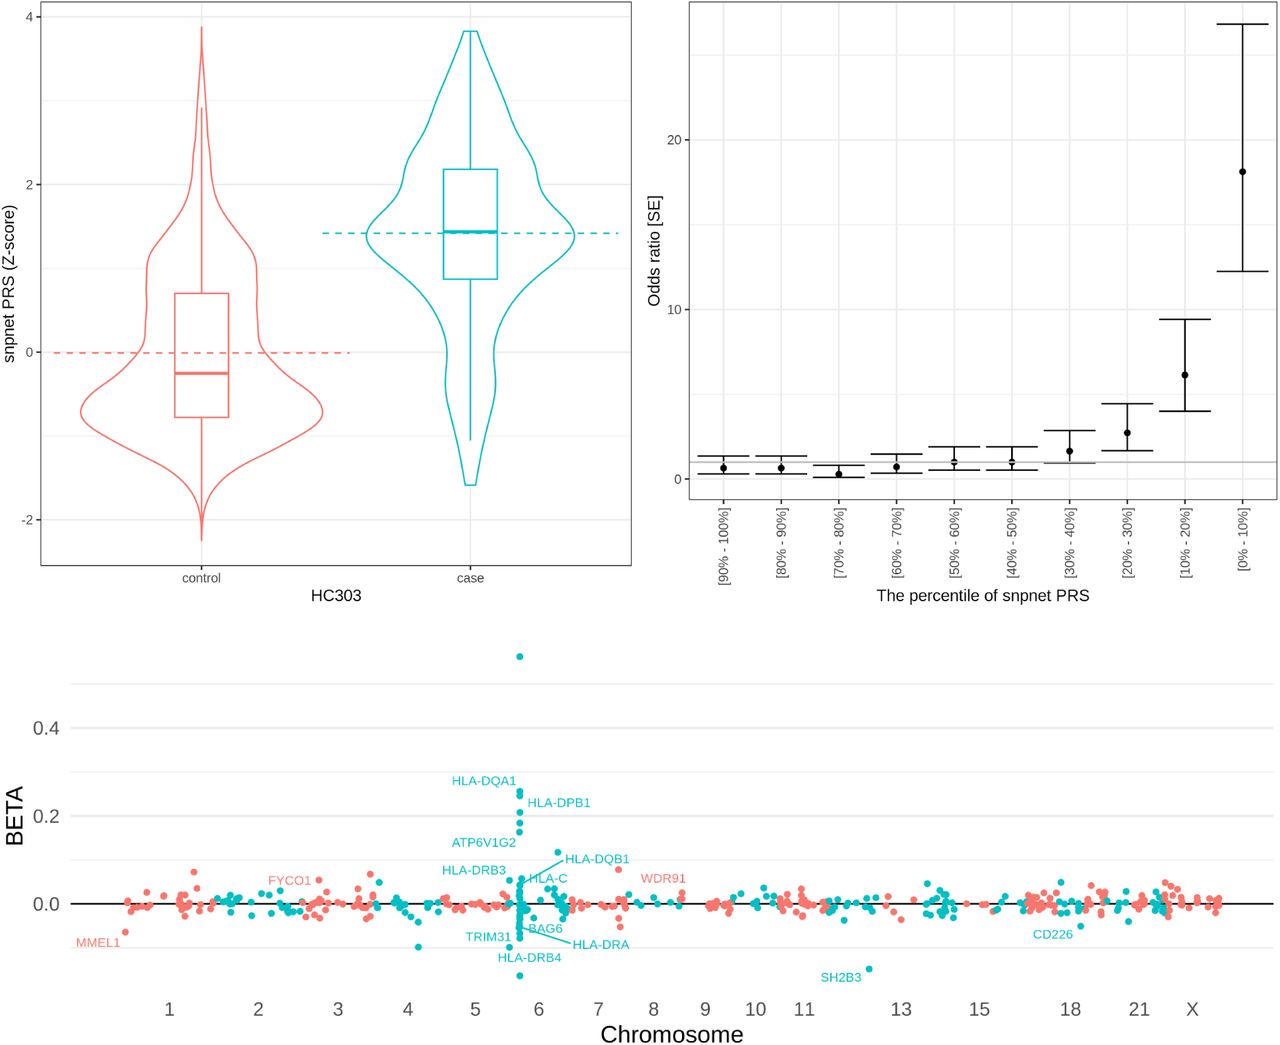
(top) the predictive performance of celiac disease PRS. (left) the celiac disease PRS distribution (y-axis) in a hold-out test set stratified by the disease case status (x-axis). (right) the odds ratio of the disease prevalence compared to the individuals with middle (40-60 percentile) PRS score stratified by PRS percentile bins. The error bars represent standard error (SE). (bottom) the coefficients of the celiac disease PRS model. The estimated effect size (y-axis) for each genetic variant (x-axis) is shown. For coding variants and HLA allelotypes with large effect size estimates, the gene symbols are annotated in the plot.
Sparse PRS models offer an interpretation of genomic loci underlying the polygenic risk
For celiac disease, an autoimmune disorder that affects the small intestine from gluten consumption, for example, the sparse PRS model consists of 428 variants that contain the imputed HLA allelotypes and variants near the MHC region in chromosome 6[16,18]. The PRS model also contains genetic variants in all other autosomes, including a previously implicated missense variant in the chromosome 12 (rs3184504, log(OR) = 0.15 in multivariate PRS model) in SH2B3 that encodes SH2B adaptor protein 3 involving in cellular signaling, hematopoiesis, and cytokine receptors[21] (Fig. 3).
The size of the PRS model is correlated with the incremental predictive performance in quantitative traits
The significant PRS models have a wide range of the number of variables selected in the model, ranging from only one variable for iritis PRS (HLA allelotype, HLA-B*27:05, at the well-established HLA-B*27 locus[22,23]) to 51,209 variants selected for standing height PRS (Fig. 4). We examined whether there is a relationship between the number of active variables in the significant PRS model and the incremental predictive performance. While the two quantities are significantly correlated in quantitative traits (Spearman’s ρ = 0.54, p = 1.4 × 10⁻¹⁵), it was not the case for binary traits (ρ = 0.059, p = 0.35), highlighting the presence of diverse genetic architecture across disease outcomes.

The number of the genetic variants included in the model (size of the model, x-axis) and the incremental predictive performance (effect size of the model, y-axis) are shown for binary traits (left) and quantitative traits (right). The two quantities are correlated only in quantitative traits (Spearman’s correlation test p = 0.35 for binary traits and p = 1.4 × 10⁻¹⁵ for quantitative traits). TTE: time-to-event phenotype.
Sparse PRS models exhibit limited transferability across ancestry groups
While the majority of the participants in the UK Biobank are of European ancestry, the inclusion of individuals from African and Asian ancestry enables an assessment of the trans-ethnic performance of the PRS models. In addition to the hold-out test set that we derived from the white British cohort, we focused on additional sets of individuals from non-British European (non-British white, n = 24,905), African (n = 6,497), South Asian (n = 7,831), and East Asian (n = 1,704) ancestry groups and quantified the incremental predictive performance of the PRS model and its difference against the hold-out test set derived from the white British cohort (Fig. 5). Overall, the incremental predictive performance was comparable for non-British white individuals, but the model suffers limited transferability for the non-European ancestry groups.

The incremental predictive performance (incremental AUC for binary traits [left] and incremental r2 for quantitative traits [right]) was quantified in individuals in different ancestry groups in the UK Biobank and was compared against that in the hold-out test set constructed from the individuals in white British ancestry group. (Top) the difference in the incremental predictive performance between the target group (x-axis, double-coded with color) and the source white British cohort. (Bottom) comparison of the incremental predictive performance in the target group (color) and that in the test set. A simple linear regression fit was shown for each ancestry group.
Discussion
In this study, we performed a systematic scan of polygenic prediction across more than 1,600 traits and reported 428 significant sparse PRS models. We compared the number of independent loci included in the model and their incremental predictive performance and found a significant correlation between the two across quantitative traits but not within binary traits.
Like other PRS approaches that consider datasets from one source population in the PRS training, our sparse model showed limited transferability across diverse ancestry groups[24,25]. When we assess the incremental predictive performance across ancestry groups by comparing the full model consisting of the genetic data and basic covariates and the covariate-only model, we found the binary traits, including disease outcomes, have lower transferability compared to quantitative traits, including biomarkers, blood measurements, and anthropometric traits.
Given the medical relevance[26,27], we prioritized pathogenic and likely-pathogenic variants reported in ClinVar[28] as well as predicted protein-truncating and protein-altering variants (Methods). Still, there is no guarantee that the genetic variants included in the sparse PRS models are causal variants, and it warrants further follow-up analysis with statistical fine-mapping and detailed characterization of functional data at each locus.
The increased availability of PRS models across multiple traits[14] exhibits a wide range of applications, including the improved genetic risk prediction of disease[20,29] and the identification of causal relationships across complex traits[30]. We provide the results on the Global Biobank Engine (https://biobankengine.stanford.edu/prs) and envision the resource will serve as an important basis to understand the polygenic basis of complex traits.
Methods
Compliance with ethical regulations and informed consent
This research has been conducted using the UK Biobank Resource under Application Number 24983, “Generating effective therapeutic hypotheses from genomic and hospital linkage data” (http://www.ukbiobank.ac.uk/wp-content/uploads/2017/06/24983-Dr-Manuel-Rivas.pdf). Based on the information provided in Protocol 44532, the Stanford IRB has determined that the research does not involve human subjects as defined in 45 CFR 46.102(f) or 21 CFR 50.3(g). All participants of the UK Biobank provided written informed consent (more information is available at https://www.ukbiobank.ac.uk/2018/02/gdpr/).
Study population and genetic data
UK Biobank is a population-based cohort study collected from multiple sites across the U.K[15]. We used genotype datasets (release version 2 for the directly genotyped variants and the imputed HLA allelotype datasets)[16], the CNV dataset[19], and the hg19 human genome reference for all analyses in the study. To minimize the variabilities due to population structure in our dataset, we restricted our analyses to unrelated individuals based on the following four criteria[27,31] reported by the UK Biobank in the file “ukb_sqc_v2.txt”: (1) used to compute principal components (“used_in_pca_calculation” column); (2) not marked as outliers for heterozygosity and missing rates (“het_missing_outliers” column); (3) do not show putative sex chromosome aneuploidy (“putative_sex_chromo-some_aneuploidy” column); and (4) have at most 10 putative third-degree relatives (“excess_relatives” column). Using a combination of genotype principal components (PCs) and the self-reported ancestry, we subsequently focused on people of white British (n = 337,129), non-British white (n = 24,905), African (n = 6,497), South Asian (n = 7,831), and East Asian (n = 1,704) ancestry as described elsewhere[20]. We further randomly split the white British cohort into 70% training, 10% validation (to select the optimal level of sparsity), and 20% test sets[20,32].
Phenotype definitions in the UK Biobank
We analyzed a wide variety of traits in the UK Biobank, including disease outcome[27,33], family history [27,33], cancer registry data[27], blood and urine biomarkers[20], hematological measurements, and other binary and quantitative phenotypes[31,32]. Briefly, for binary traits, we performed manual curation of phenotypic definitions to define the case and control status, and for quantitative traits, we took the median of non-NA values, as described elsewhere[31]. The list of 1,617 traits with at least 100 cases (for binary traits) or non-NA measurements (for quantitative traits) analyzed in this study is listed in Supplementary Table 1.
Construction of sparse PRS models
Using the batch screening iterative lasso (BASIL) algorithm implemented in the R snpnet package[9], we constructed the sparse PRS models for the 1,617 traits. We included age, sex, and top ten genotype PCs computed for the white British subset of individuals in the UK Biobank[20]. To prioritize coding variants over non-coding variants in linkage, we assigned three levels of penalty factors (also known as penalty scaling parameter)[34]: 0.5 for pathogenic variants in ClinVar[28] or protein-truncating variants according to Ensembl Variant Effect Predictor (VEP)[35]-based variant annotation; 0.75 for likely pathogenic variants in ClinVar or VEP-predicted protein-altering variants; and 1.0 for all other variants. In the regression model, we used the Gaussian family and the r2 metric for quantitative traits whereas we used the binomial family and the AUC-ROC metric for the binary traits as described elsewhere[9]. For each trait, we fit a series of regression models with a varying degree of sparsity using the training set and used the predictive performance evaluated in the validation set to select the optimal level of sparsity. Using the individuals in the combined set of training and validation sets, we refit the regression model with the selected sparsity as described before[9].
Significance and the trans-ethnic predictive performance of the PRS models
We evaluated the predictive performance and the significance of each PRS model independently. Specifically, we computed the score for each individual using both the PRS model consisting of genetic variants and the covariate-only model consisting of age, sex, and genotype PCs. For trans-ethnic evaluation of predictive performance, we refit the covariate-only model for non-British white, African, South Asian, and East Asian groups using age, sex, and the population-specific genotype PCs[20]. Across those individuals and the hold-out test set from white British individuals, we fit a regression model, trait ∼ age + sex + PCs + PRS, using a generalized linear model (with gaussian family for quantitative traits and binomial family for binary traits) and reported the p-value reported for the PRS term. We also computed the r2 or ROC-AUC value for the full model containing both covariates and PRS and the covariate-only model and computed the difference as the incremental predictive performance.
Correlation analysis of the number of genetic variants and predictive performance of PRS models
We applied Spearman’s correlation test implemented in R to assess the rank correlation between the size (the number of genetic variants included in the model) and the effect size (the incremental predictive performance) of the PRS model.
Data Availability
The sparse PRS model weights generated from this study are available on the Global Biobank Engine (https://biobankengine.stanford.edu/prs).
Author information
Author contributions
M.A.R. conceived and designed the study. Y.T. carried out the statistical and computational analyses with advice from J.Q, G.V., J.M.J., R.L., R.T., T.H., and M.A.R. Y.T., G.V., and J.M.J. contributed to the quality control of the data with advice from M.A.R. The manuscript was written by Y.T. and M.A.R., and revised by all the co-authors. All co-authors have approved the final version of the manuscript.
Competing financial interests
M.A.R is on the SAB of 54Gene and Computational Advisory Board for Goldfinch Bio and has advised BioMarin, Third Rock Ventures, MazeTx, and Related Sciences. The funders had no role in study design, data collection, data analysis, decision to publish, or preparation of the manuscript.
Data Availability
The sparse PRS model weights generated from this study are available on the Global Biobank Engine (https://biobankengine.stanford.edu/prs).
Code Availability
The BASIL algorithm implemented in the R snpnet package was used in the PRS analysis, which is available at https://github.com/rivas-lab/snpnet.
Supplementary Materials

Supplementary Table 1
List of traits analyzed in the study and the predictive performance of the corresponding PRS models. For the 1,617 traits analyzed in the study, the following information is shown: trait category, the phenotype ID in Global Biobank Engine (GBE ID), trait name, the types of link functions in a generalized linear model (gaussian for quantitative traits and binomial for binary traits), the predictive performance of the genotype-only model, covariate-only model, the full model that considers both genotype and covariates, as well as the incremental predictive performance (Delta[Full, covariates-only]), the number of genetic variants included in the PRS model, the statistical significance of the incremental predictive performance in a hold-out test set consists of a subset of white British individuals in the UK Biobank, and whether the p-value is significant after multiple-hypothesis correction (p < 2.5 × 10⁻⁵).
Acknowledgments
This research has been conducted using the UK Biobank Resource under Application Number 24983, “Generating effective therapeutic hypotheses from genomic and hospital linkage data” (http://www.ukbiobank.ac.uk/wp-content/uploads/2017/06/24983-Dr-Manuel-Rivas.pdf). Based on the information provided in Protocol 44532, the Stanford IRB has determined that the research does not involve human subjects as defined in 45 CFR 46.102(f) or 21 CFR 50.3(g). All participants of UK Biobank provided written informed consent (more information is available at https://www.ukbiobank.ac.uk/2018/02/gdpr/). We thank all the participants in the UK Biobank. This work has been supported by the Funai Foundation for Information Technology [to Y.T.]; Stanford University School of Medicine [to R.L.; Y.T.; and M.A.R.]; National Institute of Health center for Multi and Trans-ethnic Mapping of Mendelian and Complex Diseases [5U01 HG009080 to M.A.R]; National Human Genome Research Institute of the National Institutes of Health [R01HG010140 to M.A.R.]; National Institute of Health [5R01 EB001988-16 to R.T., 5R01 EB 001988-21 to T.H.]; and National Science Foundation [19 DMS1208164 to R.T., DMS-1407548 to T.H.]. The content is solely the responsibility of the authors and does not necessarily represent the official views of the funding agencies. Some of the computing for this project was performed on the Sherlock cluster. We would like to thank Stanford University and the Stanford Research Computing Center for providing computational resources and support that contributed to these research results.


