
Abstract
Food insecurity, defined as the lack of physical or economic access to safe, nutritious and sufficient food, remains one of the main challenges included in the 2030 Agenda for Sustainable Development. Near real-time data on the food insecurity situation collected by international organizations such as the World Food Programme can be crucial to monitor and forecast time trends of insufficient food consumption levels in countries at risk. Here, using food consumption observations in combination with secondary data on conflict, extreme weather events and economic shocks, we build a forecasting model based on gradient boosted regression trees to create predictions on the evolution of insufficient food consumption trends up to 30 days in to the future in 6 countries (Burkina Faso, Cameroon, Mali, Nigeria, Syria and Yemen). Results show that the number of available historical observations is a key element for the forecasting model performance. Among the 6 countries studied in this work, for those with the longest food insecurity time series, the proposed forecasting model makes it possible to forecast the prevalence of people with insufficient food consumption up to 30 days into the future with higher accuracy than a naive approach based on the last measured prevalence only. The framework developed in this work could provide decision makers with a tool to assess how the food insecurity situation will evolve in the near future in countries at risk. Results clearly point to the added value of continuous near real-time data collection at sub-national level.
Introduction
The 2030 Agenda for Sustainable Development, adopted by all United Nations Member States in 2015, calls for urgent action to “end hunger, achieve food security and improved nutrition and promote sustainable agriculture” [1]. However, in 2019, almost 690 million people were still undernourished [2], with 135 million in 55 countries and territories reported to be acutely food insecure [3]. These numbers have significantly increased as a consequence of the COVID-19 pandemic, with at least 155 million people reported to be acutely food insecure in 2020 [4].
An essential step towards achieving hunger reduction is to have access to frequent, up-to-date information on the status of food insecurity in countries facing humanitarian crises, and to estimates of where and when the situation is likely to improve or deteriorate, in order to allow for informed and timely decision-making on resource allocation and on relevant policies and programmes. For this reason, governments and international organizations perform food security assessments on a regular basis, by means of face-to-face surveys and, increasingly, through computer-assisted telephone interviews (CATI), or technologies like interactive voice response and web surveys. The World Food Programme (WFP) is currently monitoring the food security situation in near-real time in a number of countries at the sub-national level, collecting on a daily basis, through remote phone surveys, information on levels of food consumption and food-based coping, as well as other relevant indicators [5, 6].
This unprecedented availability of daily sub-national level data paves the way for new possibilities since it not only allows for a continuous up-to-date picture of the current situation, but could also be used to build predictive models to forecast how the situation will evolve in the future. In this study, we explore the forecastability of insufficient food consumption levels, and show that satisfactory predictions up to 30 days into the future can be obtained when enough daily sub-national level historical data is available for a given country.
Forecasting modeling has been the subject of extensive investigation during the last decade in different fields, from financial markets [7, 8] to infectious disease epidemiology [9, 10, 11, 12]. However, it is still a relatively new area of research in the context of food security. The Food and Agriculture Organization of the United Nations (FAO) developed a methodology to produce annual country-level estimates of the prevalence of undernourishment, and to project these estimates up to 10 years into the future [13, 2]. Okori and collaborators first proposed to use machine learning models to predict whether a household is in famine or not from household socioeconomic and agricultural production characteristics [14, 15]. The effort of predicting levels of insufficient food consumption has been tackled in the context of Malawi, in a study where the authors built a model trained on 2011 data to estimate the situation in 2013 [16], and more recently in a work proposing a model to nowcast sub-national levels of insufficient food consumption on a global scale [17]. Both studies propose methods to predict the current situation when primary data is not available, but they do not address the challenge of making projections for the future. The World Bank recently proposed a machine learning approach to forecast transitions into critical states of food insecurity [18] and a stochastic model to forecast famine risk [19]. These studies focus on forecasting month-to-month transitions to different phases of food insecurity, based on the Integrated Food Security Phase Classification (IPC) framework [20].
In this study, we tackle a different problem: forecasting the daily evolution of the prevalence of people with insufficient food consumption at the sub-national level. This metric, characterizing a given area at a given time, is obtained as the prevalence of households, in the specified area and time, that are identified to have poor or borderline food consumption. This prevalence is obtained from a representative number of household surveys enquiring about one of the core household food insecurity indicators, namely the Food Consumption Score (FCS), which captures households’ dietary diversity and nutrient intake [21]. Having access to reliable predictions of the evolution of insufficient food consumption levels over future weeks and months could allow governments and organizations to identify which areas should be monitored more closely and to eventually take timely decisions on resource allocation.
Results
Time trends of insufficient food consumption
We study the possibility of forecasting one of the core dimensions of food insecurity by means of a unique data set of daily sub-national time series of the prevalence of people with insufficient food consumption, in six countries in West Africa and the Middle East: Burkina Faso, Cameroon, Mali, Nigeria, Syria and Yemen (see the Methods for a detailed definition of the indicator under investigation). The length of these time series varies from a minimum of 407 days in Mali to 851 days in Yemen, over the years 2018-2021. Also, geographic coverage varies across countries. In the case of Burkina Faso, the prevalence of insufficient food consumption is available for all administrative units of the country, while only 3 states of Nigeria are included in our dataset (Adamawa, Borno, Yobe), given these are the most at risk areas closely monitored by WFP. Overall, our dataset covers 88% or more of the total population in all countries, with the only exception of Nigeria (see Supplementary Table S4).
As shown in Fig. 1, in the six countries, time trends of insufficient food consumption display noisy and irregular patterns, underscoring the complex dynamics underlying food insecurity. During the study period, all countries experienced large fluctuations in the prevalence of insufficient food consumption, and such variations were not uniform between sub-national administrative units. In Cameroon, for instance, only a few regions were characterized by a relatively high proportion of food insecure people, generally above 50%, but also exhibiting large fluctuations, such as the rapid decline and subsequent increase observed in the North-West regions. On the other hand, in Syria, the sub-national trends were all similar in terms of relative changes in the affected population, with a general upward trend affecting almost every province beginning in July 2020. In the governorates of Yemen, for which the longest time series are available, the proportion of the population affected by food insecurity varied between 20% and 60% during the years 2018-2020, however, a common national time trend is less recognizable.

Each panel displays daily time series of the percentage of people with insufficient food consumption in the first-level administrative units of Burkina Faso, Cameroon, Mali, Nigeria, Syria and Yemen. The six countries are highlighted in the map, and the orange shade indicates the areas that are considered by our analysis.
Permutation entropy and intrinsic predictability of food insecurity
We first quantify the intrinsic predictability of the time series shown in Fig. 1 by means of a permutation entropy analysis. Permutation entropy (PE) is a model-free measure of time series complexity [22, 23], that is conceptually similar to the Shannon entropy but is based on the frequency distribution of motifs. PE has been extensively used to assess the predictability of time series in different domains including finance and economics [24, 25], ecology [26] and infectious disease epidemiology [12]. In short, to compute the PE of a time series we translate its real valued sequence (x1, x2, …, xN) into a frequency distribution of symbols that represent patterns of relations xi < xj, xi = xj or xi > xj between nearest or distant neighbors, xi and xj. Such frequency distribution is then used to assess the predictability of the time series by computing the Shannon entropy associated with the distribution of permutation patterns in the symbols defined above. In the Methods section we provide a complete formal definition of the PE and its computation. It has been shown that PE can be considered as a measure of intrinsic predictability of a time series and its value is positively associated with forecasting error [26]. Intuitively, PE quantifies the information that is transmitted from the past to the present state of a time series: a time series that periodically visits the same few symbols among the many possible will have a low entropy and its present state will be easily determined from the past. A random time series that uniformly samples the symbols with equal probability will have a high entropy and its future will not be predictable from past states.
In the case of food insecurity, we find that insufficient food consumption trends are not easily predictable based on their past history. As shown in Fig. 2, their predictability, measured as χ = 1− H, where H is the PE, never reaches values above 0.5 and it is often reduced to 0.1− 0.2 within a 10-day horizon. These values are generally much lower than those observed in the case of infectious disease dynamics [12] and they are closer to measures of predictability of financial time series [27], which are characterized by a high short- and long-term volatility. Confidence intervals around mean predictability values are also narrow, highlighting a consistent lack of recurrent patterns in the insufficient food consumption time series across different time scales, which in turn highlights the presence of intrinsic entropy barriers to their predictability.

The average predictability χ = 1− H for daily trends of insufficient food consumption, in the six analyzed countries, is shown as a function of time series length in days. We average H over temporal windows by selecting 1,000 random points from each time series and calculating H for windows of length 10, 11, 12, …, 100 days. The solid lines indicate the mean value and the shaded areas mark the interquartile range across all administrative units and starting locations in the time series.
Forecasting food insecurity with secondary information
Following from the observation that insufficient food consumption trends are not highly predictable from their own history, we explore whether secondary information can be used to enhance our ability to predict their future evolution. To this end, we revert to information on the key drivers of food insecurity: conflict/physical insecurity, extreme weather events and economic shocks [4]. We build a set of indicators covering these three domains and develop a forecasting model based on gradient boosted regression trees (XGBoost) [28] to make predictions on how the insufficient food consumption trend will evolve up to 30 days into the future. More specifically, in our model we consider as predictors of insufficient food consumption the following indicators (see Methods and the Supplementary Information file for a full description). First, we include daily time series of the prevalence of people using crisis or above crisis food-based coping, which is obtained from another core food insecurity indicator, the reduced Coping Strategy Index (rCSI), by measuring the share of households with rCSI ≥ 19 [29, 20]. Since political unrest can affect food security, we include in our model daily time series of fatalities due to conflict or political violence as reported by the Armed Conflict Location and Event Data Project (ACLED) [30]. Economic shocks are included into the model by considering monthly variations in the price of cereals and tubers in local currency. The model takes into account the effects of weather events and climate conditions by including time series of rainfall, of its anomaly with respect to long-term averages (over 1 and 3 months), and time series of the Normalized Difference Vegetation Index (NDVI), a standard satellite-based measure of vegetation coverage that is commonly used for drought assessment [31], and of NDVI anomaly. Finally, since the food consumption behavior of most of the population in several African and Asian countries is affected by Ramadan, we include a time series that marks the days of the Ramadan period that fall within the time window used to measure people’s food consumption.
Fig. 3 shows the prediction results of the model for the case of Yemen, the country for which the longest time series of insufficient food consumption prevalence are available. In Yemen, cross-validated predictions can explain between 99% and 71% of the variation in insufficient food consumption, with the former being the variation explained by the 1-day into the future forecast, and the latter for the 30-day into the future one (Fig. 3a). This is a significant increase of R2 with respect to a naive prediction based on the last measured value only, which can only explain between 99% and 59% of the variation, and whose mean squared error (MSE) is larger and with a wider dispersion than the MSE of the proposed model (Fig. 3b). The scatterplot in Fig. 3c shows the performance of the forecasting model as the predicted insufficient food consumption value against the actual value, for different prediction horizons. As expected, dots get further away from the identity diagonal as the prediction horizon increases up to 30 days, although the general behavior is consistent with a good predictive accuracy.

The forecasting is performed over 10 different monthly splits of all governorates time series, from February to November 2020. (a) Box plots of the coefficient of determinations (R2) across the 10 splits for both the proposed and the naive models (in blue and orange, respectively), for each forecasting horizon. (b) Average mean squared error (MSE) across the 10 splits for both the proposed and the naive models for each forecasting horizon. (c) Predicted vs actual value for each data point in the 10 splits. Colors represent the corresponding forecasting horizon and vary from dark blue (1 day) to yellow (30 days) (d) Example of forecasting results for May 2020 in Sana’a (top) and Al Jawf (bottom).
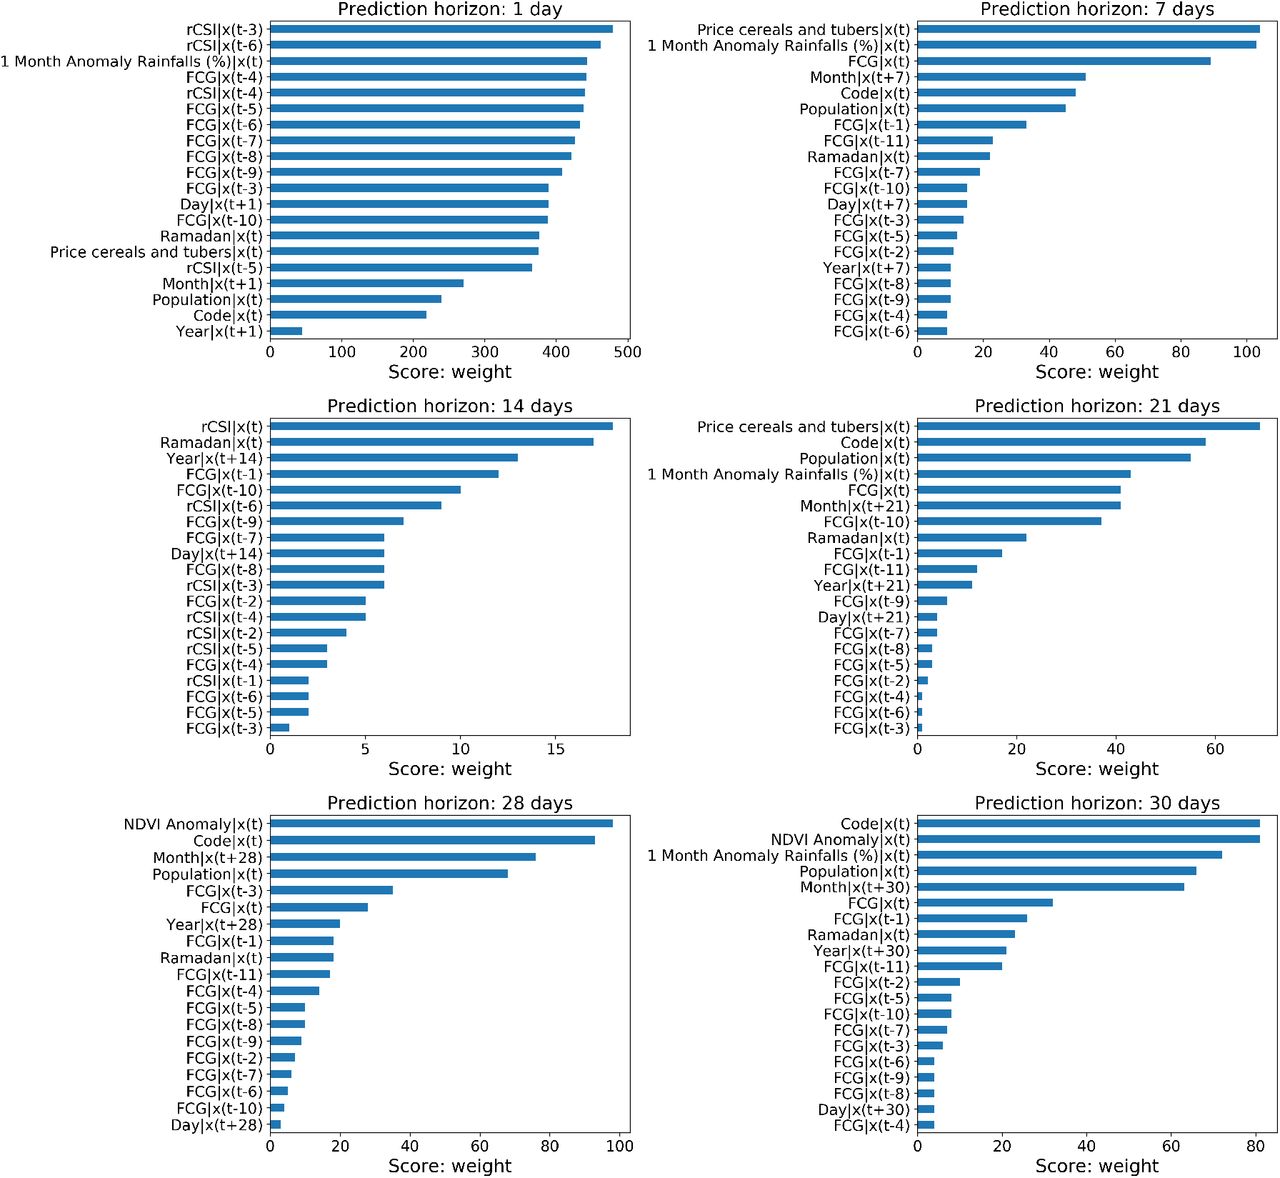
Over short forecasting horizons, typically less than 14 days, a naive approach proves to be a good enough predictor as we do not expect food consumption to suddenly change from one day to the next. However, as we try to forecast further into the future, we see that the forecasting model starts to outperform the naive approach, as shown in Fig. 3d for the case of two Yemeni provinces over a 30 day horizon. The improved performance of the forecasting model beyond the 14 day limit is mainly due to the inclusion of the exogenous indicators, which start to gain importance around the two-week time horizon (see Fig. 4). In particular, while past values of the target itself and of the food-based coping levels are the main features selected by the model to forecast insufficient food consumption from one day to the next, rainfall anomaly and the price of cereals become relevant for predictions from day 7 to 21. The NDVI anomaly, which measures changes in vegetation, becomes the most important feature on the 28 day horizon. Ramadan is always included among the top 20 most important features, reflecting the importance of religious practice in the Yemeni culture. Interestingly, although Yemen is a war-stricken country, fatalities are not selected among the most important features to forecast the prevalence of insufficient food consumption.

Each panel shows the relative importance of each feature included in the model, when the prediction task is defined on a specific time horizon (1, 7, 14, 21, 28 and 30 days). Feature importance is measured as the weight score assigned by XGBoost to the feature, that is the number of times a feature is used to split the data across all learning trees.
In the case of Syria, which has the same time series length as Yemen but half of the available governorates, the model still performs better than the naive approach, but the improvement is limited and the quality of the predictions rapidly decreases as the model tries to forecast insufficient food consumption more than a week into the future (R2 < 0.5, as shown in the Supplementary Fig. S19). For the remaining four countries, whose available time series are less than half the length, the model performance is worse than the naive approach across all prediction horizons, both in terms of R2 and MSE (see Supplementary Figs. S20 - S23).
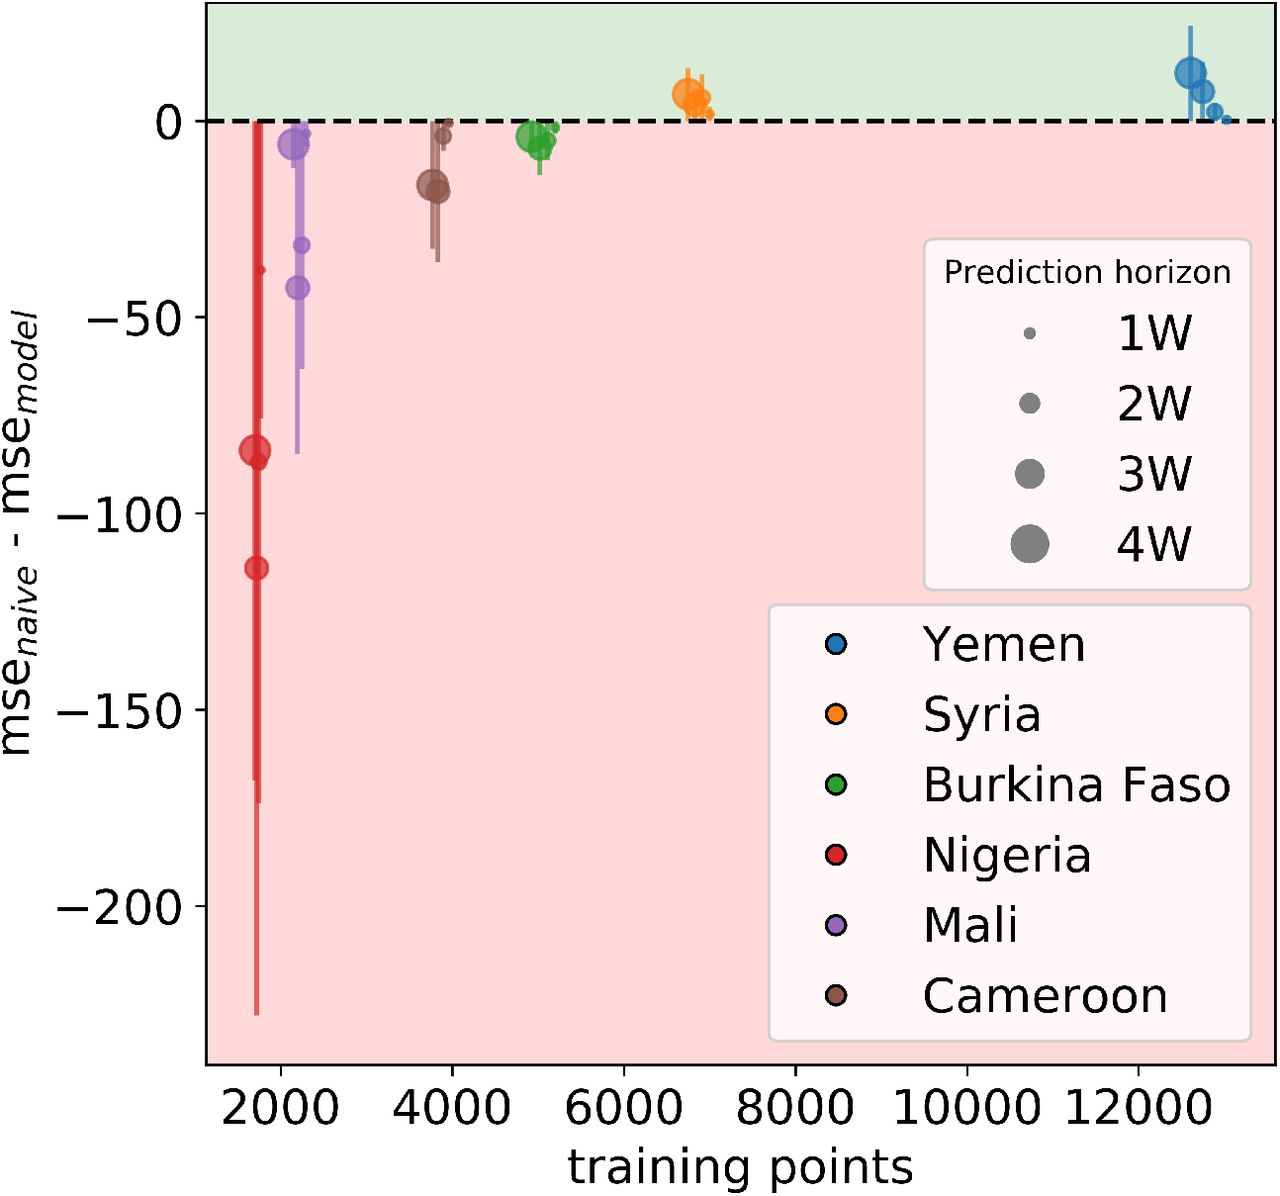
Given the relatively poor predictive performance of our models in countries with short time series of insufficient food consumption, we systematically examine how the performance varies as a function of the length of the time series available to train the model and of spatial coverage, indicating the number of sub-national areas. We find that, compared to the naive approach, the performance of our model dramatically increases with the number of available training points, which is given by the product of the two dimensions above: temporal length and spatial coverage (see Fig. 5). Moreover, with a given size of the training set, the proposed model tends to perform better than the naive approach as the forecasting horizon grows, demonstrating that, as expected, the model is better at predicting further into the future than just considering the last available measurement. However, this effect is evident only when a large training set is available (as in the case of Yemen, with more than 12,000 data points), and a small training set reduces the benefit of the model even over longer time horizons.

For the six analyzed countries and four different forecasting horizons (1 to 4 weeks), the figure shows the averaged differences between the MSE of the naive approach and the MSE of the forecasting model across the different splits, as a function of the size of the training set. Error bars correspond to the relative standard deviation. The green area indicates where our model outperforms the naive one, the red area indicates the opposite.
Discussion
In this study we addressed the critical challenge of forecasting the daily evolution of a food security indicator, namely the prevalence of people with insufficient food consumption, as measured by WFP. The problem promptly proved difficult given that the analyzed time series exhibit noisy and irregular behavior. This is to be expected since food insecurity in Sub-Saharan Africa and the Middle East is a highly dynamic phenomenon, comprising a seasonal component related to agricultural production calendars and religious observances such as Ramadan (during which consumption patterns are completely altered), but also subject to swift changes when external shocks hit, such as the emergence of conflict, extreme weather events or economic shocks [32, 33, 34].
Therefore, forecasting based solely on information on the historical evolution of the target indicator over time would not be successful, as demonstrated through a permutation entropy analysis. Hence, we extended the proposed framework to include historical information on the key drivers of food insecurity and built models that comprise both endogenous (insufficient food consumption itself, as well as food-based coping information) and exogenous factors (conflict-related fatalities, rainfall and vegetation and their anomalies, staple food prices and Ramadan’s occurrence). We showed that the proposed model makes it possible to forecast the prevalence of people with insufficient food consumption up to 30 days into the future with higher accuracy than a naive approach solely based on the last measured prevalence, at least in places where enough training data are available to inform the model. The number of available historical observations proved to be a key element in forecasting success. Even for places with more than 2,000 available training points, which is not an extremely large number but still enough to provide reasonable results in other contexts [35], the phenomenon seems to be too complex for the algorithms to learn meaningful patterns.
Forecasting research within the humanitarian context has only recently started to attract attention from scholars [36]. In this context, our study represents an initial step towards the application of forecasting approaches to food insecurity at a high spatial and temporal granularity. Our results confirm that nowcasting or one-step-ahead forecasting are feasible, as reported in recent studies [17, 19], but long-term forecasts are challenging and strongly conditioned by data availability. The methods presented in this study come with limitations, and they could be further improved through several approaches. First, more complex forecasting methods could potentially lead to a greater forecasting accuracy, for instance through the use of deep learning techniques [37]. Additionally, hybrid methods, combining both statistical and ML features, could achieve a better forecasting performance [35]. Finally, forecasting models could benefit from the inclusion of additional external predictors and in particular from the availability of novel data streams, such as mobile phone data or the automated text mining of news [39].
In conclusion, our study presents a simple, yet fundamental message for governments and humanitarian organizations on the power of the data they collect: collecting data on a regular basis for long enough periods of time and across enough different geographic areas does not only make it possible to monitor the evolution of a situation in near real-time but also to inform forecasting models that would make it possible to produce estimates of how the situation is likely to evolve in the near future. This means that decision makers would have access in advance to information on areas most at risk of a deterioration in the food security situation, allowing for a more timely response. Predictions should of course be used with caution and considered only as an indication of what may happen in the near future, hence informing preparedness efforts by suggesting a need for further in-depth assessments of the food security situation.
Methods
Target indicator
The indicator whose time-evolution we aim to predict is the daily prevalence of people with insufficient food consumption in a given sub-national geographical area. This prevalence is obtained as the share of households in the area that are found to have poor or borderline food consumption according to the Food Consumption Score (FCS) [21, 40]. The FCS is obtained through household surveys by asking how often, during the previous 7 days, a household has consumed food items from different food groups (main staples, pulses, vegetables, fruit, meat and fish, milk, sugar, oil and condiments). Consumption frequencies are then summed up in a weighted fashion, where each food group is weighted according to its nutritional level (with more nutritious foods having higher weights), resulting in the FCS. Thresholds are then applied to label each household as having poor, borderline or acceptable food consumption (as further detailed in Section 1.1 of the Supplementary Information), allowing to eventually compute the prevalence of people in a given area with insufficient (i.e. poor or borderline) food consumption.
The time series analyzed in this study are obtained through daily phone surveys. In order to compute a statistically representative prevalence of people with insufficient food consumption at sub-national and daily resolution, a rolling window approach is used. That is, for each geographical area, the prevalence of people with insufficient food consumption for a given day is obtained as the share of households with poor or borderline food consumption interviewed during the previous d days, where d varies by country (values are reported in Supplementary Table S2). Missing values in the time series are inferred through linear interpolation.
Permutation entropy
We employ the Permutation Entropy (PE) as a model-free measure of time series predictability [12]. The main assumption of this approach is to measure the Shannon entropy through the probabilities of encountering trend patterns within the time series. For this reason, the PE first categorizes the continuous time series X in a small set of symbols or alphabet according to their trends. Let x(i), i = 1, …, N, denote sequences of observations from a system X. For a given, but otherwise arbitrary i, m amplitude values Xi = {x(i), x(i+τ), …, x(i+(m−1)τ) } are arranged in an ascending order where τ denotes the time delay, and m is the embedding dimension. Each Xi is then mapped onto one of the m! possible permutations. The PE of the time series X is given by the Shannon entropy on the permutation orders:
 where pπ is the probability of encountering the pattern associated with permutation π. An important convenience of symbolic approaches is that they discount the relative magnitude of the time series [41]. This is important in our case because different geographical units can differ largely in food insecurity prevalence. The embedding dimension m and the time delay τ are to be set in order to derive a reliable state space. There exist different procedural approaches in order to deal with this setting decision [42, 43]. In order to find the appropriate embedding dimension for clustering a set of time series, we follow the instructions proposed by Scarpino & Petri [12]. The time delay is fixed to τ = 1 in order to get results from continuous intervals. Finally, the metric used is the predictability defined as χ = 1−H. The closer to 1 the χ is, the more regular and more deterministic the time series is. Contrarily, the smaller χ is, the more noisy the time series is. As suggested by Scarpino & Petri [12], we analyzed the predictability as a function of the length of each time series. Focusing on the predictability over short timescales, we average H over temporal windows by selecting 1,000 random points from each time series and calculating H for windows of length 10, 11, 12, …, 100 days.
Independent variables
Prevalence of people using crisis or above crisis food-based coping
This prevalence is obtained as the share of households in a given sub-national geographical area that are found to have a reduced Coping Strategy Index (rCSI) greater than or equal to 19 [29, 40]. The rCSI is obtained through household surveys by asking if and how often, during the previous 7 days, a household had to adopt the following coping behaviors: relying on less preferred or less expensive food, borrowing food from relatives or friends, limiting portion sizes, restricting adults’ consumption in order for small children to eat and reducing the number of meals eaten in a day. The rCSI is then obtained as a weighted sum of these frequencies, where weights are based on the severity of the strategy, as further detailed in Section 1.2 of the Supplementary Information. The survey data used to build this variable is the same as for the target indicator. A rolling window approach to compute a statistically representative prevalence of people using crisis or above crisis food-based coping at sub-national and daily resolution is also applied, and missing values are interpolated through linear regression.
Conflict-related fatalities
The number of conflict-related fatalities in a given geographical area is obtained from the Armed Conflict Location and Event Data Project (ACLED), a publicly available near-global repository of reported conflict events and related fatalities [30]. Since each daily value of the target indicator is based on data collected during the previous d days, the number of fatalities associated with the same date and area is also obtained by summing all fatalities reported in the same area during the same d days. Further details are reported in Section 1.3 of the Supplementary Information.
Market prices
Monthly prices of cereals and tubers are obtained from WFP’s publicly available Economic Explorer1. Cereal and tubers prices for each geographical area and date are obtained by averaging normalized prices (in local currency) across all markets within the area. Further details are reported in Section 1.4 of the Supplementary Information.
Weather variables
For each geographical area and date, we consider 10-day measurements of the following weather variables, obtained from WFP’s publicly available Seasonal Explorer2: the amount of rainfall in mm, its 1-month and 3- month anomalies with respect to the historical average during the same period of the year (expressed in percentage), the normalized difference vegetation index (NDVI), and its anomaly (defined as for rainfall but considering 10-days only since effects of previous rainfall are already integrated by vegetation itself). Further details are reported in Section 1.5 of the Supplementary Information.
Religious observances
Ramadan is a religious observance celebrated by that the majority of the population in the analyzed countries during which food consumption increases. For each date and geographical area we therefore create a variable that takes into account the number of days, within the d days considered to obtain the prevalence of people with insufficient food consumption for the same date and area, that fall within the Ramadan observance period. This variable therefore spans between 1 and n during and after Ramadan, and is otherwise equal to zero during the rest of the year.
Population
The latest population estimate provided by WFP for each geographical area is used as a static variable.
Geographical area identifier
Codes uniquely identifying each geographical area are also used as a static variable.
Temporal identifiers
Temporal information (day, month and year) on the forecasting horizon is also included.
A correlation analysis based on Spearman’s ρ and on the Variance Inflation Factor (VIF) was performed on this initial set of variables for each individual country in order to detect highly collinear features, as further detailed in Section 3 of the Supplementary Information. As a result of this process, the rainfall 3-month anomaly was removed from all country-specific datasets, the NDVI from all but Nigeria’s, and the NDVI anonomaly from Mali’s (see Supplementary Table S6).
Forecasting
The core of this work revolves around the forecasting effort focusing on predicting the evolution up to 30 days into the future of our insufficient food consumption time series3. To this aim, we chose to use the eXtreme Gradient Boosting (XGBoost)4 algorithm [44]. The wider context of machine learning approaches used in the time series forecasting field and a more in-depth description of XGBoost can be found in Section 4 of the Supplementary Information.
Since XGBoost does not support a multi-output design, we developed 30 different models, one for each prediction horizon. For each date, the prediction framework is trained to predict levels of insufficient food consumption for a given day into the future based on the information available up to the date under consideration. For further details, see Section 4.1 of the Supplementary Information.
In order to implement our forecasting model based on the usual three stages of training, validation and testing, we adopt a k-fold cross-validation approach in a time-ordered fashion (i.e. the evaluation stage is applied to different historical periods). The validation phase is implemented by splitting each of the n splits of training points of each sub-region into two time order preserving sets: the first 80% samples are used for training and the remaining ones for validation. Validation is performed independently across splits ensuring an unbiased approach. Our validation scheme aims to optimize the prediction framework by acting on two main configurations: model hyper-parameters and feature selection. The aim of this optimization is to find the configuration that returns the best performance as measured on a validation set. See Supplementary Table S8 for a detailed list of the explored hyper-parameters and values, and Supplementary Table S7 for the detailed list of independent variables and time lags considered. For further details, see Section 4.2 of the Supplementary Information.
Finally, in order to assess the goodness of the proposed forecasting model, its performance on the test sets is compared with a naive approach, where the predicted value at any given forecasting horizon is simply given by the last available value in the training and validation set, which represents the last available measured value before the start of the forecasting horizon.
Data Availability
The data and code used to generate the results reported in this study will be made available at the time of publication.
Supplementary Information
Supplementary information, figures and tables are available here.
Data and code availability
The data and code used to generate the results reported in this study will be made available at the time of publication.
Disclaimer
The content and views expressed in this paper are solely those of the authors and do not necessarily reflect the official views of the UN World Food Programme.
Acknowledgements
PF, DP and MT gratefully acknowledge the Lagrange Project of the ISI Foundation funded by the CRT Foundation. EO would like to acknowledge her WFP colleagues for the fruitful discussions.
Footnotes
↵2 https://dataviz.vam.wfp.org/seasonal_explorer/rainfall_vegetation/visualizations
↵3 No investigation into the forecast of the the independent indicators was performed because of the involvement of chain-of-events predictions (e.g. weather or market forecasts) and ethical issues around providing conflict predictions.


