
Abstract
The spatial distribution of surveillance-reported dengue cases and severity are usually analyzed separately, assuming independence between the spatial distribution of non-severe and severe cases. Given the availability of data for the individual geo-location of surveillance-notified dengue cases, we conducted a cross-sectional study to model non-severe and severe dengue simultaneously, identifying the spatial patterns of dengue distribution, using individual and area level covariates within a hierarchical Bayesian model. Results showed that age and socioeconomic status were associated with dengue presence, and there was evidence of clustering for overall cases but not for severity. Our findings inform decision making to address the preparedness or implementation of dengue control strategies at the local level.
Highlights
A model to jointly assess the spatial distribution of reported dengue and severity.
We account for uncertainty in the surveillance-reported dengue while modelling severe cases.
We assess spatial clustering using individual locations of dengue cases in Medellin.
Young age was associated with higher dengue rates and older age to dengue severity.
Non-monotonic distribution of reported dengue cases across socioeconomic status.
1. BACKGROUND
Dengue is a vector-borne viral disease transmitted to humans by Aedes mosquitoes and an important public health problem worldwide (1-4). The clinical presentation of dengue ranges from a self-limited mild febrile illness to severe outcomes (5, 6). Although lifelong immunity can be developed for each one of the four dengue serotypes (7-9); secondary or subsequent infections from different dengue serotypes increase the risk of severe dengue, which is expected to occur in approximately 1% of all dengue cases, with reported mortality rates up to 20% worldwide (3, 10, 11).
Colombia is one of the Latin American countries with the highest burden of dengue (3, 4) and within Colombia, dengue burden concentrates geographically in 50 of the 778 municipalities that routinely report dengue cases (1, 2, 12, 13). Given the spatial heterogeneity of dengue distribution, including its concentration in low socioeconomic settings, and the limitations of current dengue control strategies (14-18), it is important to investigate the spatial distribution of dengue cases. For instance, it is necessary to understand how individual level characteristics, in addition to area level covariates, are associated with the distribution of overall dengue cases. In addition, the analysis of severe cases is usually performed separately from the analysis of overall reported cases, assuming independence between overall presence of dengue and the presence of severity, often ignoring the potential underreporting associated with the use of surveillance data (4, 15, 19-25). Assuming independence between non-severe and severe cases distribution potentially leads to underestimation of the severity and the uncertainty associated to the individual factors related to severe cases (6, 14, 18, 25). Moreover, while analyzing severe cases, it is important to identify whether the distribution of severe cases follows a different spatial distribution from that of the overall notified dengue cases. However, such analyses are rare and limited because they are: i) often constrained by data availability, ii) mainly conducted using aggregated area level data only, iii) often lacking proper adjustment of neighboring areas, and iv) usually computationally intensive (4, 12, 15, 16, 19-23).
Given the availability of individual dengue case locations (exact longitude and latitude), and to identify high-risk dengue areas while modelling simultaneously non-severe and severe cases, we conducted a single joint spatial marked-point-processes model of notified dengue cases in Medellin, Colombia. We were motivated by the advantage of using individual level location and area level information to identify spatial patterns for clustering areas while properly accounting for spatial autocorrelation (20, 21). Hence, the main purpose of this study is to present the methodology and to estimate quantitatively the contribution of area- and individual-level characteristics while analyzing the spatial distribution of notified (i.e., surveillance data) vector borne diseases in endemic areas.
2. METHODS
2.1. Study site
Medellin is the second largest city in Colombia with 2.6 million inhabitants (26). Annual dengue incidence ranged between 161 and 745 cases per 100,000 inhabitants over the last 10 years (1) and is consistently included on the top five dengue-reporting cities since 1998 (2). Medellin’s urban area is composed of 269 neighborhoods, including 20 institutional units such as university campuses, jail facilities and military compounds, distributed over 110 km2. Medellin’s altitude ranges from 1,460 to 3,200 meters, the annual average temperature is 24°C, and it has two rainy seasons (April and October). Although 50% of the city is classified as low socioeconomic status (SES), 98% of the city has access to potable water. The distribution of health coverage of the population is 70% contributory (employees or self-employees), 25% government subsidized, and 4% uninsured (26).
2.2. Data description
The data set comprises observations of individual location (exact longitude and latitude) of all notified dengue cases in Medellin in 2013 (n=1,793). Dengue notification in Colombia is mandatory and cases are individually registered in the national surveillance system (SIVIGILA), using the locally validated and standardized codes 210 and 220 for dengue and severe dengue, respectively (27).
Individual level covariates
Each row of the dataset included individual sociodemographic and clinical information for each notified case, including sex, age, residential and work/study addresses, date of notification, date of symptoms’ onset, severity status, insurance scheme (subsidized vs contributory schemes) (28), and neighborhood of residence, all collected routinely in SIVIGILA’s notification form (27).
Area level covariates
The neighborhood’s population and socioeconomic status index (SES) were obtained through the office of development and planning at the local ministry of health and the Colombian Administrative Department of Demographic Survey (DANE) (26, 29). Entomological information, including the Breteau Index (IB) which is usually categorized as low, medium or high (27), was used to determine the neighborhood specific level of Aedes infestation and obtained from Medellin’s local secretary of health. However, according to the entomological information reported for the year of study, there were no neighborhoods with high Breteau Index.
2.3. Study design
We performed a cross-sectional study using a single joint spatial marked point process model, to simultaneously estimate the underlying process leading to the spatial patterns of overall and severe dengue cases (22, 30).
2.3.1. Spatial point process model
A spatial point process assesses the distribution of the individual location of an outcome, over a spatial region (22, 23). Here, the individual spatial location (exact longitude and latitude) of an outcome is denominated by a point pattern (22, 23, 31). There are several other proposed models used to assess the point pattern distribution of dengue, including the analysis of disease transmission using agent-based models (32), and analysis using space-time kernel density estimation (33, 34). Here, we propose a model-based approach wherein the logarithm of the intensity of notified dengue cases across Medellin is modelled through a latent Gaussian random field (22, 30, 31).
Specifically, we proposed a Log-Gaussian Cox process which given the nature of the point process follows a Poisson distribution (22, 23, 31, 35). As the likelihood function of a Log-Gaussian Cox process involves an integral that does not have an analytical solution, we used the neighborhood structure of Medellin to approximate this integral. See for example Pinto Jr. et al., (35) for details about this approximation. To identify whether there is an underlying mechanism leading to a different spatial distribution of severe cases, we considered the presence of severity as an individual characteristic of each case and attributed it as a “mark” of the individual point. Since the presence of severity is conditional on being a case, we cannot assume independence between overall notified cases and severe cases. Therefore, the number of severe cases, conditioned on the total number of reported cases in each neighborhood, is assumed to follow a Binomial distribution. For this Binomial distribution, the probability of presence of severity is described by individual level fixed effects and an area latent spatial effect, which is assumed to be proportional to the one used in the mean of the Poisson distribution for overall dengue cases. Here, the proposed approach has the advantage of i) simultaneously assessing the spatial distribution of overall dengue cases and severe cases, by considering the spatial autocorrelation between and within spatial units and ii) accounting for the uncertainty associated with the reported number of dengue cases in the surveillance-based data (4, 19, 25, 30, 31) (Supplementary Material).
2.3.2. Model description
To fit a joint spatial marked-point-processes model we first constructed a model for each latent random field, one for the “pattern”: overall cases and other for the “marks”: severe cases (31), which aere specified as follows:

Here, we assume that yi, the total number of dengue cases observed in each neighborhood i, follows a Poisson distribution with mean  , where Ei is the expected count of cases in neighborhood i, obtained via indirect standardization using the city’s disease rate (36) and
  is the Standardized Rate Ratio (SRR) for neighborhood i. Following equation (2), the SRR is decomposed as the sum of areal effects, spatially structured
  and independent random effects u(si), modelled following the Besag-York-Mollie (BYM) specification (37). The component
  follows, a priori, a Gaussian Markov Random Field (GMRF)and works as the spatially structured effect for the pattern, which reflects the spatial autocorrelation (neighboring structure or vicinity) in the latent field that is not explained by the covariates (i.e., fixed effects) (20, 31, 38). Other components of the overall cases model included
  which is the pattern’s intercept and as fixed effects for the pattern of overall dengue cases we included the following neighborhood level covariates with their corresponding β(1) coefficients: Breteau Index (IBi) categorized as low or medium given that there were no neighborhoods with high IB; the proportion of dengue cases under 20 years of age (UNDER20i); the proportion of female dengue cases (P. FEMALEi), and the socioeconomic status level (SESi), a categorical variable with three levels (low SES level, medium SES level, and high SES level).
For the analysis of the severity “marks”, in equation (3) mi is the number of severe cases in each neighborhood i which, conditional on the value of a second random field  , follows a Binomial distribution, where
  is the probability of and individual j of being a severe case among the overall number of dengue cases yi in neighborhood i. The logit
  is the random field for the marks (severity) at the individual level and exp
  is the odds ratio (OR) of severity;
  is the marks’ intercept and the individual level fixed effects covariates with their corresponding β(2) coefficients for the severity included a categorical variable for age: AGE(sij); and indicator for female sex: SEX(sij); the type of insurance: INSURANCE(sij)with 0 indicating subsidized scheme and 1 indicating a contributory scheme; and the minimum distance between severe cases per neighborhood DISTANCEKm(sij), which is the standardized nearest-neighbor (Euclidean) distance (km) between severe cases in each neighborhood. The component
  in equation (4) represents a single (common) random field that makes the structured spatial effect for the severity proportional to the spatial effect of the pattern (31), which is justified given that the presence of a severe case is conditional on the presence of a case, and v(si)is the spatially unstructured random effect for the distribution of severe cases.
2.3.3. Data analysis
We calculated the respective descriptive statistics, and continuous estimates were presented as mean and standard deviation (SD) or as median and Interquartile Range (IQR), while categorical variables were presented as proportions. To inspect the observed distribution of cases, we plot the kernel density of the individual overall and severe dengue cases using a 5 km bandwidth (39).
The proposed joint spatial marked-point-processes model represents the two outcomes (overall reported dengue cases and severity) simultaneously in a hierarchical mixed-effects Bayesian model. The overall disease pattern and the severity marks constitute a matrix outcome of two link functions (i.e: Poisson for overall dengue cases, and Binomial for severity); each one with its own separate latent field  , which were jointly analyzed in relation to the vector of the sociodemographic covariates described above (31). For the overall dengue pattern, we estimated the crude and adjusted Standardized Rate Ratio (SRR). For the severity marks, we estimated the odds ratio (OR), the respective probability of severity, and the overall and neighborhood-specific Relative Risk (RR) of severity. We assigned non-informative priors for the precision parameters of the random effects. The posterior distributions of the parameters and respective 95% Credible Intervals (95% Cr.Int) were estimated via Integrated Nested Laplace Approximation (INLA) (31, 38, 40). Model assessment to identify the variables included in the full models: equation (5) and (6), was performed through the Deviation Information Criterion (DIC) (20, 22, 31). All analyses were fitted using R-INLA (R Core Team (2019); R Studio version 3.3.3) (23, 40, 41). We followed the REporting of studies Conducted using Observational Routinely-collected health Data (RECORD) statement guideline (42) (Supplementary Material).
Ethics statement
This study analyzed secondary data without identifying information, and therefore, did not require informed consent. The protocol was reviewed and approved by the Institutional Review Board (Study No. A02-E05-18A) and by the ethics committee of the Secretary of Health of Medellin, Colombia.
3. RESULTS
In 2013, there were 1,793 dengue cases reported in Medellin. In total, 1,719 (95.9%) were geocoded and were used for this analysis. There were 247 (14.4%) severe cases. Median age was 28 years (IQR=16 - 45) for overall dengue cases and 29 years (IQR=17 - 49) for severe cases. A descriptive analysis of notified cases and neighborhood characteristics is presented in Table 1.
Individual and Neighborhood Characteristics of Dengue Cases Reported in Medellin, 2013.
The overall crude rate for reported dengue was 78 cases per 100,000 inhabitants. The median number of cases per neighborhood was four (IQR= 1-10; range= 0-57). The mean crude SRR was 1.3, standard deviation (SD: 2.4; range= 0-20.6). The median number of severe cases per neighborhood was one (IQR=0-2; range= 0, 10). There was an apparent concentration of both dengue and severe dengue cases on the northeastern neighborhoods that was observed by the crude distribution of geocoded cases (Figure 1) and the unadjusted (i.e: without accounting for population size) estimated density of cases (Supplemental Material).

Distribution of dengue cases notified in Medellin in 2013. Plot of observed overall and severe dengue cases.
The joint model showed that for the pattern of overall dengue cases, the mean baseline adjusted SRR per neighborhood was 0.78 (95% Cr.Int=0.60, 1.01) and the average adjusted probability of severity per neighborhood was 0.92% (95% Cr.Int=0.62%, 1.28%). Overall dengue rates increased with every 10% increase in the proportion of cases under 20 years old per neighborhood (SRR=1.06; 95% Cr.Int=1.01, 1.10) and compared to people below 15 years old, severity tend to increase among people over 55 years old (OR=1.53; 95% Cr.Int=1.00, 2.35). Female sex was associated to increased dengue rates (SRR= 1.05; 95% Cr.Int=1.01, 1.09) but not to severity (OR=0.88; 95% Cr.Int=0.68, 1.14). Just over half of reported cases were from neighborhoods with medium SES levels, and compared to these, dengue rates among neighborhoods in the Low SES level were on average 55% lower (SRR=0.45; 95% Cr.Int=0.34, 0.59) and rates among neighborhoods with high SES level were on average 22% lower (SRR=0.78; 95% Cr.Int=0.56, 1.09). There were no neighborhoods with high Breteau Index and compared to neighborhoods with low Breteau Index (i.e: low Aedes presence), neighborhoods with a medium level of Breteau Index had slightly higher rates of dengue cases (SRR=1.12; 95% Cr.Int=0.89, 1.40). Increased severity was observed with contributory insurance scheme and distance, but the estimates showed high posterior uncertainty with 95% credible intervals covering the null value for the posterior distribution of the risk possibly due to the small number of severe dengue in the city and within each neighborhood. (Table 2).
Posterior mean of the Standardized Rate Ratio (SRR), the Odds Ratio (OR) and 95% Credible Intervals (95% Cr.Int) for covariates (fixed effects) in the final joint model for dengue cases in Medellin, 2013 (DIC=2762.9).
The spatial distribution of the crude SRR for overall dengue cases indicated the presence of dengue in the entire city with some concentration of dengue cases among neighborhoods in the central and the North-Eastern regions of the city. Likewise, compared to the overall odds of severity in the entire city, the distribution of severe cases indicated increased odds of severity among Southern and Eastern neighborhoods of the city (Figure 2).

Spatial distribution of overall and severe dengue cases in Medellin, 2013. (Top) Neighborhood specific crude Standardized Rate Ratios (SRR) and standard deviation (SD) for overall dengue cases. (Bottom) Neighborhood specific crude Odds Ratios (OR) and standard deviation (SD) for severe dengue cases.
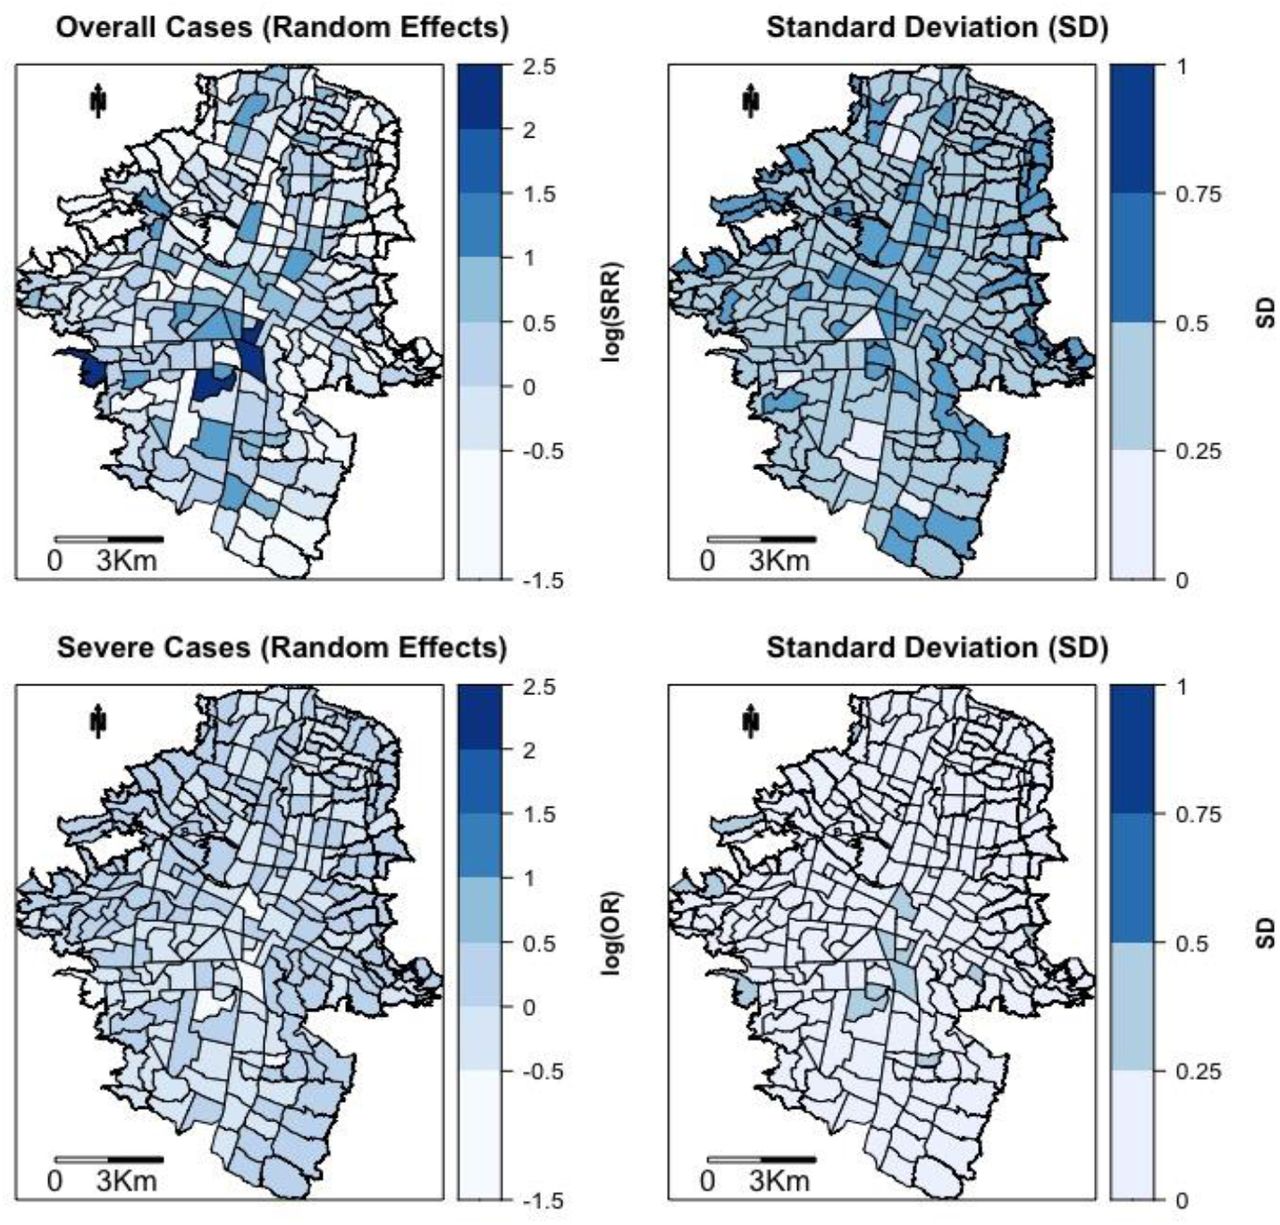
After adjusting for other covariates and comparing to the overall rate of dengue in the city, the spatially structured effect indicating the residual spatial autocorrelation not explained by the fixed effects, showed a widespread distribution of cases with some concentration in central and Northern parts of the city. For severity marks, the residual spatial effect showed a homogeneous distribution of severe cases without indication of concentration of cases in any particular neighborhood (Figure 3). The beta coefficient for the spatial effect of severe cases in equation (4) indicated that after accounting for the other covariates in the model, and given the distribution of overall dengue cases, there is no indication that severe dengue shares the same latent spatial effect as the one for the dengue cases (OR= 0.84; 95% Cr.Int=0.60, 1.27).
Estimated common spatial trend for overall dengue and Severe dengue cases in Medellin, 2013. (Top) Neighborhood specific residual (Random Effects) Standardized Rate Ratio (nSRR) and Standard Deviation (SD). (Bottom) Neighborhood specific residual (Random Effects) Odds Ratio (nOR) and Standard Deviation (SD).
As a sensitivity analysis we fit the joint model using separate spatial structures for patterns and marks. The results from the mean of the posterior distribution for the fixed effects were similar to the main results presented here. However the DIC was higher for the model using separated spatial structures (DIC=2868 vs DIC=2769), and both the fixed effects and the hyperparameters for the spatial effect showed higher posterior uncertainty with wider credible intervals, mostly for SES and age, given that using independent spatial structures, the distribution of severe cases become independent of the distribution of non-severe cases and there is no borrow of strength across the overall distribution of dengue cases (Supplemental Material).
4. DISCUSSION
We presented an analysis of a joint spatial marked point processes model on routinely collected dengue data. Our study shows the possibility of simultaneously estimating the distribution of overall dengue cases and the distribution of severity, accounting for the uncertainty associated to the reporting of dengue cases in surveillance-based data, allowing for spatial autocorrelation, and using individual sociodemographic covariates to explain such outcomes.
4.1. Dengue discussion
Colombia is an endemic country and Medellin is one of the municipalities consistently reporting a high burden of cases during the last decade (1, 2, 27). Our study shows that during 2013, dengue was present in the entire city, with concentration at the Northeastern neighborhoods, which are known for being densely populated areas (18, 26, 43). The concentration of cases in the Eastern region of the city has been previously explored in the context of serological surveys (44) and among children attending different schools in the city (18). However, previous approaches did not include latent spatial structured effects that account for the neighboring structure after adjusting for available covariates. Also, previous approaches either used aggregated data, fit fixed effects for the spatial structure or modeled separately the spatial effects and the contribution of sociodemographic covariates (14, 18, 33-35, 43, 44).
In our study, there were no neighborhoods with high Breteau Index and there was no association between the SRR and Breteau Index. Although the Breteau Index is considered a useful indicator of Aedes infestation, there is conflicting evidence about the concordance with presence of dengue cases (1, 15). This could arise in our data because entomological information was collected at regular intervals throughout the year in different neighborhoods and households (18, 27, 43). The value of entomological indexes changes over time, but the timing of exposure assessment and incident cases may not be aligned (45-47).
Although the proportion of female cases was associated with a slight increased rate in the overall distribution of cases, being female was not associated with severity in our study. Increased proportion of female dengue cases has been also reported in Medellin previously (18). However, associations between sex, dengue and dengue severity have been inconsistent in the literature (11, 43, 44). Age, specifically the proportion of people under 20 years of age, was associated with increased rates of overall dengue cases across neighborhoods and an increased OR for severity was observed among people over 55 years old. These findings could be associated with a high seroprevalence of dengue in the city and a limited presence of secondary infections (2, 11, 43). In Medellin, the overall dengue seroprevalence was estimated at 61%, with a mean age of 30 years among dengue seropositive cases. The overall seroconversion rates were estimated to increase with age, with the highest seroconversion rate (17.9 per 1,000 people) observed among subjects between 31 and 40 years of age (44). Likewise, among school children under 19 years old, a trend of increased dengue seroprevalence and seroconversion with age has been reported (18). However, it is also possible that the observed trend of severity by age could be related to comorbidities in older patients and the possibility of secondary infections in people over 55 years old (6, 9, 11). These characteristics have been described in other Colombian municipalities and in other Latin-American contexts (1, 2, 11, 14, 16, 24, 43, 48); and may contribute to an understanding of the age-related findings in this study.
Health insurance was modeled as a proxy of socioeconomic status at the individual level (29, 49, 50). In Colombia, specifically, the subsidized system corresponds to individuals for whom the state pays for health coverage. The contributory system corresponds to employed individuals or people with capacity to pay for their health system coverage (affiliated to a private insurance plan or out-of-pocket). In our study, there was no association between insurance scheme and severity (1, 2, 49-51). According to the SES level of the neighborhood of residency, findings from the joint model suggests a non-monotonic distribution of cases across SES levels, with fewer cases at low and high SES levels. There were fewer cases among neighborhoods at the lowest SES level, which could be attributed to limited access (physical and financial) to health care, compared to people living in neighborhoods with medium- or higher SES levels and or health seeking behavior (1, 2, 49-51). Although the rate of dengue cases seems to decrease in neighborhoods at the high SES level, the lack of precision (i.e., high uncertainty of the posterior distribution) of the estimates could be attributed to the small number of cases in this stratum (n=193 cases). Nonetheless, reporting bias and spatial confounding associated to the SES level could not be completely ruled out (52).
4.2. Implications of routinely collected data
We used passive surveillance data, which implies a potential risk of under reporting and measurement error (17, 19, 25, 27, 50, 53). Notification depends on health seeking behavior, which in turn depends on presence and severity of symptoms and access to health care (insurance scheme, availability of health care facility, etc.) that altogether could also depend on other socioeconomic factors (15, 50, 53). Therefore, the findings from this analysis should be restricted to the subset of notified cases. For this analysis we worked closely with the municipality’s secretary of health, which is considered one of the strongest surveillance systems in the country and for which dengue is a disease of mandatory notification (18, 27, 44). The diagnostic system in place, including serological and clinical confirmation, decreased the risk of misclassification of the outcome but did not ruled it out completely.
4.3. Methodological discussion
This joint spatial marked point process analyses the distribution of individual-level data on dengue cases, adjusting for neighboring effects via spatial structured effects, and accounting for area- and individual-level covariates simultaneously. The advantage of using a joint model to assess the spatial distribution of severe cases relies on three main aspects i) the opportunity to use individual location data for overall and severe cases to assess their distribution, ii) the opportunity to account for the uncertainty associated with the number of overall dengue cases in the surveillance-based data, and iii) the opportunity of identifying the presence of clustering of severe cases that will otherwise not be identified with separated models for dengue and severe dengue. This approach assumes that there is a spatial trend in the data that cannot be explained by the measured covariates and that such trend is a random field (22, 23, 31). In our study, the addition of a covariate for the minimum nearest-neighbor Euclidean distance between cases allows the investigation of possible clustering within a neighborhood (31). Although the minimum distance between severe cases indicated a local clustering for severe cases, the results had high posterior uncertainty with wide 95% credible intervals, possibly due to the small number of severe dengue cases overall and within neighborhood. Nonetheless, the joint model assumed the spatial distribution of severe cases proportional to the spatial distribution of overall cases (see equations (2) and (4)) and allowed the identification of the spatial patterns of distribution for severe cases and improved the precision showing less posterior uncertainty for the parameters.
Typically, point process models are fitted using a regular spatial grid which approximates the latent field and the spatial pattern (20, 31). Also, should the data at hand allow it, space-time kernel density estimation (STKDE) could be used for spatiotemporal disease transmission models, which could be computationally intensive and are not necessarily comparable with the methods proposed here (32-35, 39). For ease of applicability among the public health community, data availability, and to avoid issues associated with the interpolation of population offsets, we followed the approach proposed by Pinto Jr. et al., (35) and used the actual neighborhood map and population information as the spatial grid. This approach facilitated the fitting by providing the real neighboring boundaries and used the actual information of the population, area, and density to improve accuracy. The use of this dataset favors the use and application of research results in the context of surveillance and disease control by decision makers and other stakeholders.
Conclusion
These findings provide epidemiological and geographical information of high-risk areas of overall and severe dengue presence in Medellin, Colombia. Age, insurance scheme, and distance between cases are key sociodemographic and spatial factors associated with the presence of dengue in the city. The use of joint marked point process models improves the evidence obtained from surveillance data by accounting for the uncertainty of overall reported dengue cases and by favoring its analysis at the individual level when data is available. This application contributes to the production of public health information for decision makers to address specific disease control strategies, and to help the preparedness of health services for upcoming outbreaks at the local level.
Data Availability
Data accessibility: Case-specific data, which is routinely collected using the national surveillance system of Colombia (SIVIGILA; http://portalsivigila.ins.gov.co/sivigila/index.php) was obtained directly form the Local Surveillance office (Secretaria de Salud Municipal de Medellin); Socioeconomic information at neighborhood level was obtained from the website of the municipality (https://www.medellin.gov.co) and an open data source for socioeconomic information (https://www.datos.gov.co/).
Data accessibility
Case-specific data, which is routinely collected using the national surveillance system of Colombia (SIVIGILA; http://portalsivigila.ins.gov.co/sivigila/index.php) was obtained directly form the Local Surveillance office (Secretaria de Salud Municipal de Medellin); Socioeconomic information at neighborhood level was obtained from the website of the municipality (https://www.medellin.gov.co) and an open data source for socioeconomic information (https://www.datos.gov.co/).
Conflict of Interest
The authors declare no conflict of interest
Funding
This research did not receive any specific grant from funding agencies in the public, commercial, or not-for-profit sectors.
Acknowledgements
We would like to acknowledge the collaboration of the Secretaria de Salud Municipal de Medellin for their collaboration on accessing the datasets.
Abbreviations
- Cr.Int
- Credible Interval
- SRR
- Standardized Rate Ratio
- IQR
- Interquartile Range
- OR
- Odds Ratio
- RR
- Relative Risk
- DIC
- Deviation Information Criterion
- INLA
- Integrated Nested Laplace Approximation
REFERENCES


