
Abstract
Background The uterine cervix has an important role in female reproductive health, but not much is known about the genetic determinants of cervical biology and pathology. Genome-wide association studies (GWAS) with increasing sample sizes have reported preliminary genetic associations for cervical cancer. However, GWAS is only the first step in mapping the genetic susceptibility and thus, the underlying biology in cervical cancer and other cervical phenotypes is still not entirely understood. Here, we use data from large biobanks to characterise the genetics of cervical phenotypes (including cervical cancer) and leverage latest computational methods and gene expression data to refine the association signals for cervical cancer.
Methods Using Estonian Biobank and FinnGen data, we characterise the genetic signals associated with cervical ectropion (10,162 cases/151,347 controls), cervicitis (19,285/185,708) and cervical dysplasia (14,694/150,563). We present the results from the largest trans-ethnic GWAS meta-analysis of cervical cancer, including up to 9,229 cases and 490,304 controls from Estonian Biobank, the FinnGen study, the UK Biobank and Biobank Japan. We combine GWAS results with gene expression data and chromatin regulatory annotations in HeLa cervical carcinoma cells to propose the most likely candidate genes and causal variants for every locus associated with cervical cancer. We further dissect the HLA association with cervical pathology using imputed data on alleles and amino acid polymorphisms.
Results We report a single associated locus on 2q13 for both cervical ectropion (rs3748916, p=5.1 × 10⁻¹⁶) and cervicitis (rs1049137, p=3.9 × 10⁻¹⁰), and five signals for cervical dysplasia - HLA-B and HLA-DQA1 (rs1053726, p=9.1 × 10⁻⁹; rs36214159, 1.6 × 10⁻²²), DAPL1 (rs12611652, p=3.2 × 10⁻⁹), PAX8 (rs1049137, p=6.4 × 10⁻⁹), and CLPTM1L (rs6866294, p=2.1 × 10⁻⁹). We identify five loci associated with cervical cancer in the trans-ethnic meta-analysis: LINC00339/CDC42 (rs2268177, p= 3.1 × 10⁻⁸), PAX8/PAX8-AS1 (rs4849177, p=9.4 × 10⁻¹⁵), CLPTM1L (rs27069, p=1.3 × 10⁻¹⁴), GSDMB (rs12603332, p=1.2 × 10⁻⁹), and HLA-DRB1/HLA-DQA1 (rs35508382, p=1.0 × 10−39). Joint analysis of dysplasia and cancer datasets revealed an association on chromosome 19 (rs425787, p=3.5 × 10⁻⁸), near CD70.
Discussion Our results map PAX8/PAX8-AS1, LINC00339, CDC42, CLPTM1L, HLA-DRB1, HLA-B, and GSDMB as the most likely candidate genes for cervical cancer, which provides novel insight into cervical cancer pathogenesis and supports the role of genes involved in reproductive tract development, immune response, and cellular proliferation/apoptosis. We further show that PAX8/PAX8-AS1 has a central role in cervical biology and pathology, as it was associated with all analysed phenotypes. The detailed characterisation of association signals, together with mapping of causal variants and genes offers valuable leads for further functional studies.
Introduction
The uterine cervix has an important role in female reproductive health, as it separates the lower and upper parts of the genital tract and thus forms a barrier for pathogens (1) which can cause infection of the upper genital tract. The latter can lead to serious health problems, including pelvic inflammatory disease, infertility, and chronic pelvic pain (2). The cervical epithelium is also the main infection site for human papillomavirus (HPV), one of the most common causes of sexually transmitted diseases, which can, in turn, cause cervical dysplasia and in some cases malignant neoplasm of the cervix. Cervical cancer is one of the most common cancer types in women, with more than 28 000 and 311 000 women dying from the disease in the Europe and worldwide every year, respectively (3).
Although the development of cervical cancer is initiated by high-risk human papillomavirus (HPV) subtype infection, it also involves the contribution from the genetics of host, which determine whether the infection is successfully cleared or persists and eventually develops into cervical cancer, and also the rate at which the tumor progresses. Previous family-based studies have estimated the heritability of cervical cancer to be 13-64% (4–6) (array-based heritability estimate 7% (7)), and recent-genome wide association studies (GWAS) with increasing sample sizes have also increased the number of loci reported for cervical cancer (7, 8). However, GWAS findings are merely the first step in mapping the genetic susceptibility and biology, and thus, the underlying carcinogenic mechanisms and molecular changes in cervical cancer are still not entirely understood (9).
At the same time, not much is known about the genetic factors predisposing to other cervical phenotypes, such as cervical ectropion (a benign condition where the columnar epithelium of the cervical canal is turned outwards and exposed to the vaginal environment (10)), cervicitis (inflammation of the uterine cervical epithelium, most commonly caused by sexually transmitted pathogens, such as Chlamydia trachomatis, Neisseria gonorrhoea and Mycoplasma genitalium (11)) and cervical dysplasia (a precancerous condition with varying severity, characterized by abnormal growth of the cervical epithelium), which all represent partially overlapping conditions related to the cervix. Without knowing the genetic determinants of cervical biology, it is difficult to put the findings from cervical cancer genetic studies into the biological perspective.
Here we use data from Estonian Biobank and the FinnGen study to dissect the genetic architecture of cervical phenotypes in a sample set including cases for cervical ectropion (n=10,162), cervicitis (n=19,285), and cervical dysplasia (n=14,694). We then explore their genetic overlap with cervical cancer by combining all publicly available datasets in the largest trans-ethnic GWAS meta-analysis of cervical cancer to date, with 9,229 cervical cancer cases and 490,304 controls. Leveraging latest computational methods and gene expression data, we refine the association signals for cervical cancer and propose potential causal variants and genes at each locus for functional follow-up.
Methods
Study design and participants
We used data from the Estonian Biobank (EstBB) and the FinnGen study (release 5) for GWAS of cervical phenotypes ectropion, cervicitis, and dysplasia. The EstBB is a population-based biobank with genotype data and health information for over 200,000 participants (12). Information on International Classification of Disease-10 (ICD10) codes is obtained via regular linking with the Health Insurance Fund and other relevant registries (13). The 150K data freeze was used for the analyses described in this paper (n=92,042 women). All biobank participants have signed a broad informed consent for using their data in research and the study was carried out under ethical approval 1.1-12/624 from the Estonian Committee on Bioethics and Human Research (Estonian Ministry of Social Affairs) and data release N05 from the EstBB.
The following ICD10 codes were used for extracting cases: N86 (Erosion and ectropion of cervix uteri), N72 (Inflammatory disease of cervix uteri), N87 (Dysplasia of cervix uteri), C53/D06 (Cervical cancer). Women who did not have the respective ICD codes were used as controls. The final numbers in analysis were as follows: cervical ectropion: 9,664 cases, 82,378 controls; cervicitis: 18,192 cases, 73,850 controls: cervical dysplasia: 10,448 cases, 81,594 controls, cervical cancer 748 cases, 81,870 controls (Supplementary Table 1). For follow-up analyses, we further stratified the dysplasia cases by severity, resulting in 4,250 cases with mild (N87.0), 2,616 with moderate (N87.1), and 1,599 with severe dysplasia, not elsewhere classified (N87.2), respectively. If more than one diagnosis code was present for dysplasia/cancer, we selected the most severe for analysis (mild < moderate < severe dysplasia < cervical cancer).
All EstBB participants have been genotyped at the Genotyping Core Lab of the Institute of Genomics, University of Tartu, using Illumina Global Screening Array v1.0 and v2.0. Samples were genotyped and PLINK format files were created using Illumina GenomeStudio v2.0.4. Individuals were excluded from the analysis if their call-rate was < 95% or if sex defined based on heterozygosity of X chromosome did not match sex in phenotype data. Before imputation, variants were filtered by call-rate < 95%, HWE p-value < 1e-4 (autosomal variants only), and minor allele frequency (MAF) < 1%. Variant positions were updated to b37 and all variants were changed to be from TOP strand using GSAMD-24v1-0_20011747_A1-b37.strand.RefAlt.zip files from https://www.well.ox.ac.uk/~wrayner/strand/ webpage. Prephasing was done using Eagle v2.3 software (14) (number of conditioning haplotypes Eagle2 uses when phasing each sample was set to: --Kpbwt=20000) and imputation was done using Beagle v.28Sep18.79339 with effective population size ne=20,000. Population specific imputation reference of 2297 WGS samples was used (15). Association analysis was carried out using SAIGE software implementing a mixed logistic regression model (16), using year of birth and 10 PCs as covariates in step I.
The FinnGen study is a public-private partnership bringing together genotyping data from different Finnish Biobanks and electronic health records from Finnish health registries. FinnGen release 5 (R5) data, consisting of 218,792 individuals were used, and the following phenotypes of interest were defined using ICD10, ICD9 and ICD8 codes: cervical ectropion (n_cases=498, n_controls=68,969), cervicitis (n_cases=1,093, n_controls=111,858), cervical dysplasia (n_cases=4,246, n_controls=68,969). Additionally, publicly available GWAS summary statistics for phenotype “Malignant neoplasm of cervix uteri” from freeze R4 (n_cases=1,313, n_cases=99,048) was used. In short, phenotypes were defined as follows: ectropion (N14_EROSECTROPUT, ICD10 N86, ICD9 6220A, ICD8 62191), cervicitis (N14_INFCERVIX, ICD10 N72, ICD9 616, ICD 620), dysplasia (N14_DYSPLACERVUT ICD10 N87, ICD9 6221, ICD8 621), cervical cancer (C3_CERVIX_UTERI, ICD10 C53, ICD9 180, ICD8 180). More detailed information on FinnGen endpoint definitions can be found from https://www.finngen.fi/en/researchers/clinical-endpoints. FinnGen individuals were genotyped with Illumina and Thermo Fisher arrays and imputed to the population-specific SISu v3 imputation reference panel according to the following protocol: dx.doi.org/dx.doi.org/10.17504/protocols.io.xbgfijw. Genetic association testing was carried out with SAIGE (16). FinnGen summary statistics included prefiltered variants (minimum allele count>5, imputation INFO score>0.6). For more information on genotype data, disease endpoints and GWAS analyses, please see https://finngen.gitbook.io/documentation/. Patients and control subjects in FinnGen provided informed consent for biobank research, based on the Finnish Biobank Act. Alternatively, separate research cohorts, collected prior the Finnish Biobank Act came into effect (in September 2013) and start of FinnGen (August 2017), were collected based on study-specific consents, and later transferred to the Finnish biobanks after approval by Fimea, the National Supervisory Authority for Welfare and Health. Recruitment protocols followed the biobank protocols approved by Fimea. The Coordinating Ethics Committee of the Hospital District of Helsinki and Uusimaa (HUS) approved the FinnGen study protocol Nr HUS/990/2017.
The FinnGen study is approved by Finnish Institute for Health and Welfare (THL), approval number THL/2031/6.02.00/2017, amendments THL/1101/5.05.00/2017, THL/341/6.02.00/2018, THL/2222/6.02.00/2018, THL/283/6.02.00/2019, THL/1721/5.05.00/2019, Digital and population data service agency VRK43431/2017-3, VRK/6909/2018-3, VRK/4415/2019-3 the Social Insurance Institution (KELA) KELA 58/522/2017, KELA 131/522/2018, KELA 70/522/2019, KELA 98/522/2019, and Statistics Finland TK-53-1041-17.
The Biobank Access Decisions for FinnGen samples and data utilized in FinnGen Data Freeze 5 include: THL Biobank BB2017_55, BB2017_111, BB2018_19, BB_2018_34, BB_2018_67, BB2018_71, BB2019_7, BB2019_8, BB2019_26, Finnish Red Cross Blood Service Biobank 7.12.2017, Helsinki Biobank HUS/359/2017, Auria Biobank AB17-5154, Biobank Borealis of Northern Finland_2017_1013, Biobank of Eastern Finland 1186/2018, Finnish Clinical Biobank Tampere MH0004, Central Finland Biobank 1-2017, and Terveystalo Biobank STB 2018001.
Publicly available datasets
For cervical cancer meta-analysis we additionally used publicly available datasets from Rashkin et al 2020 (7) (downloaded from https://github.com/Wittelab/pancancer_pleiotropy, including 5,998 cases and 189,855 controls from the UK Biobank, and 565 cases and 29,801 controls from Kaiser Permanente cohort) and summary statistics from Biobank Japan (17) (downloaded from http://jenger.riken.jp/en/result), including 605 cases and 89,731 controls. We additionally used the publicly available GWAS summary statistics for phenotype “Malignant neoplasm of cervix uteri” from FinnGen freeze R4 (ncases=1,313, ncontrols=99,048). The summary statistics include variant-level association statistics (effect estimate and standard error (SE), association p-value etc.). For the data from Rashkin et al study, we first converted OR-s to betas (beta=log(OR)), then derived z-scores from reported p-values (using the ‘qnorm’ function in R) and calculated SE-s (SE=beta/z-score).
GWAS meta-analysis
All European ancestry meta-analyses were conducted using inverse variance weighted fixed-effect meta-analysis method implemented into GWAMA software (18). For cervical cancer meta-analysis including data from Biobank Japan, we used MR-MEGA, which is a tool for trans-ethnic meta-regression (19). Genome-wide significance was set at p < 5 × 10⁻⁸ in all analyses. We used MTAG (20) (Multi-Trait Analysis of GWAS) to jointly analyse the summary statistics from dysplasia and cervical cancer European ancestry analyses and thus increase the power to detect additional associations.
For annotation and follow-up analyses, we used the GWAS summary statistics (European ancestry for cervical cancer).
Annotation of GWAS signals
We used FUMA (21) for functional annotation of GWAS results and credible set variants. For functional annotation, the Annotate Variation (ANNOVAR) (22), CADD (a continuous score showing how deleterious the SNP is to protein structure/function; scores >12.37 indicate potential pathogenicity)(23) and RegulomeDB (24) scores (ranging from 1 to 7, where lower score indicates greater evidence for having regulatory function), and 15 chromatin states from the Roadmap Epigenomics Project (25) were used. FUMA also performs lookups in the GWAS Catalog, the results of which are shown in Supplementary Table 7.
HLA analysis
For cervical dysplasia meta-analysis, we carried out HLA imputation of the EstBB genotype data with the SNP2HLA tool (26). As an imputation reference, we used a merged reference of EstBB WGS (15) and Type 1 Diabetes Genetics Consortium samples (26). We tested for association between the alleles, amino acid polymorphisms and cervical dysplasia in the EstBB using SAIGE with the LOCO option. We used imputed data on alleles (two- and four-digit) and amino acid polymorphisms present in the MHC class I genes (HLA-A, HLA-B, HLA-C) and classical MHC class II genes (HLA-DRB1, HLA-DQA1, HLA-DQB1, HLA-DPA1, HLA-DPB1) for 10,446 cases and 81,586 controls in the EstBB, who had the corresponding data available. Conditional analysis for identifying independent signals in the HLA locus was done using SAIGE by stepwise inclusion of the index variants in the regression model.
Colocalisation and fine-mapping analyses
We used HyPrColoc (27), a fast and efficient colocalisation method for identifying the overlap between our GWAS meta-analysis signals and cis-QTL signals from different tissues and cell types (expression QTLs, transcript QTLs, exon QTLs and exon usage QTLs available in the eQTL Catalogue (28)). We lifted the GWAS summary statistics over to hg38 build to match the eQTL Catalogue using binary liftOver tool (https://genome.sph.umich.edu/wiki/LiftOver#Binary_liftOver_tool). For each genome-wide significant (p<5 × 10⁻⁸) GWAS locus we extracted the +/-500kb of its top hit from QTL datasets and ran the colocalization analysis against eQTL Catalogue traits. For each eQTL Catalogue dataset we included all the QTL features which shared at least 80% of tested variants with the variants present in our GWAS region. We used the default settings for HyPrColoc analyses and did not specify any sample overlap argument, because HyPrColoc paper (27) demonstrates that assuming trait independence gives reasonable results. HyPrColoc outputs the following results a) a cluster of putatively colocalised traits (here our GWAS region of interest and cis-QTL signal for any nearby feature for given QTL dataset); b) the posterior probability that genetic association signals for those traits are colocalising (we considered two or more signals to colocalize if the posterior probability for a shared causal variant (PP4) was 0.8 or higher. All results with a PP4 > 0.8 can be found in Supplementary Table 4); c) the ‘regional association’ probability (a large regional association probability indicates that one or more SNPs in the region have shared association across evaluated traits); d) a candidate causal variant explaining the shared association; and e) the proportion of the posterior probability explained by this variant (which also represents the HyPrColoc multi-trait fine-mapping probability). For every colocalisation event, we also calculated 95% credible set (CS) for multi-trait fine-mapping results. To do so, we ranked all variants decreasingly based on their posterior probability and extracted top n variants with cumulative posterior probability of ≥0.95.
Since cervical samples were not present in analysed gene expression datasets, we prioritised colocalisation signals from tissues that cluster together with vagina/uterus in GTEx V8 data, either based on cell-type-composition or gene expression (Supplementary figures S41 and S48 of (29)) and that have sufficient sample size to detect QTL associations. These tissues include vagina, uterus, esophagus mucosa and gastro-esophageal junction, sigmoid colon, skin, salivary gland, and tibial nerve. Of these ‘proxy’ tissues, esophageal mucosa (stratified squamous epithelium) and gastro-esophageal junction (transition zone between stratified and columnar epithelium) tissues are histologically most similar to the cervix.
We used FUMA (21) to annotate credible set variants with chromatin 15-state marks in HeLa-S3 Cervical Carcinoma cell line (E117) and in available ‘proxy’ tissues (E106 - sigmoid colon; E079 - esophagus; E055-E061,E126, E127 - skin) from the Roadmap Epigenomics Project (25).
Genetic correlations
We used the LD Score regression method (30) implemented in LD Hub (31)(http://ldsc.broadinstitute.org) for testing genetic correlations between cervical cancer and traits spanning reproductive, aging, autoimmune, cancer, and smoking behaviour categories (33 traits in total), using the cervical cancer European-ancestry only GWAS meta-analysis summary statistics and data available within the LD Hub resource. After filtering the input to HapMap3 SNPs, removing SNPs within the MHC region, and merging with the built-in reference panel LD Scores (1000 Genomes EUR ancestry) (31), ∼1.1M variants remained for analysis. False discovery rate (FDR) correction (calculated using the p.adjust function in R) was used to account for multiple testing. Results of the analysis are presented in Supplementary Table 9.
LDSC estimated observed scale heritability (0.0059 (se=0.0013)) for cervical cancer was converted to liability scale using the formula h2liability = h2observed × K2 × (1 - K)2 / P / (1-P) / zv2, where K is the population prevalence (here equal to sample prevalence) and P is the proportion of cases in the study (European ancestry analysis, 2.1%). This resulted in a liability scale heritability estimate of 4.75% for non-HLA common variant heritability.
Data sharing
GWAS meta-analysis summary statistics will be made available upon publication. Datasets used in this study can be downloaded from provided web pages.
Role of the funding source
The funders had no role in the study design; in the collection, analysis, or interpretation of data; in the writing of the report; or in the decision to submit the paper for publication.
Results
First, to determine the genetic factors associated with cervical phenotypes, we conducted GWAS using 92,042 Estonian female individuals from the EstBB for cervical ectropion, cervicitis, and dysplasia. Next, the results of these analyses were further meta-analysed together with the corresponding summary statistics from the FinnGen study (R5 release data with - depending on the phenotype - up to 112,951 Finnish female individuals). The resulting meta-analysis included 10,162 women with cervical ectropion, 19,285 with cervicitis, 14,694 with cervical dysplasia and up to 193,452 female controls of European ancestry.
GWAS meta-analyses for cervical ectropion, cervicitis, and dysplasia
We identified one genome-wide significant (p < 5 × 10⁻⁸) locus for both cervical ectropion and cervicitis (Supplementary Figure 1), and five signals for cervical dysplasia (Table 1; Supplementary Figure 2) (number of analysed markers in meta-analysis up to 11,043,697). All the reported genetic variants show at least nominal significance in both analysed cohorts (Table 1).
Genetic variants associated with cervical ectropion, cervicitis, and dysplasia.
Notably, all three analysed phenotypes showed significant association with a locus on chromosome 2 near PAX8 gene, a transcription factor known to be relevant for genital tract development and its antisense RNA PAX8-AS1. For cervical ectropion and cervicitis, the lead signal (genetic variant with the lowest p-value in a region) was non-significant in the FinnGen data alone. However, the effect size estimates (odds ratios and 95% confidence intervals) are concordant and lack of significance in this particular dataset can be attributed to very small sample size - 498 and 1,093 cases for ectropion and cervicitis, respectively.
Furthermore, we observed additional four genome-wide significant signals for cervical dysplasia - two in the HLA region on chromosome 6 (rs1053726, rs36214159), one on chromosome 2 (rs112611652, p=3.2 × 10⁻⁹) near DAPL1 and one on chromosome 5 (rs6866294, p=2.1 × 10⁻⁹), downstream CLPTM1L.
GWAS meta-analysis for cervical cancer
To determine the genetic overlap between cervical phenotypes and cervical cancer, we conducted another GWAS analysis with the EstBB data for cervical cancer (n_cases=748) and combined the results with publicly available GWAS summary statistics in the largest GWAS meta-analysis for cervical cancer to date. We used data from FinnGen release R4 (n_cases=1,313; https://r4.finngen.fi/pheno/C3_CERVIX_UTERI), Rashkin et al 2020 (7) (n_cases=6,563) and Biobank Japan (n_cases=605; http://jenger.riken.jp:8080/pheno/Cervical_cancer), resulting in a total of 8,624 cases and 400,573 controls of European ancestry, and 9,229 cervical cancer cases together with 490,304 controls in transethnic meta-analysis.
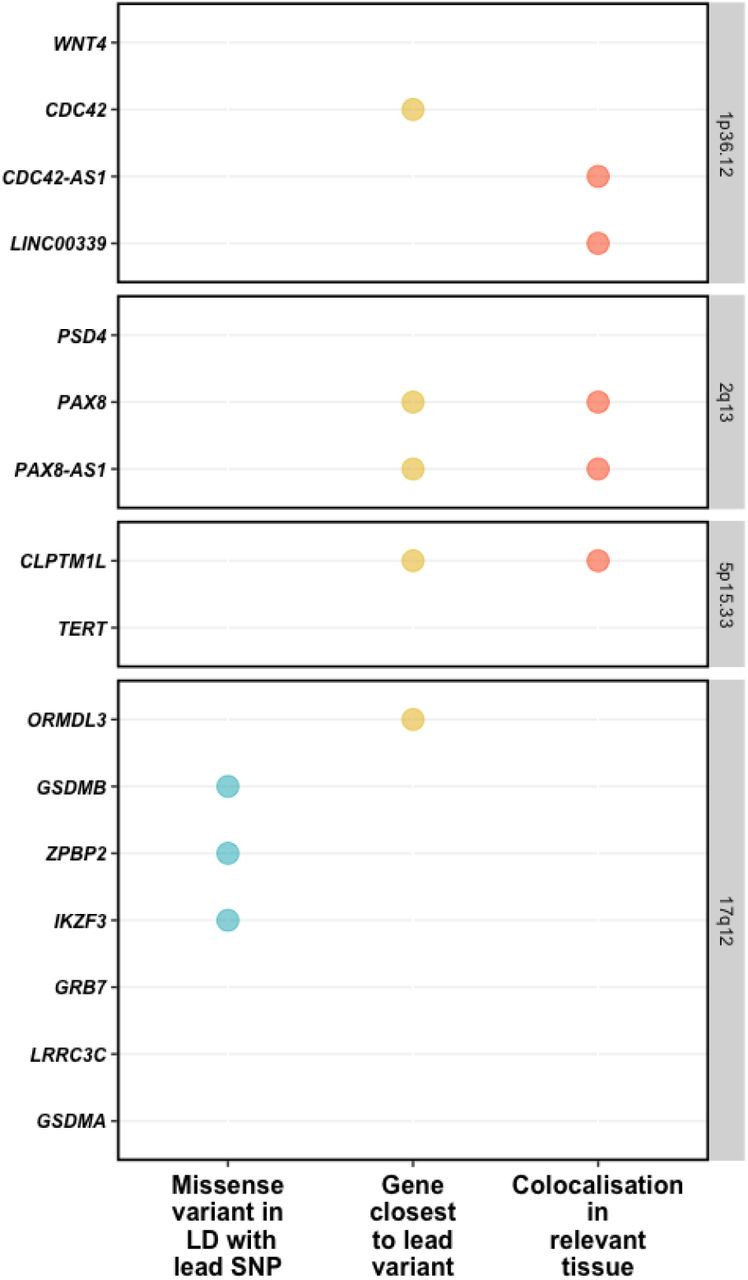
As a results, we identified five loci robustly associated with cervical cancer (Table 2; Supplementary Figure 3): 1p36.12 (rs2268177, p= 3.08 × 10⁻⁸), 2q13 (rs4849177, p=9.36 × 10⁻¹⁵), 5p15.33 (rs27069, p=1.31 × 10⁻¹⁴), 17q12 (rs12603332, p=1.18 × 10⁻⁹), and in the HLA region on 6p21.32 (trans-ethnic meta-analysis: rs35508382, p=1.04 × 10− 39; European ancestry analysis: rs28718232, p=2.55 × 10−44). We then proceeded to define the most likely causal SNPs and the most likely causal gene at each associated locus (except the HLA region, for which we conducted separate signal finemapping, see below) using the European ancestry meta-analysis results. We considered the following criteria when selecting the most likely candidate genes (Figure 1) - a) whether the lead signal is in LD with a coding variant in any of the nearby genes, b) which is the closest gene to GWAS lead variant in each locus, and c) is there significant (posterior probability >0.8) colocalisation in relevant tissues (tissues similar to female reproductive tract tissues based on cellular composition and gene expression). For credible set variants, we highlight those that potentially have a larger regulatory impact based on the HeLa cell line data (Supplementary Figure 4, Supplementary Table 6).

Visualised evidence for cervical cancer GWAS meta-analysis candidate gene mapping. We considered the following criteria when selecting the most likely candidate genes - a) whether the lead signal is in LD with a coding variant in any of the nearby genes, b) which is the closest gene to GWAS lead variant in each locus, and c) is there significant (posterior probability >0.8) colocalisation in relevant tissues (tissues similar to female reproductive tract tissues based on cellular composition and gene expression.
The lead variant on chr1 (rs2268177) is in the intron of CDC42, downstream WNT4. Colocalisation analysis showed the cervical cancer GWAS association colocalises with CDC42, CDC42-AS1 and LINC00339 expression/transcription events in several tissues and cell types (Supplementary Table 3) and the credible sets included 40 variants (Supplementary Table 4). CDC42-AS1 and LINC00339 were also mapped by colocalisation signal in relevant tissue (Figure 1), with high colocalisation probability between the GWAS signal and CDC42-AS1 gene expression in esophagus mucosa, and between the GWAS signal and LINC00339 transcripts ENST00000635675 and ENST00000434233 (the second most highly expressed transcript for this gene in GTEx endocervix data) in GTEx skin dataset. In both colocalisations, rs2473290 (in the intron of CDC42-AS1) explains most of the shared association (posterior inclusion probability 0.95-0.99). Of the other credible set variants, rs3768579 and rs3754496 are located in transcription start site (TSS) flanking regions of LINC00339 and CDC42 in HeLa cells, while rs72665317 and rs10917128 overlap with enhancer marks (Supplementary Table 6, Supplementary Figure 3). LINC00339 has a known role in promoting the proliferation of several cancers (32–34), while there is also evidence to link CDC42 expression with cervical cancer invasion and migration (35). The region has been previously associated with uterine fibroids, endometriosis, endometrial cancer (36), epithelial ovarian cancer, gestational age, and bone mineral density (Supplementary Table 7).
As with other cervical phenotypes, we observed a significant association on chromosome 2, where the lead genetic marker (rs4849177) is in the intron of PAX8. The GWAS signal colocalises with the expression of PAX8 and its potential regulator, PAX8-AS1, in several tissues and cell types, and the credible set included 29 variants. Of the credible set variants, rs1015753 overlaps with a TSS flanking region in HeLa cells, while another six variants overlap with regulatory enhancer elements (Supplementary Table 6). Colocalisation signals for PAX8 and PAX8-AS1 were also observed in several relevant tissues, including vagina (Supplementary Table 3), where the credible set included 13 variants (Supplementary Table 4), two of them overlapping with enhancer elements.
We compared the signal in the 2q13 locus across the analysed cervical phenotypes (Supplementary Figure 5; Supplementary Table 5) and found that the lead signals for ectropion (rs3748916) and cervicitis/dysplasia (rs1049137) are weakly correlated (r2=0.27, EUR), indicating independent or partly independent signals in the same region. The cervical cancer lead signal was moderately correlated (r2=0.45-0.53, EUR) with cervicitis/dysplasia and ectropion signals, respectively. This is supported by the fact that although the sets of most likely causal variants mostly overlapped for cervicitis, dysplasia, and cancer, the credible set variants seems to be different for ectropion.
The signal on chromosome 5 (lead variant rs27069) locates upstream CLPTM1L and overlaps with the TSS in HeLa cells (Supplementary Figure 4). Numerous colocalisations with different CLPTM1L QTL events were observed, including in skin and gastroesophageal junction datasets (Supplementary Table 3). CLPTM1L is a membrane protein and its overexpression in cisplatin-sensitive cells causes apoptosis. Polymorphisms in this region have been reported to increase susceptibility to cancer, including lung, pancreatic, and breast cancers (Supplementary Table 7). Variants in the credible set overlap with active TSS, as well as with several enhancer and ZNF repeat marks in the CLPTM1L gene (Supplementary Figure 4).
On chromosome 17, the lead signal (rs12603332) is in high LD (r2>0.8) with missense variants in ZPBP2, and GSDMB, including a splice acceptor variant (rs11078928) in GSDMB. GSDMB belongs to the family of gasdermin-domain containing proteins. Members of this family regulate apoptosis in epithelial cells, are linked to cancer, and GSDMB has been linked with invasion and metastasis in breast cancer cells (37) and in cervical cancer (38). Specifically, the splice variant rs11078928 deletes exon 6 encoding 13 amino acids in the critical N-terminus and abolishes the pyroptotic activity (pyroptosis is a type of cell death) of the GSDMB protein (39). This region has been previously associated with asthma, inflammatory bowel disease, ulcerative colitis, Crohn’s disease, multiple sclerosis, primary biliary cholangitis, rheumatoid arthritis and other disorders with an immune etiology, but also with cervical cancer (40).
Given the similarity in signals identified for cervical dysplasia and cervical cancer (Table 1 and 2), we jointly analysed the GWAS results for dysplasia and cancer and identified an additional signal on chromosome 19 (rs425787, p=3.5 ×10⁻⁸, Supplementary Figure 6) that remained sub-significant in the cervical cancer analysis alone (p=2.1×10− 7). Since this locus was not significant in the cervical cancer meta-analysis, it was not included in the colocalisation and fine-mapping analyses. The association signal overlaps with enhancer histone marks in HeLa cervical carcinoma cell line (Supplementary Figure 7) and is in the 3’ region of CD70. CD70 is a cytokine with an important role in T-cell immunity during antiviral response, and its high expression has been associated with a favorable outcome in cervical cancer patients (41).
Dysplasia signals stratified by dysplasia severity and in cancer
We stratified the dysplasia phenotype to evaluate the meta-analysis effect sizes (odds ratios) in relation to pathology severity. Figure 2 shows the effect estimates in dysplasia subphenotypes and in cervical cancer meta-analysis. In general, odds ratios correlated with degree of pathology, although there was an overlap in confidence intervals (Figure 2). An interesting exception seems to be rs12611652 near DAPL1, which is associated with different cervical dysplasia subphenotypes, but not with cervical cancer. DAPL1 is expressed in epithelium and may play a role in the early stages of epithelial differentiation or in apoptosis and is a suppressor of cell proliferation in retinal pigment epithelium (42). The GWAS signal colocalises with PKP4 expression in gastro-esophageal junction tissue, with three SNPs in the credible set (Supplementary Table 8). PKP4 regulates junctional plaque organisation, cadherin function, and cell adhesion.
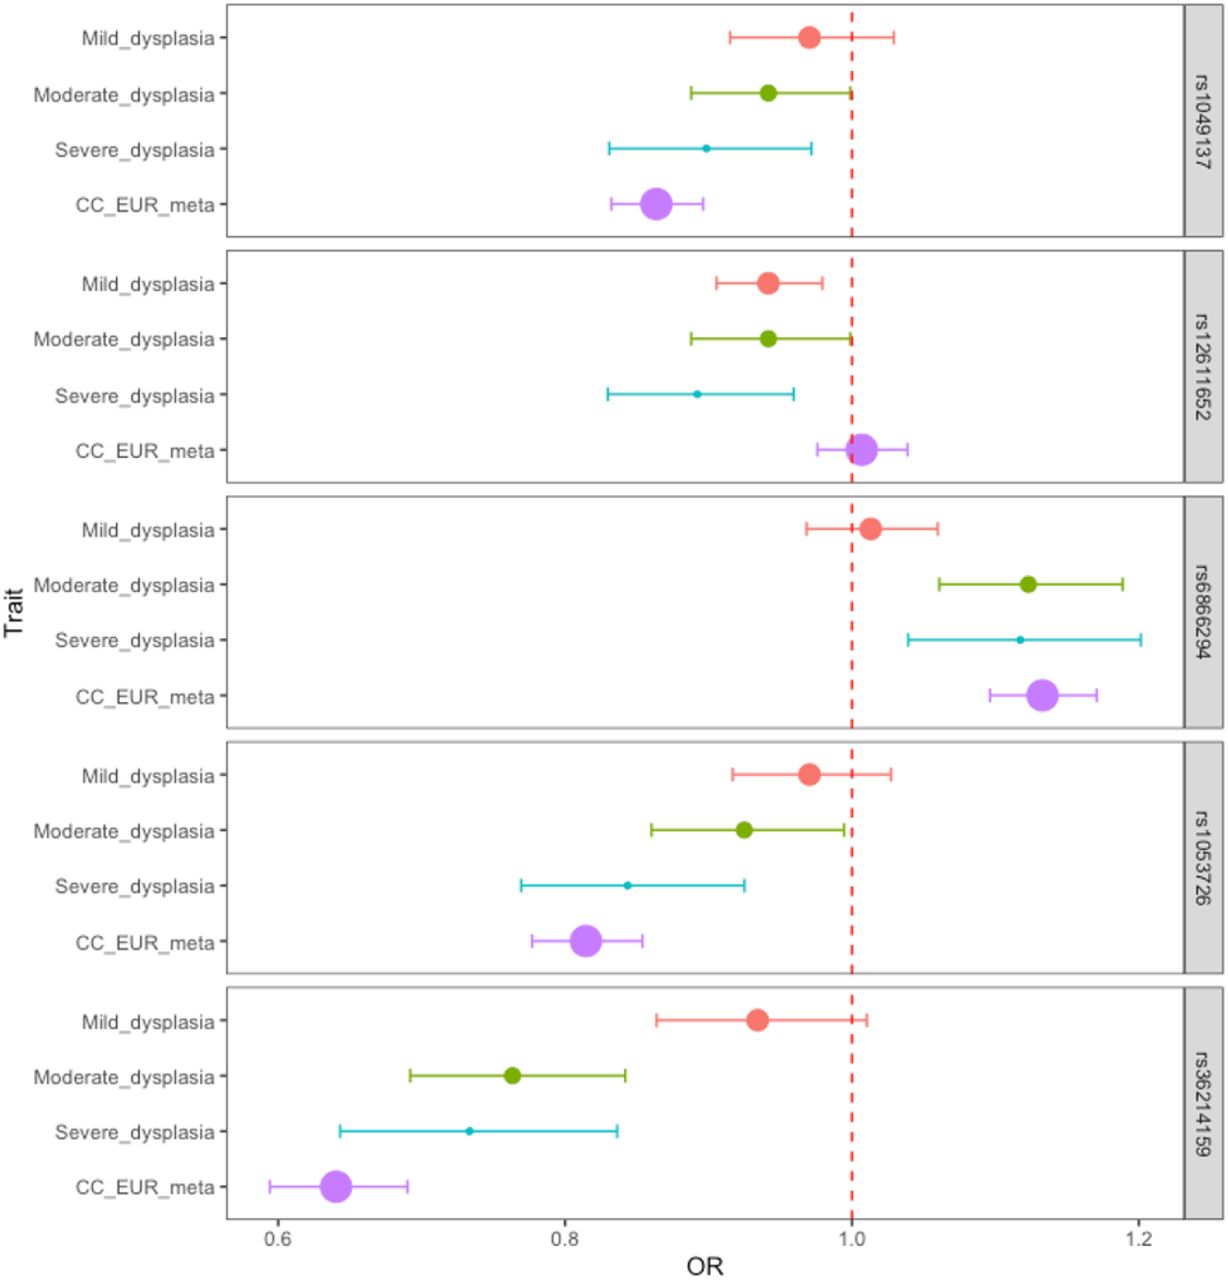
Dysplasia lead signals in different dysplasia stages and cervical cancer. Data are presented as odds ratios and 95% confidence intervals (error bars). The size of the dot is proportional to the effective sample size (calculated as 4/((1/N_cases)+(1/N_controls)).
All cervical cancer lead signals were at least nominally significant (p<0.05) in cervical dysplasia analysis, rs4849177 and rs35508382 were also genome-wide significant (Supplementary Table 2), confirming the similarity between genetic risk factors of cervical dysplasia and cancer.
HLA fine-mapping
Since both cervical dysplasia and cervical cancer show an association signal in the HLA region, we used the larger cervical dysplasia dataset in EstBB to further map the cervical dysplasia association signal in the HLA region. We found the HLA-DRB1 amino acid polymorphism at position 37 (p=1.4 ×10⁻¹⁸) drove the association in the HLA region (frequency in cases 15%, in controls 17%) (Figure 3). After conditioning on this, we observed an independent association with HLA-DRB1 amino acid polymorphism at position 30 (pcond=1.5 × 10⁻¹³). Further conditional analysis revealed an independent association with HLA-B:08 allele (pcond=1.0 × 10⁻⁸). After conditioning on these three associations, no further associations passed the genome-wide significance level. In the baseline model, HLA-DRB1*1201 (p=1.2 × 10⁻¹⁶), HLA-DRB1*1301 (p=1.5 × 10⁻¹¹), HLA-DQB1*0603 (p=1.2 × 10⁻¹¹), HLA-DQA1*0103 (p=1.6 ×10⁻¹¹), HLA-DRB1*0801 (p=2.2 ×10⁻⁸) and HLA-DQA1*0401 (p=2.8 ×10⁻⁸) alleles passed the significance threshold.

Conditional analysis of the HLA association identifies amino acid polymorphisms (blue circles) and alleles (yellow triangles) associated with cervical dysplasia. The y-axis shows the -log10 P-values for baseline model (top panel) and from stepwise conditional analysis of 10,446 cases and 81,586 controls in the EstBB. The red dashed line represents the genome-wide significance threshold (p<5×10⁻⁸).
Genetic correlations
We evaluated pairwise genetic correlations (rg) between cervical cancer and 33 selected traits from LD Hub. We found two significant (FDR<0.05) genetic correlations - age at first birth (rg=-0.37, se=0.08) and former vs current smoking status (rg=-0.45, se=0.14). Several other traits reflective of smoking behavior (incl. lung cancer) were also nominally significant (Supplementary Table 9).
Discussion
Despite cervical cancer being a considerable global problem, it is relatively rare and thus previous GWAS have been underpowered to fully characterise the genetic architecture of this disease. Although several GWAS for cervical cancer have been conducted in non-European populations, there has not been a highly-powered trans-ethnic meta-analysis. By bringing together all publicly available datasets, our analyses allow us to take a more comprehensive look into the genetic risk factors of cervical cancer, and furthermore, enable us to assess the genetic determinants of the cervical pathology spectrum. Previous studies have also not taken the step further to map the most likely causal genes and variants at each locus, which is important to understand the underlying biology.
In this study, we present the results from the largest trans-ethnic GWAS meta-analysis of cervical cancer and other cervical phenotypes, including up to 9,229 cervical cancer cases and 490,304 controls. Compared to the latest cervical cancer GWAS meta-analysis (8), our study is larger and has a trans-ethnic aspect, includes a wider selection of phenotypes, and uses multiple post-GWAS analyses to finemap the signals. We report four strong non-HLA signals (LINC00339/CDC42/CDC42-AS1, PAX8/PAX8-AS1, CLPTM1L, GSDMB), and leverage the latest computational methods and available genetical genomics datasets to pinpoint the most likely causal genes and variants for each associated locus. We further take advantage of the genetic similarity between cervical cancer and dysplasia to refine the association signal in the HLA locus to three independent association signals on amino acid polymorphism and two-digit allele level (HLA-DRB1 positions 30 and 37, and HLA-B*08), and propose a potential association on chromosome 19 near CD70, which can be followed up in further validation studies. By analysing the genetics of cervical ectropion and cervicitis in addition to dysplasia and cancer, we conclude that PAX8/PAX8-AS1 appears to have a dual role in cervical biology: PAX8 signaling is not only important for female genital system development, but PAX8 is also upregulated in reproductive cancers, enhancing the proliferation of tumor cells (43). Previously, it has been reported that several novel PAX8 transcripts can be observed in cervical carcinoma, indicating differential regulation properties during carcinogenesis (44).
Cervical dysplasia is the first step towards cervical malignancy. Overall, the identified genetic associations were very similar in both dysplasia and cancer, and mirrored closely the results from a recent joint analysis of severe dysplasia and cervical cancer (8). This indicates that further studies could include both phenotypes to increase power to detect novel associations. One exception was rs12611652 near DAPL1/PKP4, which was associated with dysplasia but not with cancer. Given that DAPL1 has a role in epithelial differentiation, apoptosis, and is potentially a suppressor of cell proliferation, and PKP4, highlighted in colocalization analysis, is associated with invasion and metastasis of cancer (45), both genes are interesting candidates for further analysis because of their potential protective effect in cervical malignancy development.
Our study provides additional support for potential causal variants and genes at each locus. Although previous studies have reported relevant association signals, they have not mapped the most likely causal genes and variants at each locus, which is an important step in understanding the underlying biology. Evaluating the colocalisation of GWAS signals from different traits (including gene expression) gives valuable information on potential shared causal variants, providing the necessary link between genetics, gene expression and disease risk. We were able to detect colocalisation with gene expression or transcription events for all the evaluated non-HLA loci, which provides evidence that variants in our GWAS signal are involved in regulating the expression or transcription of these genes. At the same time, since reproductive tissues are underrepresented in widely used gene expression datasets, we had to rely on tissues that are similar to female reproductive tract tissues, based on cellular composition and gene expression patterns. Therefore, more extensive characterisation of gene expression regulation in reproductive tract tissues is urgently needed to facilitate correct interpretation of GWAS signals. We also constructed the 95% credible sets of causal variants and compared them to chromatin annotations in HeLa cervical carcinoma cell line to evaluate which of these could potentially be most relevant for cervical cancer. Our analysis shows that several credible set variants overlap either with transcription start sites or enhancer regions, providing additional support for potential causal variants. Considering recent studies, it is plausible that there are several tightly linked causal variants in each locus (46) and functional studies are needed for further fine-mapping.
Overall, our results are in line with previous findings by replicating the associations near PAX8 (7, 8), CLPTM1L (8), HLA-DRB1 (47), HLA-B (8), and GSDMB (40). The association on chromosome 1 appears to be novel in the context of cervical pathology, although the region is a known risk locus for other gynecological problems, such as endometriosis, uterine fibroids, and ovarian cancer. Our results support LINC00339 and CDC42/CDC42-AS1 as the most likely candidate genes in this locus, which is in line with evidence from other cancers (32–35). In fact, previous studies have shown that knocking down LINC00339 expression leads to increased CDC42 expression (48), which is supported by data from eQTLs – variants associated with increased expression of LINC00339 have an opposite effect on CDC42 expression (49). Thus, it cannot be ruled out that several jointly regulated genes in this locus contribute to cancer pathogenesis.
The conducted genetic correlation analyses indicating significant genetic correlation between cervical cancer and age at first birth and smoking closely mirror the results from a recent Mendelian randomization analysis, which showed smoking increases, and older age at first pregnancy decreases the risk of cervical cancer, respectively (8). Several potentially interesting correlations (such as with parental age at death and lung cancer) were nominally significant in our analysis and future studies with larger sample sizes and more power are needed to fully elucidate the shared genetics between these traits and cervical malignancy.
Our analyses are based on population-based biobank data, which offers access to large sample sizes, but at the same time it can hinder the accessibility to more detailed clinical information (such as HPV status), especially when using summary-level data. Further studies evaluating the detected loci in relation to specific HPV strains or histopathological features will elucidate their more specific role in cervical pathology etiopathogenesis. We used relatively simple phenotype definitions based solely on ICD-codes, which on one hand simplifies data analysis, but on the other hand may introduce unwanted heterogeneity as the use of these codes might somewhat vary in different healthcare systems. However, we replicate many previously reported associations with cervical cancer, suggesting our approach is suitable. Although our study is the first attempt at a transethnic GWAS meta-analysis, the number of non-European samples is small, and given the high prevalence of cervical malignancy in non-European populations, additional Black and Asian populations should be included in analyses.
Our study provides the first insight into the genetics of cervical ectropion and cervicitis, which is an important step towards a complete understanding of cervical biology. We further clarify the genetic background of cervical malignancy, supporting the involvement of genes important for reproductive tract development, immune response, and cellular proliferation/apoptosis. The detailed characterisation of association signals, together with mapping of causal variants and genes offers valuable leads for further functional studies which may eventually lead to better treatment and prevention of cervical neoplasia.
Data Availability
FinnGen R5 data can be browsed and downloaded from https://r5.finngen.fi. Biobank Japan data can be browsed and downloaded from http://jenger.riken.jp:8080. GWAS meta-analysis summary statistics will be made available upon publication of this manuscript.
Author contributions
Data analysis: Mariann Koel, Urmo Võsa, Maarja Lepamets, Triin Laisk
Writing: Mariann Koel, Urmo Võsa, Priit Palta, Reedik Mägi, Triin Laisk
Data: Estonian Biobank Research Team, Susanna Lemmelä, Hannele Laivuori, Mark Daly
Group authorship: Estonian Biobank Research Team, FinnGen
Supplementary Tables
Number of cases and controls for each analysed phenotype
Cervical cancer GWAS meta-analysis lead signals in cervical dysplasia GWAS meta-analysis
Supplementary Figures

Regional plots for cervical ectropion (A) and cervicitis (B) GWAS meta-analysis signals on chromosome 2.

Regional plots for cervical dysplasia GWAS meta-analysis signals on chr2 (A, B), chr5 (C) and chr6 (D, E).
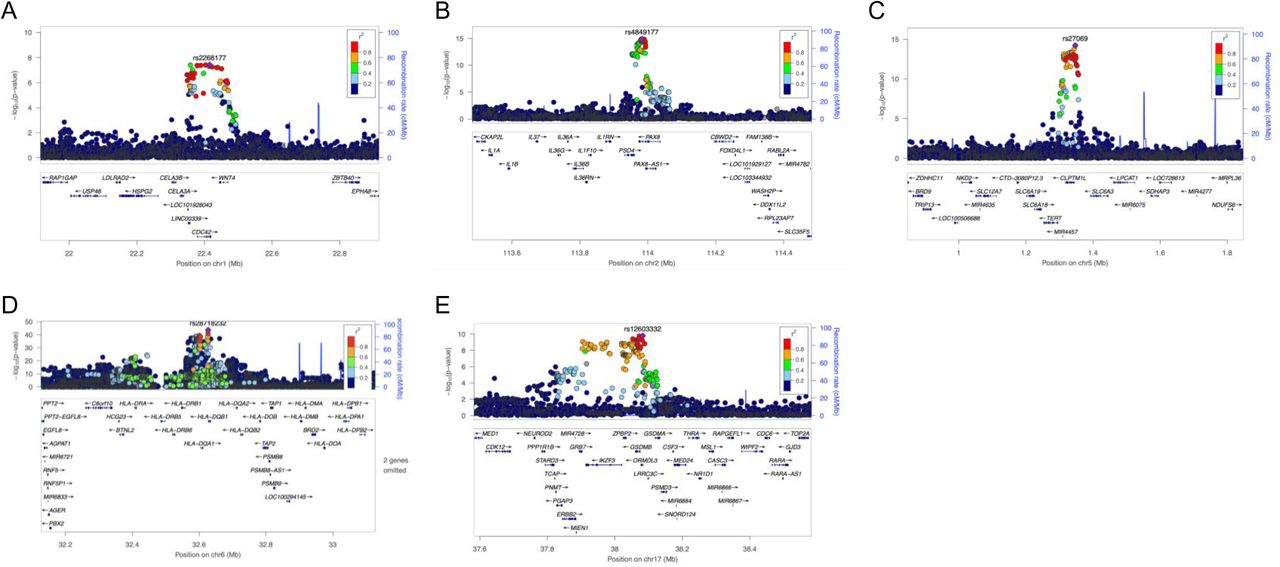
Regional plots for cervical cancer European ancestry GWAS meta-analysis signals on chr1 (A), chr2 (B), chr5 (C), chr6 (D) and chr17 (E).
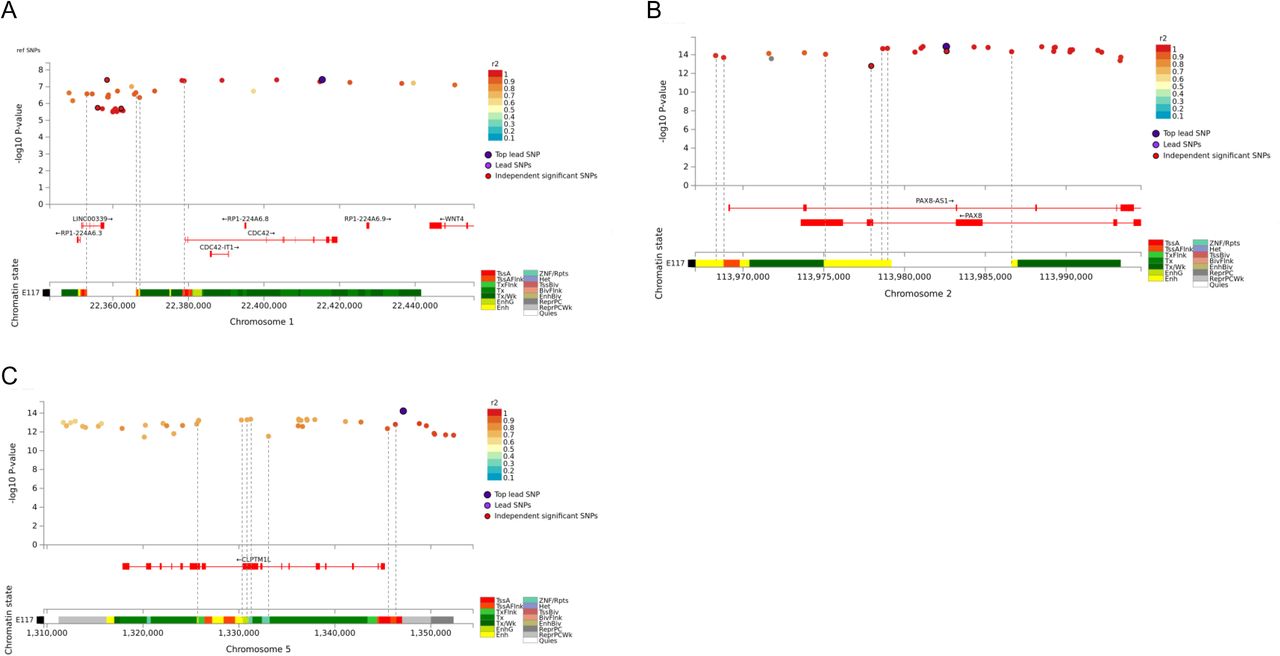
Cervical cancer GWAS meta-analysis credible sets for chr1 (A), chr2 (B), and chr5 (C), and their overlap with chromatin annotations in HeLa cell line (Encode Roadmap)

Venn diagram illustrating the overlap between credible set SNPs in cervical ectropion, cervicitis, dysplasia and cervical cancer

Regional plot for locus on chromosome 19 identified in MTAG joint analysis of cervical dysplasia and cancer.
Acknowledgements
This study was supported by European Union through Horizon 2020 grant INTERVENE, and by the Estonian Research Council grants PRG687 and PRG1291. Computations were performed in the High Performance Computing Center, University of Tartu. U.V was funded by the European Regional Development Fund and the programme Mobilitas Pluss (MOBTP108).
The FinnGen project is funded by two grants from Business Finland (HUS 4685/31/2016 and UH 4386/31/2016) and the following industry partners: AbbVie Inc., AstraZeneca UK Ltd, Biogen MA Inc., Bristol Myers Squibb (and Celgene Corporation & Celgene International II Sàrl), Genentech Inc., Merck Sharp & Dohme Corp, Pfizer Inc., GlaxoSmithKline Intellectual Property Development Ltd., Sanofi US Services Inc., Maze Therapeutics Inc., Janssen Biotech Inc, and Novartis AG. Following biobanks are acknowledged for delivering biobank samples to FinnGen: Auria Biobank (www.auria.fi/biopankki), THL Biobank (www.thl.fi/biobank), Helsinki Biobank (www.helsinginbiopankki.fi), Biobank Borealis of Northern Finland (https://www.ppshp.fi/Tutkimus-ja-opetus/Biopankki/Pages/Biobank-Borealis-briefly-in-English.aspx), Finnish Clinical Biobank Tampere (www.tays.fi/en-US/Research_and_development/Finnish_Clinical_Biobank_Tampere), Biobank of Eastern Finland (www.ita-suomenbiopankki.fi/en), Central Finland Biobank (www.ksshp.fi/fi-FI/Potilaalle/Biopankki), Finnish Red Cross Blood Service Biobank (www.veripalvelu.fi/verenluovutus/biopankkitoiminta) and Terveystalo Biobank (www.terveystalo.com/fi/Yritystietoa/Terveystalo-Biopankki/Biopankki/). All Finnish Biobanks are members of BBMRI.fi infrastructure (www.bbmri.fi). Finnish Biobank Cooperative -FINBB (https://finbb.fi/) is the coordinator of BBMRI-ERIC operations in Finland. The Finnish biobank data can be accessed through the Fingenious® services (https://site.fingenious.fi/en/) managed by FINBB.
References


