
ABSTRACT
COVID-19 prematurely ended many lives, particularly among the oldest Americans, but the pandemic also had an indirect effect on health and non-COVID mortality among the working-age population, who suffered the brunt of the economic consequences. This analysis investigates whether monthly excess mortality in the US during 2020 varied by age and cause of death. The data comprise national-level monthly death counts by age group and selected causes of death for 1999-2020 combined with annual mid-year population estimates over the same period. A negative binomial regression model was used to estimate monthly cause-specific excess mortality during 2020 controlling for the pre-pandemic mortality patterns by age, calendar year, and seasonality. The model included interactions between broad age groups and a dichotomous indicator for the pandemic (March-December) period of 2020 to test whether excess mortality varied by age. In relative terms, excess all-cause mortality (including COVID-19) peaked in December at ages 45-64 (RR=1.27, 95% CI=1.24-1.31). The results reveal notable excess mortality during April-December 2020 for influenza/pneumonia, external causes, diabetes, heart disease, and a residual category of other causes, but the vast majority of those excess deaths were among working-age (25-64) Americans. The largest share of non-COVID excess deaths resulted from external causes, nearly 80% of which occurred at working ages. Although misclassified COVID-19 deaths may explain some excess non-COVID mortality, neither misclassification nor an atypical flu season that disproportionately affected younger people is likely to explain the increase in external mortality. Exploratory analyses suggest that drug-related mortality may be driving the rise in external mortality. The social and economic upheaval resulting from the pandemic may have exacerbated the drug epidemic, but drug overdoses were already increasing for a year prior to the pandemic. Even if it were possible to vaccinate everyone and eradicate the SARS-CoV-2 virus, the drug problem will persist. The oldest Americans bore the brunt of COVID-19 mortality, but working-age Americans suffered the vast majority of excess non-COVID deaths, most commonly from external causes.
INTRODUCTION
Older Americans suffered the highest COVID-19 mortality, but we may be underestimating the indirect impact of the pandemic on mortality from other causes among the working-age population. Only 38% of the excess mortality1 among Americans aged 25-44 during March-July 2020 can be attributed directly to COVID-19 (1). Nearly two-thirds appears to have resulted from other causes (1).
Although they are much less likely than older Americans to die from COVID-19, younger Americans suffered the brunt of the economic consequences as their work lives were abruptly altered. Essential workers continued to be in high demand, but faced additional stressors (e.g., fear of exposure to the virus; shortages of personal protective equipment). An additional threat was posed by recalcitrant individuals who resisted public health orders, particularly when enforced by low-wage workers (e.g., grocery/retail store employees). Business owners had to grapple with logistical challenges resulting from new public health regulations and the financial aftermath of reduced demand for their services. Other workers suffered sudden income decline because of job loss or reduced hours as some jobs (e.g., hospitality) disappeared virtually overnight. The most fortunate workers retained their jobs with reduced exposure to SARS-CoV-2, but had to adapt to working from home and learning new technologies.
The unexpected closure of child care centers and schools further exacerbated the conflicts between work and family life for young and midlife Americans. With no warning, parents of young children lost access to child care services and became responsible for helping to homeschool their children, while continuing to juggle work demands and the potential needs of their own parents, who were particularly vulnerable to COVID-19.
Depending on the period of coverage and methodology, prior studies (2–4) have reported a 16-23% increase in excess mortality during the pandemic, but only 72-89% of those deaths can be attributed directly to COVID-19 (2–5). During the period from January 26, 2020 to October 3, 2020, Americans aged 25-44 suffered the largest relative increase in excess mortality (27% peaking at nearly 50% in mid-July), whereas those aged 85 and older experienced a smaller increment (15%, but also peaking near 50% in late April) (6). Excess mortality peaked earlier— in April—and declined more rapidly for Americans aged 45 and older than for their younger counterparts (aged 25-44), among whom excess mortality was persistently high (>30%) throughout early April to early August, peaking in mid-July (6).
It remains unclear how excess mortality from causes other than COVID-19 is distributed by cause and the extent to which it varies by age. Recent reports documented that, compared with 2019, the total number of deaths in 2020 increased for various causes: diabetes (15%), unintentional injuries (11%), stroke (6%), influenza & pneumonia (6%), and heart disease (5%) (7). That same report showed virtually no change in the number of deaths from cancer or kidney disease and revealed a small decline in deaths from chronic lower respiratory diseases (−3%) and suicide (−6%). Other evidence suggested that mortality from drug overdoses (8), homicides (9), and motor vehicle accidents (10) also increased during the pandemic. The extent of change in alcohol-related mortality for the US as a whole remains unknown, but some evidence showed increased alcohol consumption, particularly among women and Americans aged 30-59 (11), and provisional data for Minnesota implied that alcohol-attributable deaths were 25-65% higher in June-December 2020 than in the same months in 2019 (12). To our knowledge, no US study has investigated the extent to which excess mortality for specific causes of death varies by age.
This analysis quantifies the changes in mortality for selected causes of death during the COVID-19 pandemic up to December 31, 2020. In addition, the models evaluate the extent to which the levels of excess mortality varied by age group and across the months of 2020.
METHODS
Data
These analyses were based on national-level monthly death counts by age group (0-4, 5-14, 15-24, 25-34,…75-84, 85+) and selected causes of death for the period from January 1999 to December 2020, although the data for 2020 remain provisional.2,3 Although the provisional data for 2020 covered the period through March 2021 (13), this analysis was restricted to the period through December 31, 2020, because the data the data for 2021 are likely to be incomplete (15). Annual mid-year population estimates by age (16,17) were used to compute the cause-specific death rates. Collectively, the dataset represented 56.8 million deaths over 6.7 billion person-years of observation for the entire US population.
Measures
Outcome: Age-Specific Death Rates for Selected Causes of Death
Models were fit separately for the following groups of causes for which the provisional monthly death counts by 10-year age group were available: 1) influenza and pneumonia (J09-J18; 1.2 million deaths); 2) other respiratory diseases excluding COVID-19 (J00-J06,J30-J47,J67,J70-J98; 3.8 million); 3) heart disease (ICD-10 codes I00-I09,I11,I13,I20-I51; 14.2 million); 4) cancer (C00-C97; 12.6 million); 5) cerebrovascular disease (i.e., strokes, transient ischemic attacks (TIA), aneurysms, and vascular malformations; I60-I69; 3.2 million); 6) Alzheimer’s disease (G30; 1.9 million); 7) diabetes mellitus (E10-E14; 1.7 million); 8) nephritis, nephrotic syndrome and nephrosis (i.e., kidney disease; N00-N07,N17-N19,N25-N27; 1.0 million); 9) external causes (derived as deaths from all causes minus deaths from natural causes; 4.1 million); and 10) a residual category of all other causes except COVID-19. For comparison with the cause-specific results and with prior studies of overall excess mortality, models were fit for all-cause mortality (including and excluding COVID-19). The latter excluded deaths attributed to COVID-19 as either the underlying or a contributing cause.
Control Variables
To account for the pre-pandemic patterns of mortality during 1999-2019, the models controlled for age, calendar year, and seasonality. The specification of the time trend varied by outcome (see Analytical Strategy).
Mortality During 2020
The key variables of interest were the dichotomous indicators for each month during 2020. To test whether excess mortality during 2020 differed by age group, a set of dummy variables for broad age groups (i.e., <15, 15-24, 25-44, 45-64, 65-74, 75+) was interacted with a dummy variable for the pandemic period (March-December 2020).
Analytical Strategy
The monthly age-specific mortality rates for each cause of death were modeled using a negative binomial model (see Supplementary Material for the detailed equation). The model included control variables to account for the age pattern, seasonality, and the pre-pandemic time trend. The functional form for the time trend varied by outcome: a linear specification fit best for influenza and pneumonia mortality, whereas a cubic specification yielded the best fit for all other outcomes. To evaluate the sensitivity of the results to the specification of the time trend, an auxiliary set of models were estimated using a quadratic specification for all outcomes. Because seasonality of mortality varies by age (28), the models for all-cause mortality and non-COVID mortality included interactions between month and age. Those interactions did not improve model fit for the cause-specific models and thus, were omitted. All models included interactions between the time trend and age because recent mortality decline has varied by age (19).
An additional set of dummy variables for each month of 2020 are included to estimate the extent to which monthly mortality differed from the pre-pandemic time trend. Prior to March, there were few COVID-19 deaths in the US, and the pandemic had yet to make a substantial impact on everyday life here. Thus, rate ratios were expected to be close to 1.0 for January and February (i.e., indicating that mortality in early 2020 did not differ from 2019 after adjusting for the seasonality of mortality). To test whether excess mortality varied by age, the model included interactions between broad age groups (<15, 15-24, 25-44, 45-64, 65-74, 75+) and a dichotomous indicator for the pandemic (March-December) period of 2020. Those interactions improved model fit for all outcomes.
Finally, exploratory were estimated to test whether the effects varied by both age group and wave of the pandemic (i.e., Wave 1: March-June; Wave 2: July-September; Wave 3: October-December).4 Those additional interactions were omitted from the final analysis because they did not improve model fit based on the Bayesian Information Criterion (BIC).
For some groups of causes, the death rates were exceptionally low at young ages, which can result in very high rate ratios. Thus, the cause-specific models were restricted to the age range within which the average death rates in each age group across 1999-2020 were at least one per million: ages 15 and older for heart diseases; ages 25 and older for cerebrovascular diseases, diabetes mellitus, and other respiratory diseases; ages 35 and older for kidney disease and influenza/pneumonia; and ages 55 and older for Alzheimer’s disease.
The estimated number of excess deaths was computed as the difference between: 1) the predicted number of deaths in 2020 based on the model coefficients, and 2) the predicted number of deaths when the 2020 monthly parameters and the interactions between age and the pandemic indicator was reset to zero (i.e., “expected” deaths in the absence of a pandemic).
RESULTS
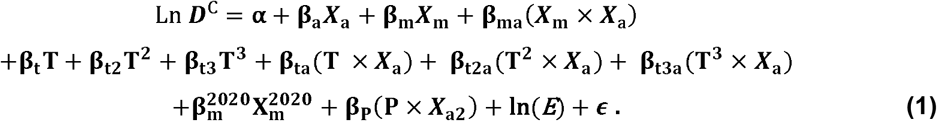
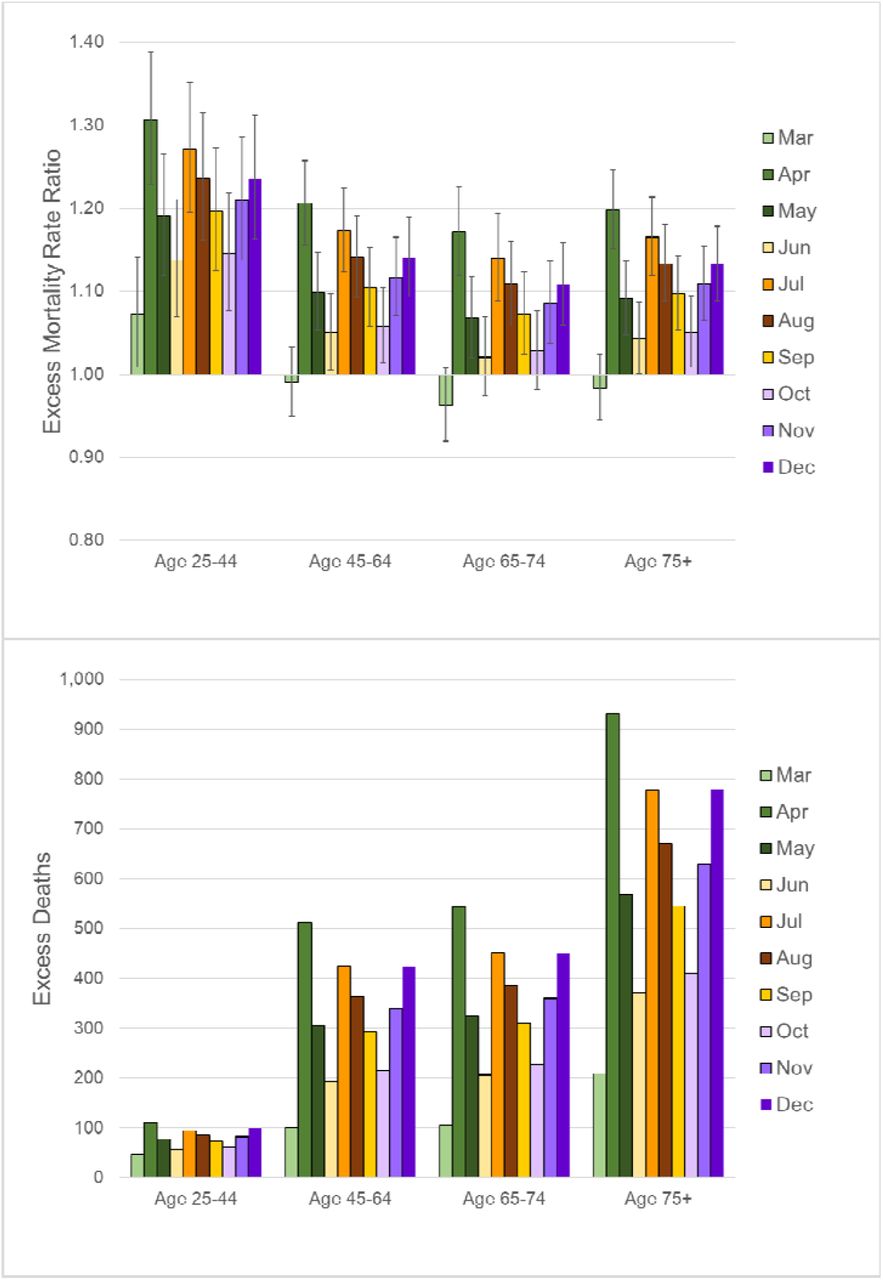
Death rates during January and February 2020 were similar to or lower than expected based on the pre-pandemic trends with one exception: mortality from influenza and pneumonia was 17% higher in January (RR=1.17, 95% CI=1.10-1.35) and 28% higher in February (RR=1.28, 95% CI=1.11-1.48; Tables S2). In contrast, during April-December 2020, death rates above age 15 were substantially higher than expected for all-cause mortality (Figure 1). In relative terms, excess mortality from all causes was similar across ages 45 and older, and only slightly lower for those aged 15-44; yet, the absolute number of excess deaths was much larger at the oldest ages (Figure 1). At younger ages, where mortality rates are low, a substantial increase in the relative risk can translate into a very small absolute increment in the number of deaths. For example, the ratio ratios were as high, if not higher, at ages 45-64 (e.g., RR=1.26 in April, 95% CI=1.23-1.29) than at ages 75 and older (e.g., RR=1.25 in April, 95% CI=1.21-1.28), but the estimated number of excess deaths in March-December 2020 was much lower for those aged 45-64 (82,449) than for those 75 and older (223,890; Table 1). Americans aged 75 and older accounted for more than half of the 402,743 excess deaths.
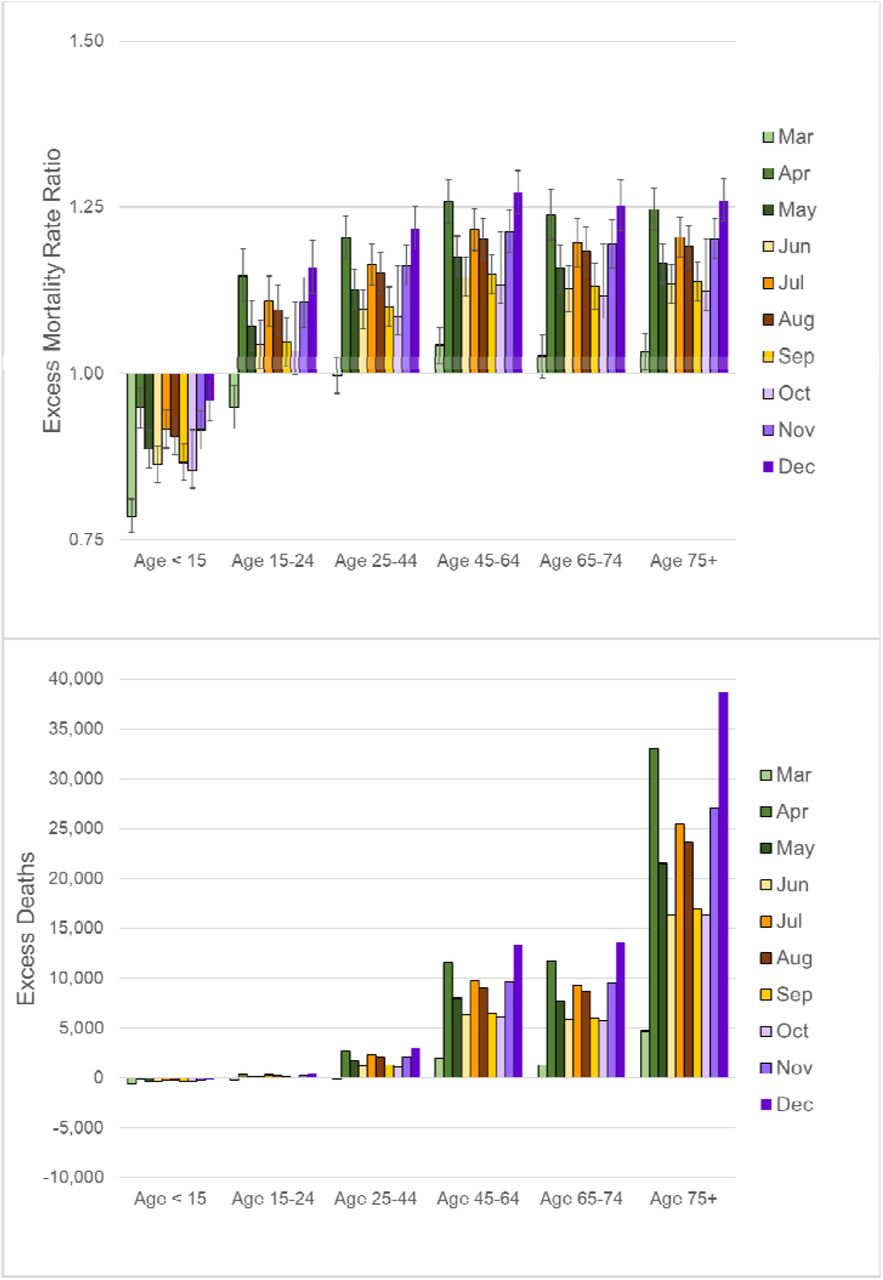
Note: These estimates are based on the regression models shown in Table S1. A rate ratio higher than 1.0 implies that the mortality rates were higher than expected based on the pre-pandemic trends, whereas a value less than 1.0 suggest lower than expected mortality rates.
The bulk of excess mortality at the oldest ages resulted from COVID-19. When deaths attributed to COVID-19 were excluded, the rate ratios were highest at ages 15-64 (Figure 2), and most of the excess deaths from causes other than COVID-19 occurred among working-age Americans (Table 1).

Note: These estimates are based on the regression models shown in Table S1. All deaths from COVID-19 as either the underlying or a contributing cause are excluded.
When mortality was modeled separately by cause, the results imply that the largest share of non-COVID excess deaths resulted from external causes, nearly 80% of which occurred at working ages (Table 1). As shown in Figure 3, the excess mortality rate ratios for external causes peaked in July among those aged 15-24 (RR=1.14, 95% CI=1.06-1.22), but were consistently higher than expected during May-November for Americans aged 15-64.

Note: These estimates are based on the regression models shown in Table S2.
The second largest share of non-COVID excess deaths resulted from diabetes (Table 1). The rate ratios for diabetes mortality were highest at ages 25-44 and peaked in April (RR=1.31, 95% CI=1.23-1.39), but were only slightly lower above age 45 (Figure 4). Because diabetes mortality rates were much higher at older ages (even prior to the pandemic), the number of excess deaths was much greater above age 45. Two-thirds of the excess diabetes deaths occurred above age 65 and 93% were above age 45 (Table 1).

Note: These estimates are based on the regression models shown in Table S2.
During March and April, mortality from influenza and pneumonia was elevated at all ages above 25 (Figure S1A), which could be a result of misclassified COVID-19. There was also evidence of excess mortality from other causes, but it was limited to specific age ranges. For example, excess mortality from other respiratory diseases was restricted to ages 25-44 (Figure S1B). Throughout April-December, mortality from heart disease was higher than expected at working ages, but not significantly elevated above age 75 (Figure S1C). Cerebrovascular mortality was also significantly higher in May-October and December 2020, but only at working ages (Figure S1D). Other causes showed little evidence excess mortality at any age: cancer (Figure S1E), kidney disease (Figure S1F), and Alzheimer’s disease (Figure S1G). The residual category of deaths from all other causes except COVID-19 exhibited slightly elevated rates during June-November primarily at working ages, but also above age 75 (Figure S1H).
Above age 65, the only non-COVID causes with significant excess mortality were diabetes, influenza/pneumonia (at ages 65-74), and the residual category (above age 75). For some causes (e.g., other respiratory disease, heart disease), there were fewer deaths than expected above age 65 (Table 1). Whether non-COVID deaths were modeled as a whole or separately by cause, the vast majority of those excess deaths occurred among working-age Americans.
Sensitivity of the Results to Specification of the Pre-Pandemic Time Trend
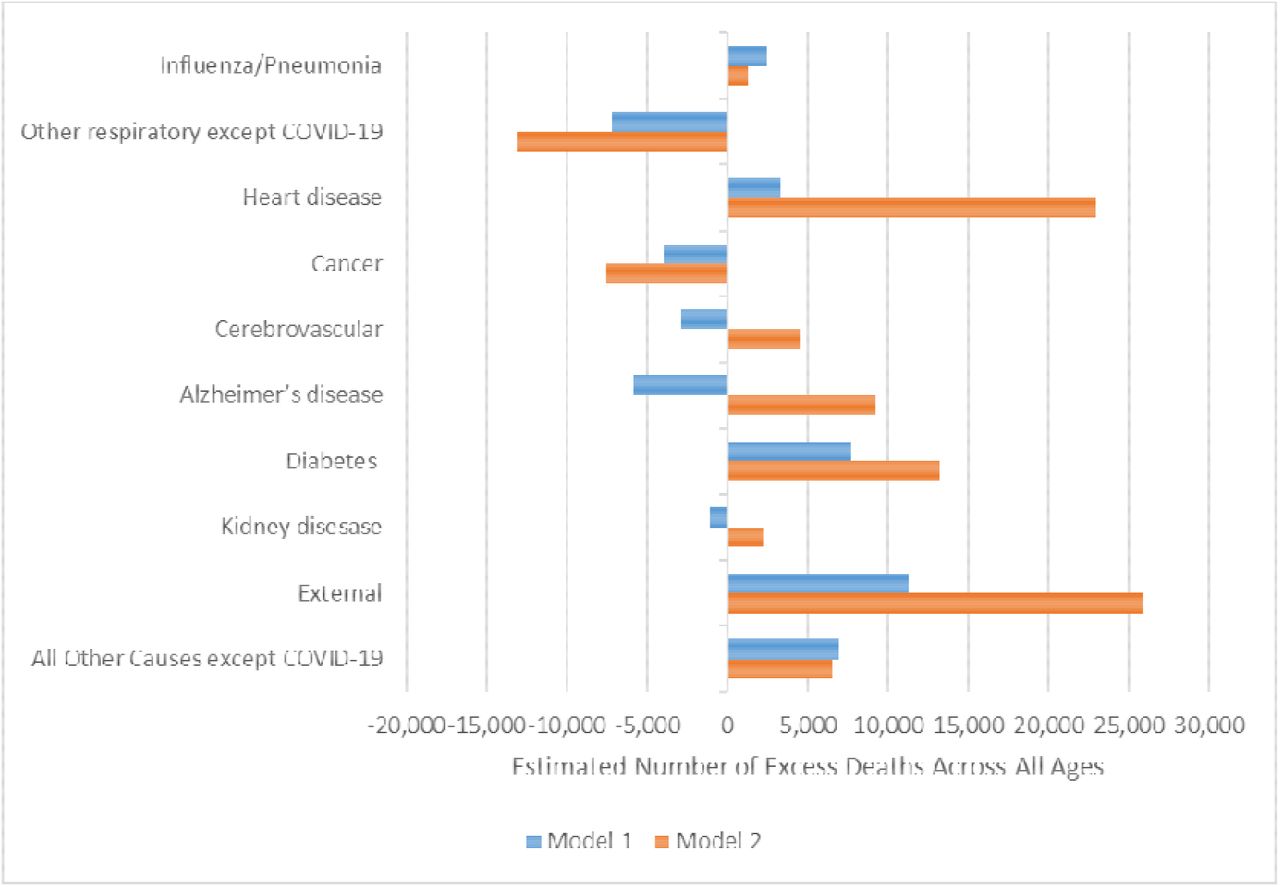
When the models were re-estimated using a quadratic specification for the pre-pandemic time trend, the predicted number of excess deaths was substantially higher for heart disease, external causes, Alzheimer’s disease, cerebrovascular disease, and diabetes (Figure 5). The biggest difference was for heart disease (i.e.,, 3,281 based on a cubic specification; 22,962 with a quadratic specification for the time trend). The quadratic specification implied that heart disease mortality at the oldest ages declined monotonically over the period from 1999-2019, whereas the cubic specification suggested a recent leveling off or perhaps even a slight increase in heart disease mortality after 2017. For example, the observed heart disease mortality rate for those aged 85 and older declined by 9% between 2009 and 2014, whereas it declined by only 4% between 2014 and 2019. Heart disease accounted for 24% of all deaths in 2019; thus, even a small difference in the assumed trend can have a large effect on the expected death count. The predicted number of heart disease deaths in a hypothetical pandemic-free 2020 was substantially lower for the quadratic specification than for the cubic specification, resulting in a much larger estimate of excess deaths. The pattern was similar for Alzheimer’s disease, diabetes, and external causes: the cubic specification was better able to capture the recent pre-pandemic stagnation or rises in mortality from those causes.

Note: Model 1 represents the specification shown in Table S2 (i.e., linear time trend for influenza/pneumonia; cubic time trend for all other outcomes). Model 2 is an alternative specification that assumes a quadratic time trend for all outcomes.
Exploratory Analysis of Sub-Categories of Mortality from External Causes
While it would be ideal to analyze external mortality in more detail, monthly death counts by age group are not yet available for sub-categories within external causes.5 Nonetheless, it was possible to do some exploratory analyses based on crude monthly death rates for drug overdoses,6 homicides, suicides, motor vehicle accidents, and unintentional injuries as a whole7 (21). Currently, these provisional data are available only through October 31, 2020. These exploratory models were similar to the models described above (i.e., they were adjusted for seasonality and the pre-pandemic time trend in mortality), but because age-specific data are not yet available, it was impossible to adjust for age or evaluate the extent to which excess mortality for these causes varied by age. Drug overdoses exhibited the highest excess mortality (peaking 24% higher than expected in May; RR=1.24, 95% CI=1.12-1.37) followed by homicides (peaking 19% higher than expected in August; RR=1.19, 95% CI=1.03-1.37). There was no evidence of significant excess mortality from motor vehicle accidents; in fact, rates were 30% lower than expected in April (RR=0.70, 95% CI=0.64-0.76), 19% lower in March (RR=0.81, 0.74-0.88), and 16% lower in May (RR=0.84, 95% CI=0.77-0.91). As demonstrated in earlier studies, suicide mortality was significantly lower than expected throughout March-October, with the biggest declines in April (−17%), May (−11%), and October (−11%).
DISCUSSION
Excess mortality is likely to be, at least partly, a result of misclassification of COVID-19 deaths. Woolf et al. (22) noted that during the early stages of the pandemic, some COVID-19 deaths may have been classified as other respiratory causes (e.g., pneumonia) or causes reflecting related-complications (e.g., coagulopathy, myocarditis). Similarly, Rossen et al. (6) suggested that increases in circulatory diseases, Alzheimer’s disease and related dementias, and respiratory diseases could have resulted from COVID-19 deaths that were incorrectly classified. Our results imply that influenza and pneumonia exhibited the highest degree of excess mortality, but this category is particularly likely to include misclassified COVID-19 deaths, especially early in the pandemic when testing for SARS-CoV-2 was limited. Surprisingly, excess mortality from influenza and pneumonia was higher at ages 25-74 than at the oldest ages. It is possible that misclassification of COVID-19 deaths was more likely at younger than at older ages. Alternatively, there may have been excess mortality from influenza that was unrelated to COVID-19, particularly at younger ages. Analyses by the Centers for Disease Control and Prevention suggested that children under the age of 5 and adults aged 18-49 were more severely affected by the 2019-20 season than in other severe flu seasons such as 2009 H1N1 pandemic and the 2017-18 season (23).
While misclassification of COVID-19 deaths could account for excess mortality from influenza/pneumonia, circulatory diseases, and other natural causes, it is unlikely to explain the increase in mortality from external causes. Instead, excess mortality from injury-related causes is likely to be an indirect result of economic distress, the disruption of normal life, and heightened uncertainty. Exploratory analyses of crude death rates within sub-categories of external causes suggest that the increase in external mortality may have been driven primarily by drug-related mortality. While the pandemic may have exacerbated the drug epidemic, the number of drug overdoses began increasing more than a year prior to the pandemic. Provisional data from NCHS suggest that drug overdoses rose every month after February 2019, although the pace increased in the fall of 2019 and even more sharply after March 2020 (20). Alcohol-related mortality may have also increased during the pandemic, but data are not yet available to answer that question. Early in the pandemic, many experts predicted that suicides— which represent the third component of the so-called “deaths of despair”—would increase, but instead the evidence suggests that suicide rates declined during April-October 2020. Analyses by the National Center for Health Statistics showed the same pattern: lower numbers of suicides during April-May 2020 relative to the same weeks in 2016-19 (24).
Next to influenza and pneumonia, diabetes exhibited the largest relative increase in mortality and excess diabetes mortality persisted throughout 2020. The social and economic consequences of the pandemic were likely to pose a special challenge for those with chronic diseases that require careful daily management. Delayed health care for fear of infection, diversion of health care resources, and shortages of staff and equipment could have contributed to excess mortality from chronic diseases such as diabetes. Economic distress, disruptions of social life and support networks, and other stressors induced by the pandemic may have further hampered the management of chronic conditions. For diabetics, a lapse in glucose control or the temptation to ration insulin because of financial difficulty or loss of employer-sponsored health insurance, can have deadly consequences.
Although the results showed no evidence of excess cancer mortality, there could be a lagged effect. Whereas a myocardial infarction or stroke can cause sudden death, cancer generally kills much more slowly. Delays in standard screening and reluctance to visit a doctor for a suspected problem may have reduced early detection and could later manifest as rising cancer mortality.
Lower levels of non-COVID excess mortality at the oldest ages could be a result of competing risks. Older Americans who died from COVID-19 could not die of another cause. Many COVID-19 deaths occurred in nursing homes among people with chronic illnesses such as Alzheimer’s disease, circulatory disease, or kidney disease, which might have otherwise eventually caused their death. Even if COVID-19 was the underlying or a contributing cause of death, such pre-existing conditions increased their susceptibility to serious complications if they were infected with SARS-CoV-2.
Limitations
These analyses are based on provisional death counts for 2020, which are likely to be under-estimated, particularly during Wave 3. Because of lags in reporting, some of the deaths for December are likely to be missing from the provisional data, especially for injury-related deaths (e.g., only 70% of drug overdoses are reported within 13 weeks after the death) (15).
Problems of misclassification are likely to plague the cause-specific mortality data. Over the course of the pandemic, as the availability of testing increased and medical examiners became more experienced identifying COVID-19, cause-of-death reporting undoubtedly improved. Thus, part of the decline in apparent excess mortality as the pandemic progressed could be a statistical artifact of more accurate reporting of COVID-19 deaths.
Data are not yet available to examine age variation in excess mortality from more detailed causes such as drug- and alcohol-related mortality, homicide, motor vehicle accidents, and suicides. Once county-level data become available, this analysis will be extended to explore geographic variation in the impact of the pandemic on the deaths of despair and other external mortality. There is already ample evidence that socioeconomically-disadvantaged communities were harder hit by COVID-19 than more advantaged communities (5,25–27). It seems likely that the pandemic further exacerbated socioeconomic disparities in drug- and alcohol-related mortality. Similarly, it will be interesting to investigate whether the decline in suicide benefited all communities equally. Well-off communities may have been able to mount a more effective response that benefited all residents, whereas more disadvantaged communities experienced further social disintegration and rising deaths of despair.
In future analyses, it will be important to investigate the extent to which non-COVID excess mortality varies by sex and race/ethnicity as well age. Although provisional monthly death counts are available by selected causes of death, age, sex, and race/ethnicity, those more detailed data are likely to have more small cells in which the death count was suppressed to protect confidentiality, particularly for minorities at younger ages. A thorough analysis by age, sex, and race/ethnicity may not be possible until the final death counts are released.
Conclusion
Overall, most non-COVID excess mortality occurred among working-age Americans. When modeled separately for selected causes of death, there was evidence of excess mortality during April-December 2020 from influenza/pneumonia, external causes, diabetes, heart disease, and a residual category of other causes, but the vast majority of those excess deaths were among working-age Americans. Above age 65, there was little non-COVID excess mortality except from diabetes, influenza/pneumonia (for those aged 65-74), and the residual category (for those above 75). Undoubtedly, the oldest Americans suffered the brunt of COVID-19 mortality, but working-age Americans suffered substantial increases in mortality from other causes of deaths during 2020.
The largest share of non-COVID excess deaths resulted from external causes, which are likely to be an indirect result of the social and economic consequences of the pandemic. Yet, other data indicates that drug overdoses were increasing for a year prior to the pandemic. The social and economic upheaval resulting from the pandemic may have exacerbated the drug epidemic, but that problem began well before the pandemic and will persist even if it were possible to vaccinate everyone and eradicate the virus.
The number of excess deaths at younger ages may seem small compared with COVID-19 mortality at the oldest ages, but early deaths have a disproportionate effect on overall life expectancy. The US already had a midlife mortality crisis; the pandemic has deepened that crisis.
Data Availability
All of the data used in this analysis are publicly available from the National Center for Health Statistics and the U.S. Census Bureau.
SUPPLEMENTARY MATERIAL
MODELING STRATEGY
Monthly mortality rates by age group and selected cause of death were modeled using negative binomial regression, which allows for an over-dispersed Poisson distribution (i.e., this model is appropriate for outcome variables generated by either a Poisson or a Poisson-like distribution in which variation is greater than that of a true Poisson). The outcome variable was the number of deaths from a specified cause (DC) for a given month-year-age group, but the model controlled for the number of person-years of exposure (E):
 Thus, the model can be rewritten with the logged death rate (ln MC), where MC represents deaths (DC) divided by exposure (E), on the left-hand side:
 The first part of the model was designed to capture levels and trends in background mortality prior to the pandemic: Xa represents a set of dummy variables for each age group (i.e., 0-4, 5-14,…74-84, 85+) to account for the age pattern of mortality; Xm is a set of dummy variables for each month to capture the seasonality of mortality; and T denotes calendar year. In preliminary analyses, data for 1999-2019 were used to test several specifications for the pre-pandemic time trend (i.e. linear, quadratic, cubic, dummy for each calendar year). For most outcomes, the cubic specification yielded the best fit (based on the Bayesian information criterion). The one exception was influenza and pneumonia mortality, for which there was no significant time trend and thus, the linear specification produced the best fit. Thus, the cubic specification shown in Equation 1 was used to account for the time trend in pre-pandemic mortality for all outcomes except influenza and pneumonia, for which a linear specification was used. The models for all-cause and non-COVID mortality also included an interaction between month (Xm) and the age dummies (Xa) to allow seasonality to vary by age, as demonstrated by prior work (28). The month-by-age interactions were omitted from the cause-specific models because preliminary analyses indicate they did not improve model fit. All models included interactions between the time trend parameters and age because mortality decline has been slower or even reversed among working-age Americans during recent years compared with older Americans, especially those aged 80 and older (19).
The second part of the model was designed to determine the extent to which mortality in 2020 differed from the pre-pandemic time trend. The model included an additional set of dummy variables for each month of 2020  . To test whether excess mortality during the pandemic varied by age, the model also included interactions between a dichotomous indicator (P), which denoted the period of 2020 after COVID-19 was declared a pandemic (March-December), and a set of dummy variables for broad age groups (i.e., <15, 15-24, 25-44, 45-64, 65-74, 75+, represented by Xa2). For this interaction, several of the age groups for which the risk of COVID-19 mortality was likely to be similar were combined. In addition, an exploratory model was estimated to evaluate whether excess mortality varied by both age and wave of the pandemic. As shown in Equation (3), this model added interactions between a dummy variable for each wave (W2 for Wave 2 and W3 for Wave 3, with Wave 1 serving as the reference group) and the set of dichotomous variables for the broad age groups (Xa2). The specification of the time trend was the same as in the previous set of models, although Equation (3) shows the cubic specification.


Note: These rate ratios are based on the regression models shown in Table S2.
ACKNOWLEDGMENTS
Special thanks for Maxine Weinstein, Magali Barbieri, Samuel H. Preston, Theresa Andrasfay, Andrew Stokes, and Noreen Goldman for their comments on early drafts of this manuscript. This research was supported by grants from the National Institute of Aging (R03 AG058110 and center grant P30 AG012839) and the Society of Actuaries.
Footnotes
The model has been substantially revised to take into account age variation in the seasonality of mortality and in the rate of mortality decline. The current model assumes a cubic specification for the pre-pandemic time trend for all outcomes except influenza/pneumonia for which a linear specification yielded the best fit. Also, a category for the residual (all other causes except COVID-19) was added for the cause-specific analyses. Finally, the results show the estimated number of excess deaths by cause as well as the ratio ratios representing excess mortality during 2020.
↵1 Unless otherwise indicated, “excess mortality” includes deaths from all causes including COVID-19.
↵2 The final death counts for 1999-2019 include some deaths of unknown age. The maximum was 11 deaths of unknown age from external causes in November 1999, which represented less than 0.2% of all deaths from external causes in that month. Within each group defined by calendar year, month, age, and the selected cause of death categories (see Measures section), we redistributed those deaths proportionately based on the distribution of deaths where age was known.
↵3 In the provisional data, death counts below 10 have been suppressed to protect confidentiality. Cells with suppressed counts were randomly assigned a value between 1 and 9. In the national data used for this analysis, the only suppressed death counts were for COVID-19, most of which occurred at ages below 15 or during January-February 2020. There were only nine cells with a suppressed count above age 15, all of which occurred in January-February 2020.
↵4 As indicated by the 7-day COVID-19 death rates for the US as a whole (18), COVID-19 mortality rose rapidly between March 7, 2020 (0.01 per 100,000) and April 23rd (4.83 per 100,000) and then generally declined until June 22nd (1.29 per 100,000), thus ending the first wave. After that, the rates rose again, peaking on August 3rd (2.38 per 100,000) and declining after that until October 6th (1.42 per 100,000), thus ending the second wave. Finally, the COVID-19 death rate increased again in late October through early January, peaking on January 13, 2021 (7.22 per 100,000) and fell after that to 1.25 per 100,000 on 5/12/2020.
↵5 Currently, the provisional data by month and age group are available only for 13 broad groups of causes. The National Center for Health Statistics imposes a six-month lag on the release of deaths resulting from drug overdoses (and other types of external causes such as suicides, homicides, and traffic-related fatalities) in order to ensure that the data are reasonably complete (20). Cause of death certification for injury-related deaths often involve lengthy investigations (e.g., toxicology testing, autopsy) (15).6 Includes all drug overdoses, regardless of intent. Thus, the category overlaps with homicides and suicides.
↵6 Includes all drug overdoses, regardless of intent. Thus, the category overlaps with homicides and suicides.
↵7 Including unintentional drug overdoses.
REFERENCES


