
Abstract
Sepsis is an essential issue in critical care medicine, and early detection and intervention are key for survival. We established the sepsis early warning system based on a data integration platform that can be implemented in ICU. The sepsis early warning module can detect the onset of sepsis 5 hours proceeding, and the data integration platform integrates, standardizes, and stores information from different medical devices, making the inference of the early warning module possible. Our best early warning model got an AUC of 0.9833 in the task of detect sepsis in 4 hours proceeding on the open-source database. Our data integration platform has already been operational in a hospital for months.
1 Introduction
Sepsis, a syndrome of physiologic, pathologic, and biochemical abnormalities induced by infection, is a global healthcare issue that is associated with unacceptably high mortality and long-term morbidity among ICU patients (1, 2), and is responsible for substantial cost burden on health care resources (3). Early detection and timely administration of appropriate antibiotics may be the most important factors to improve the prognosis of sepsis patients (4). However, nonspecific symptoms of sepsis patients leading to delayed diagnosis and delayed intervention (5).
Machine learning has been emerging as a promising tool to the early detection of the occurrence of sepsis via intensive management based on electronic medical records, laboratory data, and biomedical signals (6-8). Calvert et al have built a regression model for sepsis prediction which can predict at least three hours prior to a sustained SIRS episode based on nine available vital signs (9). Kam and Kim used the same nine vital signs to build neural network models (10). Lauritsen et al presented a neural network model constructed with a convolutional neural network followed by a recurrent layer of long short-term memory network to predict sepsis onset up to 24 hours preceding at most (11). Futoma et al used a Multiple-Output Gaussian Process (MGP) to preprocess raw physiological data and then the values were fed into a recurrent neural network (12). Mitra and Ashraf took only six raw vital sign data to detect sepsis or predict 4 hours before the onset by several machine learning models (13).
In 2016, Singer et al proposed a new definition (Sepsis-3) of sepsis which was defined as life-threatening organ dysfunction caused by a dysregulated host response to infection (2). According to this, many recent papers defined sepsis by Sequential Organ Failure Assessment (SOFA) and infection instead of SIRS. Desautels et al used eight vital signs to detect or predict sepsis with preonset prediction times 4 hours at most (14). Nemati et al calculated 65 features hourly and built a modified Weibull-Cox proportional hazards model to predict sepsis in the proceeding 4 to 12 hours (15). Moor et al employed a temporal convolutional network embedded in a Multi-task Gaussian Process Adapter framework (16).
Most works on sepsis detection were based on historical medical data such as Medical Information Mart for Intensive Care (MIMIC) (17) and eICU (18). However, deploying the detection model in a hospital, especially in ICU for real-time prediction isn’t a trivial matter. As the first step, model inference involves collecting raw data, such as bedside data, laboratory data, demographic data, doctor’s orders, etc., usually from different brands of devices. But at present, there are problems that information cannot be interactive collaborated because of the difference in data transmission protocol between different devices. Some efforts have been made. In the 1990s Hewlett-Packard presented a comprehensive clinical information system named CareVue (19). Smielewski et al developed ICM+ software that allowed easy configuration and real-time trending of complex parameters derived from multiple bedside monitoring devices (20). Sorani et al collected over 20 physiological variables in neurocritical care monitoring automatically at 1-minute intervals and the data was outputted into text files (21). Meyer et al implemented a system for the operating room that integrates data from surgical and anesthesia devices, information systems, and a location tracking system (22). Goldstein et al developed a real-time, physiologic data acquisition system in the pediatric intensive care unit (23). The signals collected are sent to a data storage workstation through the patient data server and a local area network. Then signals are converted to text files and stored on CD-ROM. Gjermundrod et al implemented the Intensive Care Window which can retrieve and integrate data from different patient monitoring devices in ICU (24). Sun et al proposed an integrated system INSMA, which supports multimodal data acquisition, parsing, real-time data analysis, and visualization in the ICU (25).
In this paper, we built an ICU bedside sepsis early warning system, including a sepsis early warning module and the data integration platform. The data integration platform is used to collect and store standard, structured clinical data, while the sepsis early warning module achieves real-time predictions for every patient in ICU.
2 Method
2.1. Data Integration Machine Design
We developed a Mini Integrated Box for Ruijin Hospital, which has the ability of data acquisition and transmission of different brands of medical devices. The Mini Integrated Box is composed of customized device connection lines, a hub, and an integrated data receiver. The identification module containing encoding is inserted into each medical device, enabling the integrated box to identify the type of online device and collect data automatically according to the communication protocol. The integrated data receiver is used to receive and translate the raw data and upload it to the integration server through the local area network. The Mini Integrated Box has the following function:
Device online services: detecting device connections and starting a data reading program corresponding to the device.
Decoding: parsing raw data into structured data for further processing.
Storage: storing parsed data into native memory.
Remote Settings: supporting remote system setup and sending system status.
Uploading: uploading the received data to the specified database.
2.2. System Framework
The Web release system of the sepsis early warning system applies Brower/Server (B/S) architecture. Its network architecture is shown in Fig 1, which includes:
Data storage layer. Using SQL Server, the data sources including interface data, service data, model prediction are stored and managed.
Data access layer. The data access layer completes the reading and writing operation for the database, provides data support for the business logic layer or display layer, updates the data of human-machine interface, and uses standard SQL to access databases.
Business logic layer. The business logic layer uses the AJAX interface to respond to the browser’s request based on the Web server and provides business support for the browser-side interface, including some related service: real-time calculation of SOFA score, determination of suspected infection, data statistics, data charts, historical data query, etc.
Application display layer. The application display layer is the highest level of the early warning system. The user’s request is passed to the Web server in this layer, and the processing results are displayed in the system, including home page, first-level page, navigation bar tab, embedded page, and prompt page. Java Script program is used for dynamic HTML page development and AJAX interface is used for data interaction with the Web server.

The display layer applies Bootstrap、VUE、JQuery UI、Echarts、Datatables and other technologies to build a chart platform, achieves human-machine interaction, data display, and other service functions through the Web interface. Spring MVC is used to build full-featured MVC modules for Web applications, combined with NODEJS to provide an elegant and highly maintainable way to create templates.
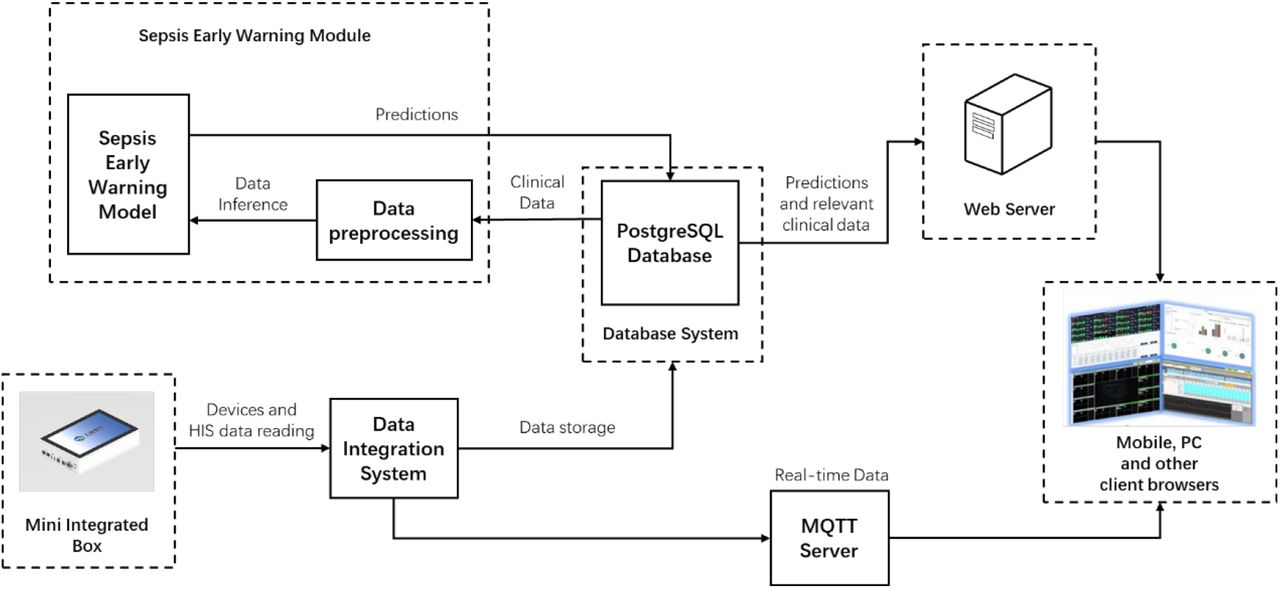
Fig 2 summarizes the system deployment framework. The architecture includes a physical server in which the PostgreSQL database is used to store the data of sepsis warning and the Web server is used to deploy the user access portal of the system. The architecture can be divided into the following parts:
Background: The mini integration box transmits the devices and HIS data to the data integration system through the local area network. Heterogeneous data is integrated in the integration system, and the part the sepsis early warning module needs is sent to the PostgreSQL database. When the sepsis warning module is called, data fetching, data cleaning, feature extraction, standardization, and other preprocessing are implemented in turn. Then the model inference will be carried out, and the prediction results will be stored in the PostgreSQL database.
Middleground:Web server responds to the browser’s request, calls the sepsis early warning module, and returns the prediction results, while the MQTT server sends real-time data from the data integration system to the browser.
Foreground: Users can use the system anytime and anywhere with a browser in a variety of ways such as PC and mobile terminals.

2.3. AI Models
Data Sources and inclusion criteria
Our study used Medical Information Mart for Intensive Care (MIMIC-III) database (version 1.4) (17) and the private local hospital database. MIMIC encompasses approximately 40,000 patients admitted in the ICU at the Beth Israel Deaconess Medical Center in Boston from 2001 to 2012. We first trained machine learning models on MIMIC and later transferred them onto the local database, ensuring enough patient cases. For comparison with other articles, we focus on the MIMIC model training process and results.
Patients that meet all of the following criteria were included in the case group:
At least 14 years of age.
The onset of sepsis happens at least 5 hours later than admission to the ICU.
The onset of sepsis is the first time since admission to the hospital.
Patients that meet all of the following criteria were included in the control group:
The age is more than 14 years old.
Patients that stay in ICU for at least 5 hours and haven’t sepsis in the ICU stay.
Patients that do not have the ICD-9 code for sepsis (785.52, 995.91, 995.92).
The change of SOFA score is not more than 1 point in arbitrary continuous 72 hours in the ICU stay.
Sepsis label definition
Patients were followed throughout their ICU stay until discharge or development of sepsis according to the Third International Consensus definitions for sepsis (Sepsis 3) (2). Specifically, if the timestamp of antibiotics (tabx) and blood cultures (tculture) meet the condition tabx ‐ 24h ⩽ tculture ⩽ tabx + 72h, the earlier timestamp of tabx and tculture will be defined as the timestamp of suspected infection (tsus). Sequential Organ Failure Assessment (SOFA) score is evaluated per hour within the time window [ tsus ‐ 48h, tsus + 24h]. The first hour that has two or more points rise in the SOFA score than the least score before it is defined as the onset of sepsis (tonset).
Dataset Preparation
78 variables of patients from MIMIC were chosen as the raw data of dataset. A complete list of these variables is provided in Appendix I. We excluded significantly incorrect records by setting the range of variables according to the specialists. When integrating the same variables from different sources, we set priorities to extract values with the highest confidence. After data cleaning, these data were summarized per hour into the maximum, average, median, and minimum except for some changeless or durative variables, which in total were 285 features. Padding would be used if there was no value at the corresponding time. The padding values were taken as the nearest value before, or the average among all patients when no value was valid since the patient’s admission. Episodes with too few valid variables were removed to ensure the data quality. We used a 5-hour-long time window from the episodes to predict sepsis, thus each sample point in these tasks had 1425 features. Finally, we got the dataset with 1057 positive episodes and 5834 negative episodes. We divided the dataset into a training set, a validation set, and a test set. For negative episodes, we divided them with proportion 7:1:2. For positive episodes, we chose the same number with the negative ones into the validation set and test set. The rest of positive episodes were put into the training set. Over-sampling of positive sample points or down-sampling of negative sample points were used to ensure that the proportion was 1:1 in each set.
Machine learning models
Multiple models were tested, including Support Vector Machine (SVM), Multi-Layer Perceptron (MLP), Gradient Boosting Machine (GBM), and Long Short-Term Memory (LSTM). For GBM we used XGBoost (26) and LightGBM (27) as the implementations.
Training method
Some redundant features had been removed to accelerate the training of SVM and MLP. For SVM, all average features and features whose coefficient of variation was larger than 2 were used and for MLP, only one of the maximum, average, median, and minimum of each laboratory variable was kept in consideration of the low record frequency. Data was standardized (i.e. the value range of each feature is linearly scaled between 0 and 1) before training to eliminate magnitude differences among features and reduce distribution differences between the two datasets.
The hyperparameters of each model were tuned according to the effects on the validation set. We chose linear kernel function and 1 as the penalty factor in SVM. For MLP, we used a six-layer architecture which is shown in TABLE I. We chose 256 as batch size, 0.001 as the learning rate, 0.6 as the dropout rate, and 0.001 as the weight decay coefficient in MLP. We set max_depth as 6, colsample_bytree as 0.2, and other configurations as default in XGBoost while we set num_leaves as 5, lambda_l2 as 0.1, learning rate as 0.2, and other configurations as default in the LightGBM. During the LSTM training, we used an LSTM architecture with four hidden LSTM layers with 16 one-cell memory blocks and a fully connected layer with 1 output unit added, followed by a sigmoid function. We set the learning rate as 0.0001and batch size as 2000.
I UNITS IN EACH LAYER OF MLP
3. Results
3.1. AI models
We evaluate our models by accuracy, AUC (the area under the receiver operating characteristic curve), sensitivity and specificity on the test set. The performances of SVM, MLP, XGBoost, LightGBM and LSTM are shown in TABLE II-TABLE VI in turn.
THE RESULT OF SVM
THE RESULT OF MLP
THE RESULT OF XGBOOST
THE RESULT OF LIGHTGBM
THE RESULT OF LSTM
From the tables above, we can find that the AUCs of XGBoost and LightGBM are the highest among these AI models, followed by MLP and LSTM, and SVM performs worst. Although the structure of gradient boosting machine is relatively simple, its performances are better than that of the artificial neural network models, which may be due to the complexity of artificial neural network model, leading to poor generalization. While LSTM doesn’t show better performance than MLP. In each model, the five tasks of predicting sepsis from 1 to 5 hours in advance don’t show significant differences in the predicting AUC with each other.
We compare our AI models with other models trained on the same open-source database, MIMIC and report results on prediction within 5 hours before the onset of sepsis, including InSight (14), AISE (15), MGP-TCN and DTW-KNN (16), and MLA (28). The results are shown in TABLE VII.
THE RESULTS OF DIFFERENT MODELS
MLA only reports results at 0h, 24h, or 48h in advance of sepsis onset while other models report results including 4h in advance, so we fix the number of preceding hours to four except MLA’s. We choose LightGBM and LSTM as representatives of the gradient boosting machine and artificial neural network models to compare with other models. It can be found that our models perform better, mainly due to the more detailed data cleaning and data preprocessing, as well as richer features. MLA also used XGBoost as the classifier, but it only took six vital signs, and MLA is trained on the database at the University of California, San Francisco (UCSF) Medical Center, not directly on the MIMIC, so the AUC is lower, whether 0h or 24h in advance.
Model inference: we use Python to implement these models. In the inference, we apply Python.Net package to realize the interaction between .NET Framework and Python, and SQLAlchemy package to realize the interaction between Python and the database system. The detailed steps of model inference are:
Obtain the real-time features of patients by the SQL query statements, and pass them into Python through the interaction between Python and PostgreSQL.
Standardize the features by calling scaler, the standardizing function obtained in the training set.
Call the trained models to get the prediction results.
Transmit the results to the .NET Framework using Python.Net.
Output and store the results in a standard format.
3.2. System Deployment
Fig 3 shows the mini integrated box installed in Ruijin Hospital. The box was placed at the bedside, receiving data from multiple devices via different interfaces shown at the bottom of the figure, storing the past 72 hours data into native memory, and transmitting the data with a time delay of fewer than 10 seconds. Concretely, the box can integrate data from the monitor, ventilator, infusion pump, and dialysis machine. The interfaces include two universal network interfaces, four USB interfaces for mouse, keyboard, U disk, etc., two HDMI and one VGA for extended display, and eight or sixteen USB and Ethernet multiplexing interfaces for medical devices.

3.3. System Operation
The sepsis early warning system provides predictions and explanations for every ICU patient every hour, including the risk of sepsis onset in the next 5 hours, the influence of features on predictions calculated by SHAP (29), and SOFA predictions. It has been operating in Ruijin Hospital for more than three months, providing hourly early warning services for more than one hundred ICU patients. Together with the data integration platform, the sepsis early warning system helps doctors focus on patients who are more likely to develop sepsis and observe changes in physiological data and conditions more conveniently.
Fig 4 shows an example of UI on the PC terminal in the hospital conference room. The interface can present 12 patients at one time, including their sepsis onset predictions and SOFA changes. In this figure, a red bar indicates a high risk while a blue bar indicates a low risk. Fig 5 shows another example. In this interface, doctors can select several indicators of interest to observe the patient’s past development. Some titles in the UI are Chinese, and translations are placed nearby.


4. Conclusions
In this study, we established an ICU bedside sepsis early warning system to achieve the real-time prediction of ICU patients through the data integration platform. This system has been installed in Ruijin Hospital. Medical workers can easily and timely identify the potential risk of sepsis patients for intervention. At the same time, the platform can display the patient’s historical data in the user interface, to facilitate doctors to obtain the change of the patient’s condition intuitively.
Moreover, this workflow is also applicable to other disease warnings, not only the sepsis warning. With the help of data integration platform, we can easily acquire patient data which can be used in different models designed for multiple tasks. Again, with the help of data integration platform, we can store rich structured data to help future data analysis and model training.
Data Availability
The data that support the findings of this study are available from the corresponding author upon reasonable request.


