
ABSTRACT
Background WHO-recommended prevalence thresholds for deciding schistosomiasis mass drug administration (MDA) are based on anecdotal evidence and unclear.
Objectives This systematic review and meta-analysis commissioned by the WHO, as part of its new schistosomiasis evidence-based guideline development, was to generate a single and ‘global’ prevalence threshold that should be applied in MDA programmes.
Methods We searched several databases from 1979 to 31st March 2021 without language restriction. Two reviewers selected studies, extracted data and assessed the risk of bias using relevant risk of bias tools and resolved disagreements through discussion. The review followed the PRISMA guidelines. Data were analysed and presented as prevalence reduction (PR) and relative risk (RR) for dichotomous outcomes or mean difference for continuous outcomes with their 95% confidence intervals (CIs). Meta-regression of observations on prevalence rates and intensity of infection of MDA programmes and sensitivity analyses to assess the robustness of the results to the risk of bias components were performed. Evidence on benefits, harms, values, preferences, compliance, acceptability, equity and feasibility were also assessed. The overall level of evidence was graded using GRADE.
Results Out of 1,232 studies retrieved, 38 studies met our inclusion criteria and 34 studies were included in the meta-analysis. No direct relation was observed between prevalence and intensity of infection. Praziquantel reduced prevalence of S. haematobium in school age children (SAC) at 12 months (RR 0.38, 95% CI 0.28 to 0.52; 8 studies, n=37,868); at 24 months (RR 0.30; 95% CI 0.30 to 0.52; 7 studies; n=37107); at 36 months (RR 0.39, 95% CI 0.21 to 0.71; 5 studies, n=28,146). There was no significant reduction in prevalence at 48 months (2 studies, n=10,954). For S. mansoni, there were reductions in prevalence at 12 months (RR 0.56, 95% CI 0.46 to 0.69; 14 studies, n=86,073); 24 months (RR 0.46; 95% CI 0.32 to 0.66; 14 studies; n=83,721);36 months (RR 0.44, 95% CI 0.33 to 0.58; 7 studies, n=70,933) and at 48 months (RR 0.25, 95% CI 0.11 to 0.59; 5 studies; n=27,483). Further analyses were performed from a series of created prevalence thresholds of 5%, 10%, 15%, 20%, 30% and ≥ 40% which showed differences in effect of MDA when each of the thresholds was applied. For annual MDA of school age children (SAC), school-based treatment (SBT) appears to perform better than community-wide treatment (CWT) in terms of prevalence reduction. For the different schistosome species, the model suggests, using the same prevalence threshold, it will take shorter time to reach elimination for S. haematobium than S. mansoni; annual MDA using SBT approach for S. haematobium will require about 10 years to achieve elimination whereas it will take over 10 years to around 15 years to achieve elimination for S. mansoni.
Conclusion The evidence presented in this systematic review suggests that 10% prevalence should be used as the global prevalence threshold for implementing MDA in endemic countries.
BACKGROUND
The ultimate goal of schistosomiasis control is to prevent new infection or transmission by interrupting the parasite’s lifecycle. This has been difficult to achieve, therefore, WHO guidelines have changed several times over the years from selective treatment (i.e. screening entire populations and treating positive cases), morbidity control to focus on symptomatic individuals or those with heavy worm loads and likely to suffer infection-related complications and passive case finding (push for hospital attendance by individuals with schistosomiasis-related symptoms) to Preventive chemotherapy (PC) adopted in the new millennium at the World Assembly (WHA54.19) in 2001 (WHO 1985; WHO 1993; WHO 1998; WHO 2002; WHO 2006; WHO 2012a; WHO 2012).
Within the PC concept backed by resolution WHA54.19, endemic countries were urged to embark on mass drug administration (MDA) with Praziquantel (PZQ) at a single 4o mg/kg oral dose to treat at least 75% of school-aged children at risk of the infection by 2010 (WHO 2002). WHO experts met and developed operational guidelines from Resolution WHA54.19 with emphasis on morbidity control, using defined thresholds of prevalence of infection as criteria for classifying at-risk populations, and selecting appropriate intervals of mass MDA (WHO 2002). Schools-based MDA was identified as most cost-effective. Since then, hundreds of millions of school-going children living in endemic countries have received multiple treatment with PZQ. The governments of endemic countries and international non-governmental organizations including the Schistosomiasis Control Initiative (SCI), the Schistosomiasis Consortium for Operational Research and Evaluation (SCORE), both funded by the Bill and Melinda Gates Foundation, the United States Agency for International Development (USAID) the British Department for International Development (DFID and the Global Network for neglected tropical diseases have been key in delivering MDA (Fenwick A et al. 2009; Hotez 2009, 2011; Linehan et al. 2011; King et al. 2020).
In 2006, the operational details of PC were revised (WHO 2006) to expand the target population for MDA to include adults and special risk groups, for example, occupationally exposed individuals in high-risk areas where prevalence of infection in school-age children reaches 50%. In 2012, following the release of the WHO Schistosomiasis Progress Report that reviewed the global progress towards control and elimination from 2001 to 2011 and set the agenda to guide control from 2012-2020 (WHO 2012a). The new goals (intensity-based not aligned to the prevalence-based thresholds) aimed to control morbidity and eliminate schistosomiasis as a public health problem using appropriate diagnostic criteria. It also specified that tools needed for routine testing should be sensitive and easy to use, should be able to demonstrate presence of the parasite or marker of current infection, and should easily be adapted for use in peripheral health facilities with minimum cost and resource capacity. The WHO also urged member states to increase control effort towards elimination (WHO 2012a). At the same time the NTD road map and the London Declaration of NTD encouraged partners to pledge commitment towards reaching up to 100% of school-aged children living in endemic regions by 2020, and to eliminate the disease in some regions (WHO 2012b; Uniting to Combat NTDs 2012). PZQ donation was to exceed 250 million tablets per year and Countries and Programme Managers were encouraged to deliver the medicine to all at risk populations at frequencies determined by prevalence of infection.
Resolution WHA65.21 called WHO to develop guidelines for countries to embark on elimination programs and provide tools to document progress (WHO 2012). It also requested WHO to develop procedures to evaluate the interruption of transmission and to certify that transmission of schistosomiasis has been eliminated. Further goals and targets of the Strategic Plan recommended appropriate diagnostic approaches and tools for mapping control programmes and to verify interruption of transmission. Appropriate tools are to be selected at each stage of progress towards elimination of the disease. The test should be sensitive, easy to use in the field and be able to categorize communities according to risk profiles, taking into account likely compliance in providing specimens. Ideally, in Africa settings, the test should be able to differentiate schistosome species since most areas are co-endemic and show mixed infections in individuals.
Given that the scaling up of schistosomiasis control through PC has significantly brought down prevalence and intensity of infection in most endemic settings to levels such that routinely used diagnostic tests are no longer sensitive to detect the infection or monitor progress of control, CCA test was endorsed as representing an effective tool for the detection, monitoring and evaluation of S. mansoni control programmes (WHO Strategic Meeting in Geneva). The endorsement followed evidence generated from WHO-commissioned systematic review and meta-analysis that assessed the comparative accuracy of Point-of-care Circulating Cathodic Antigen (POC-CCA) and existing tools (Danso-Appiah et al. 2016; Barenbold et al. 2018).
The current thresholds for MDA with PZQ is that, if baseline prevalence among school-age children is >= 50% by parasitological methods (intestinal and urogenital schistosomiasis) or >= 30% if based on questionnaires for history of haematuria or >= 60% by CCA in S. mansoni endemic areas, all school-aged children (enrolled and not enrolled) should be treated once a year. Adults considered to be at risk (from special groups to entire communities living in endemic areas) should also be treated. Additional interventions should include water, improved sanitation, hygiene education (WASH) and snail control. For baseline prevalence among school-aged children >=10% but <50% by parasitological methods (intestinal and urogenital schistosomiasis) or <30% by questionnaire for history of haematuria or >=15% but <60% by CCA in S. mansoni endemic areas, all school-aged children (enrolled and not enrolled) should be treated once every 2 years, at least 50% of this age group should be treated each year). Adults considered to be at risk should be treated, and additional interventions such as provision of wholesome water, sanitation and hygiene education (WASH) and snail control should be combined with MDA. If prevalence is <10% by parasitological methods (intestinal and urogenital schistosomiasis) or <15% by CCA in S. mansoni endemic areas, all school-aged children (enrolled and not enrolled) should be treated twice during their primary school age, at least 33% of this age group each year. Water, sanitation and hygiene education (WASH) and snail control should complement control effort.
Until now the WHO guidelines for guiding the threshold at which MDA would be required have been based on anecdotal evidence and consensus rather than systematically synthesized evidence. This review was commissioned by the WHO to determine a global prevalence threshold that should be used to implement MDA with maximum benefit in high, moderate and low schistosomiasis endemicity settings.
REVIEW METHODS
Criteria for considering studies for this review Types of studies
Published and unpublished studies, comparative and non-comparative, involving MDA of PZQ alone or in combination with other medicines employed in the PC strategy or commonly used in PC settings, that evaluated benefits for any of the schistosomiasis species (S. mansoni, S. japonicum, S. intercalatum, S. mekongi or S. haematobium), were eligible for inclusion. Selective treatment studies, non-human studies and reviews were excluded.
Participants
Whole population or subgroups (preschool-aged children, school-aged children, adolescents and adults including pregnant and lactating women) infected with any human schistosome species or non-infected persons living in endemic areas who received PZQ (any brand) at a single dosing schedule (40, 50, 60, 70, or 80 mg/kg) during MDA were eligible for inclusion.
Intervention
Praziquantel at a single oral dose of 40, 50, 60, 70 and ≥80 mg/kg or in combination with Albendazole, Mebendazole, Pyrantel pamoate or Levamisole (for soil-transmitted helminthiasis), or Albendazole plus either Ivermectin or Diethylcarbamazine [DEC] (for Lymphatic filariasis), Artemisinin-based combination therapies (ACTs) for malaria, or Azithromycin (Zithromax) for trachoma.
Control
Praziquantel at 40 mg/kg or no treatment.
Outcomes
Primary
Prevalence of infection or percent reduction at 1, 3, 6, 12 or 24 months.
Intensity of infection or percent reduction of egg count at 1, 3, 6, 12 and 24 months. Intensity of infection was classified as light (100 epgs), moderate (100–399 epgs) and heavy ( 399 epgs) for Kato–Katz, respectively and light (< 50) heavy (
50) eggs per 10-ml of urine.
Secondary
Transmission of infection or percent reduction in transmission at 1, 3, 6, 12 or 24 months.
Compliance, acceptability, preferences, equity and feasibility of intervention by the population.
Adverse events
Serious adverse event (defined as any event that required hospitalization or prolongation of existing inpatients hospitalization, life threatening, presented with significant disability/ incapacity or led to congenital anomalies or birth defects).
Non-serious event (defined as mild to moderate and/or transient events)
Search strategy for identification of studies
We identified relevant studies regardless publication status (published, unpublished, in press, and ongoing). We searched Pubmed and LILACS from 1979 to 31st March 2021 without language restriction. We searched the Cochrane Infectious Diseases Group Specialized Register, CENTRAL (The Cochrane Library 2021), mRCT, Hinari, Africa Journals Online and Google Scholar. Experts in the field of schistosomiasis were contacted for additional or unpublished data and the reference lists of articles reviewed. The following search terms were used: schistosomiasis) OR schistosoma) OR schistosome) OR “schistosoma mansoni”) OR “schistosoma haematobium”) OR “schistosoma hematobium”) OR “schsitososoma japonicum”) OR “schistosoma mekongi”) OR “schistosoma intercalatum”) AND praziquantel) OR biltricide) OR distocide) OR pharmamed) OR Bilharzid) OR Prazitel) AND “preventive chemotherapy”) OR “mass treatment”) OR “mass drug administration”) OR MDA) OR “blanket treatment”) AND “endemic setting”) OR “endemic community”) OR “endemic country”).
Study selection
One reviewer screened the results of the search output to identify studies meeting the pre-specified inclusion criteria using a pre-tested study selection form. Full study reports of potentially relevant studies were obtained and checked against the predefined inclusion criteria, which were verified independently by the lead reviewer. Any discrepancies were resolved through discussion between the reviewers.
Data extraction and management
Two reviewers extracted data using pre-tested data extraction form. Data extracted included study characteristics such as the country and year in which the study was conducted, the study design type as well as epidemiological and demographic characteristics – e.g. baseline endemicity, target population or subgroup that received MDA, age and number of participants involved in the MDA. We also extracted post MDA outcome data such as prevalence, egg count reduction, compliance and acceptability, equity and feasibility of treatment. We contacted some authors to see if they could clarify or supplement the results or provide raw data that we could use. If two or more communities were involved in a study, data were extracted for each community – with a link to the parent study. However, where it is not possible to separate the data by country or community, the combined data was used and presented as one study and the countries or communities in which the study was conducted were shown. Any discrepancies were resolved through discussion between the reviewers.
Assessment of risk of bias in the included studies
One reviewer assessed the risk of bias in each of the included trials using risk of bias tool for Randomized Controlled Trials (RCTs) (Higgins et al. 2011) and verified independently by another reviewer. Where information in the trial report was unclear, we contacted the trial authors for clarification. We assessed the risk of bias for six domains: sequence generation, allocation concealment, blinding (investigators, outcome assessors and participants), incomplete outcome data, selective outcome reporting and other sources of bias. For each domain, we made a judgment of ‘low risk’ of bias, ‘high risk’ of bias or ‘unclear’ risk of bias. ROBINS-I (Risk Of Bias In Non-randomised Studies- of Interventions), was used to evaluate risk of bias in estimates of benefit of interventions from studies that did not use randomization to allocate individuals or clusters of individuals to comparison groups (Sterne et al. 2016). Seven domains through which bias might be introduced into non-randomized studies of intervention (NRSI) were considered. The first two domains, covering confounding and selection of participants into the study, addressed issues before the start of the interventions. The third domain addressed classification of the interventions themselves. The other four domains addressed issues after the start of interventions: biases due to deviations from intended interventions, missing data, measurement of outcomes, and selection of the reported result. The STROBE checklist was used to examine the reporting of observational comparative studies (Von Elm et al. 2007) and PRISMA for systematic review and meta-analysis (Moher et al. 2009). Risk of bias and quality results have been presented in tables. The Risk of Bias Tool for Prevalence Studies (Hoy et al. 2012) was used to assess the methodological quality and risk of bias for each prevalence study.
Data synthesis
Prevalence and absolute rate s of events were calculated from all studies and relative risks from comparative trials. Data were analysed and presented as prevalence ratios with their 95% CIs. The R software was used for the analyses. Random effects model was carried out with the meta command for pooling data on treatment effect between baseline and first observation after MDA. Generalized linear mixed models were used for the meta-analysis and meta-regression of observations on prevalence rates of schistosomiasis during preventive chemotherapy treatment. To this purpose the lme4 package was used. Data were extracted to get the maximum level of details. In case of available information each data row was an area within a study with a specific treatment for age group. The model contains random intercepts (the study units clustered within studies) and a random slope in time. This means that the rate at which schistosomiasis decline during treatment is different from study-unit to study-unit. If a study-unit has a negative random effect, then they decrease more quickly than the average. Whenever appropriate, we optimized the random effects and the fixed-effects coefficients in the iteratively reweighted least squares step by optimizing the parameter estimation. Wald 95 % confidence intervals (95% CI) were derived. A p-value less than 0.05 was considered as significant in all the analyses.
Heterogeneity assessment
We inspected forest plots for overlapping confidence intervals and outlying data, and where heterogeneity was suspected, we conducted quantitative assessment from the Cochran’s Q test and I2 statistic setting the Chi2 test at a more sensitive threshold (P value < 0.1) to indicate statistically significant heterogeneity (DerSimonian and Laird 1986; Bossuyt et al. 2013). The I2 statistic, defined as the proportion of variation across studies that is due to heterogeneity rather than chance was particularly emphasised, with proportions 0% to 40% reported as less important heterogeneity, 30% to 60% (moderate heterogeneity), 50% to 90% (substantial heterogeneity) and 75% to 100% (considerable heterogeneity). Where significant heterogeneity was detected, we carried out subgroup analyses based on clinical and methodological differences.
Sensitivity analysis
Where data are sufficient, we conducted sensitivity analyses to assess the robustness of the results to the risk of bias components. We used quality dimensions assessed from GRADE and risk of bias assessment to conduct sensitivity analyses by excluding studies considered to be of low quality to explore the robustness of our findings to these factors.
Summary of findings and Grading the evidence
We used GRADE (Alonso-Coello et al 2016) to grade the evidence by looking at 5 main factors that might decrease quality of evidence, 1) study limitations, 2) inconsistency of results, 3) indirectness of evidence, 4) imprecision, and 5) publication bias. We also looked at factors that might increase quality of evidence including, 1) large magnitude of effect, 2) plausible confounding, which would reduce a demonstrated effect, and 3) dose-response gradient (http://www.gradeworkinggroup.org/).
Evidence-to-recommendation
This systematic review and meta-analysis was commissioned by WHO in support of its guideline development for guiding schistosomiasis control in endemic settings. As result, we did evidence-to-recommendation assessment on the following domains: benefits and harms─this required an evaluation of the absolute effects of both benefits and harms (or downsides) of the intervention and their importance where greater net benefit or net harm associated with an intervention or exposure, the greater the likelihood of a strong recommendation in favour or against the intervention; values and preferences described the relative importance assigned to health outcomes by those affected by them; how such im─portance varies within and across populations; and whether this importance or variability is surrounded by uncertainty. The less uncertainty or variability there is about the values and preferences of people experiencing the critical or important outcomes, the greater the likelihood of a strong recommendation; acceptability the greater the acceptability of an option to all or most stakeholders, the greater the likelihood of a strong recommendation; resource use pertaining to how resource-intense an intervention was, whether it was cost–effective and whether it offered any incremental benefit with the more advantageous or clearly disadvantageous the resource implications were, the greater the likelihood of a strong recommendation either for or against the intervention; equity and human right the greater the likelihood that the intervention reduced inequities, improved equity or contributed to the realization of one or several human rights as defined under the international legal framework, the greater the likelihood of a strong recommendation; and feasibility the greater the feasibility of an option from the standpoint of all or most of stakeholders, the greater the likelihood of a strong recommendation considering an overlap of feasibility with values and preferences, resource considerations, existing infrastructures, equity, cultural norms, legal frameworks and many other considerations.
RESULTS
Description of studies
The search retrieved 1,232 studies of which 1186 studies were obtained from electronic databases and 46 studies from other sources including grey literature and contacts with experts. After screening the search returns 1,204 studies were excluded. Fifty-one studies were excluded because of duplication, 1094 studies were not relevant to the topic, 49 studies were excluded because they were either non-MDA, reviews or did not provide treatment. 38 studies met our inclusion criteria but four were excluded from the analysis because they had only baseline data. Of the 34 studies included in the analysis, 15 S. mansoni and S. haematobium. No study investigated the other schistosome species (Fig. 1). All the MDA campaigns were done in Africa between 1988 and 2020 (Table 1).

Flowchart of studies retrieved from relevant electronic databases and other sources (including contacts with expert in the field), number meeting the inclusion criteria and number included in the analysis by schistosome species.
Characteristics of the studies included in the meta-regression of schistosomiasis MDA
Study settings and participants
Of the 34 studies included in the analysis (Table 1), 15 were conducted in West Africa (Sierra Leone = 3, Burkina-Faso = 2, Cote d’Ivoire =2, Mali = 2, Niger = 2, Senegal = 2, Liberia = 1 and Togo = 1), fourteen studies were conducted in East Africa (Kenya = 8, Tanzania = 3, Uganda = 2 and Ethiopia = 1), 6 studies were conducted in Central and Southern Africa (Burundi = 1, Malawi = 1, Mozambique = 1, Namibia = 1, Rwanda = 1, Zimbabwe = 1) and two studies from North Africa, all conducted in Sudan. Shen et al. (2019) conducted a two-country study in Kenya and Tanzania and reported combined data. Twenty-six studies assessed PZQ alone and eight assessed PZQ combined with Albendazole. Twenty-eight studies involved school age children (SAC) and six involved SAC and adults. No MDA has been delivered to adults only. For the detection of the infection, 15 studies that involved people infected with S. mansoni used Kato-Katz (KK), 6 that involved S. haematobium used urine filtration (UF), and 13 studies that involved mixed infection with S. mansoni and S. haematobium employed KK and UF. Only one MDA of S. mansoni infection from Uganda used KK and Circulating Cathodic Antigen (CCA) test. Follow-up time after MDA ranged from 6 months to 9 years (Table 1). Mode of delivery of MDA differed between studies: majority of studies delivered annual PZQ MDA least two years, some delivered MDA twice a year (bi-annual) and for some studies, MDA was delivered every two years (biennial). Some studies delivered annual MDA for two years and assessed effect of the treatment after 5 years so that three years elapsed after the last MDA before the outcome of treatment was assessed and some studies alternated MDA with drug holidays.
The majority of data came from SCI or SCORE – supported MDA surveys. SCI provided huge unpublished data and we made sure to avoid duplication of data that has been published from the same data. We did the same with the SCORE data.
Prevalence versus intensity of infection
We estimated the relationship between prevalence and intensity of infection in both S. mansoni and S. haematobium across different endemicities that showed an inverse quadratic relationship with S. mansoni showing slightly steeper curve than S. haematobium (Fig. 2). The graphs appear not (fully) in support of the established assumption that prevalence is directly proportional to intensity as a lot of endemic settings with high prevalence do not necessarily have proportionately high intensity (Fig. 2 A and B).

Relationship between prevalence (as proportion) and infection intensity of infection expressed as EPG (eggs per gram of faeces) for S. mansoni (A) or eggs per 10mL of urine for S. haematobium (B). The data points (black circles) came from 28 large studies involving hundreds of villages and millions of inhabitants for S. mansoni and 22 studies of hundreds of villages and thousands of inhabitants treated for S. haematobium. Given that egg output does not follow a normal distribution, EPG and eggs/10mL values (x-axis) have been reported on a log scale. A quadratic polynomial regression was fitted to depict the relationship between prevalence and intensity of infection, with their 95% CIs (grey area). The size of the circles is proportional to the size of the population.
Meta-analysis of the effect of MDA over time
We illustrate first the meta-analysis of treatment effect in school age children (SAC) between after baseline and successive follow-up times for S. haematobium infection at 12, 24, 36 and 48 months after annual school-based MDAs (Fig. 3). Eight studies (Phillips et al. 2016; SCI Burkina-Faso; SCI Ethiopia; SCI Liberia; SCI Malawi; SCI Mali; SCI Niger and SCI Tanzania) investigated SAC annual MDA and the results showed statistically significant reduction in the prevalence of infection at 12 months (RR 0.38, 95% CI 0.28 to 0.52; 8 studies, 37,868 school children, I2=99%); at 24 months (RR 0.30; 95% CI 0.30 to 0.52; 7 studies; 37107 school children, I2=98%); at 36 months (RR 0.39, 95% CI 0.21 to 0.71; 5 studies, 28,146 school children, I2=99%) and at 48 months although this is not statistically significant compared with baseline (RR 0.38, 95% CI 0.14 to 1.07; 2 studies; 10,954 school children, I2=98%).

Forest plot of effectiveness of a single oral dose of 40 mg/kg in SAC for S. haematobium. The vertical line at 1 denotes the point of no difference between follow up prevalence and that of baseline so that if the 95% CI includes the value 1, it means there is no statistically significant difference between prevalence at follow up and prevalence at baseline. Each study has a square denoting the ‘effect estimate’ for that particular study with a horizontal line in the middle of the square that denotes the 95% CI. Each effect size with its CI is presented under ‘Risk Ratio’. The size of the square denotes the contribution of the study in the pooled analysis which is quantified by the weight. The narrower the horizontal line (CI) the large the study and the higher our confidence in the estimate. The diamond denotes the pooled (overall) effect estimate.
We assessed the effect of annual MDA in school children (SAC) in a meta-analysis that compared prevalence at baseline with prevalence of S. mansoni at follow-up times 12, 24, 36 and 48 months (Fig. 4).
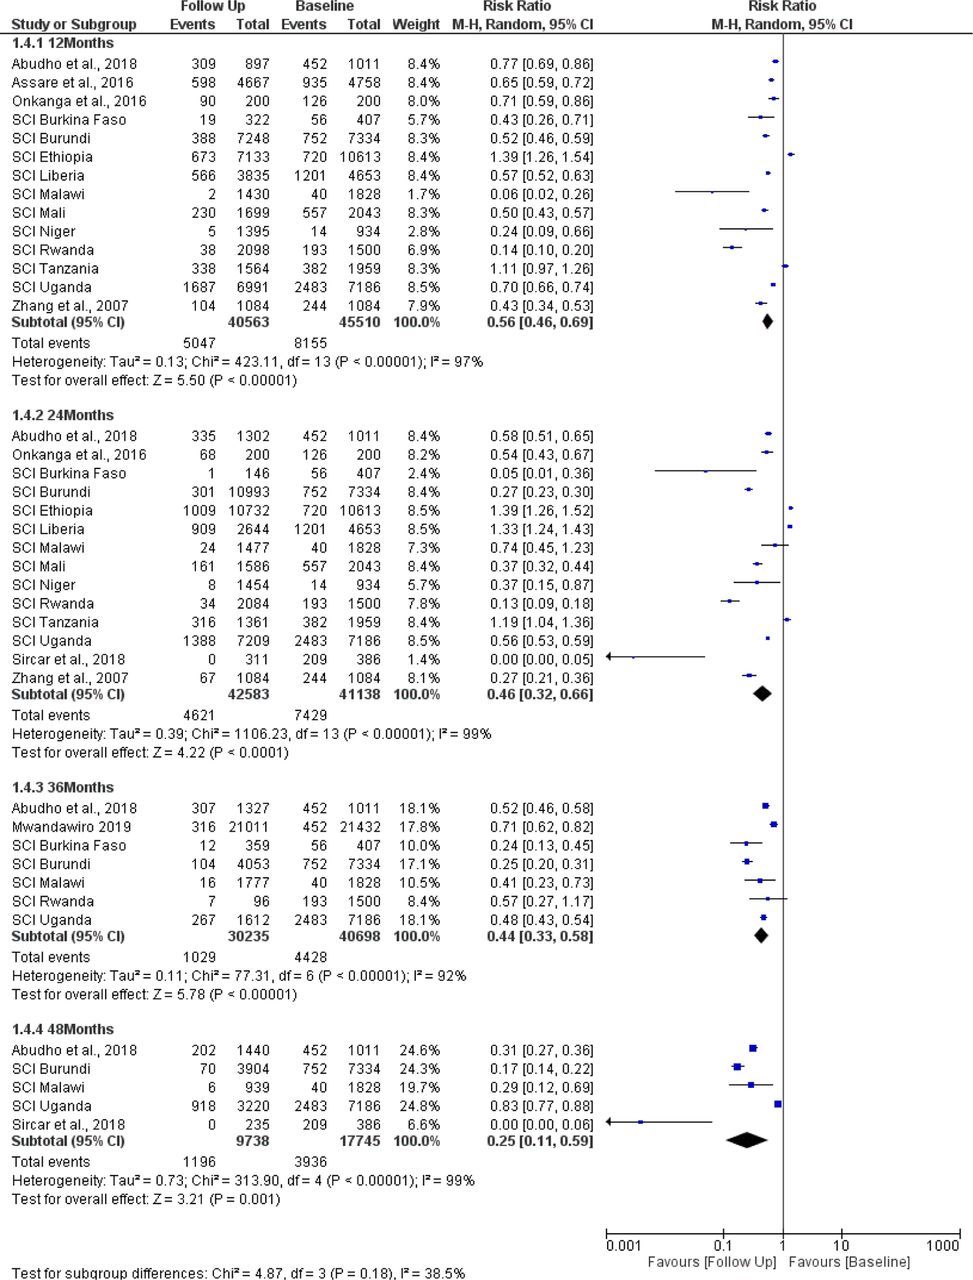
Forest plot of effectiveness of single oral dose of 40 mg/kg in SAC for S. mansoni (see Fig. 3 for further explanation of the Fig.).
Fourteen studies (Abudho et al. 2016; Assare et al. 2016; Onkanga et al. 2016; SCI Burkina Faso; SCI Burundi; SCI Ethiopia; SCI Liberia; SCI Malawi; SCI Mali; SCI Niger; SCI Rwanda; SCI Tanzania; SCI Uganda and Zhang et al. 2007) investigated SAC annual MDA through school-based strategy and the results show a reduction in prevalence with single dose PZQ at 12 months (RR 0.56, 95% CI 0.46 to 0.69; 14 studies, 86,073 school children, I2=97%); at 24 months (RR 0.46; 95% CI 0.32 to 0.66; 14 studies; 83,721 school children, I2=99%); at 36 months (RR 0.44, 95% CI 0.33 to 0.58; 7 studies, 70933 school children, I2=92%) and at 48 months (RR 0.25, 95% CI 0.11 to 0.59; 5 studies; 27,483 school children, I2=19%).
Meta-analysis of treatment effect of MDA in adults with S. mansoni who received PZQ during School-based treatment by comparing prevalence at baseline and successive follow-up times at 12, 24, 36 and 48 months (Fig. 5).

Forest plot of effectiveness of single oral dose of 40 mg/kg in adults with S. mansoni through school-based treatment MDA (see Fig. 3 for further explanation of the figure).
Four studies (SCI Burundi; SCI Rwanda; SCI Tanzania and SCI Uganda) investigated SAC annual MDA (Fig. 5). The results demonstrate a similar pattern as S. haematobium with MDA showing significant reductions in prevalence at 12 months (RR 0.55, 95% CI 0.38 to 0.46; 4 studies, 3,829 school children, I2=88%); at 24 months (RR 0.25; 95% CI 0.14 to 0.46; 4 studies; 3907 school children, I2=89%); at 36 months (RR 0.31, 95% CI 0.10 to 0.93; 3 studies, 1598 school children, I2=74%) and at 48 months (RR 0.37, 95% CI 0.19 to 0.70; 2 studies; 1,813 school children, I2=19%).
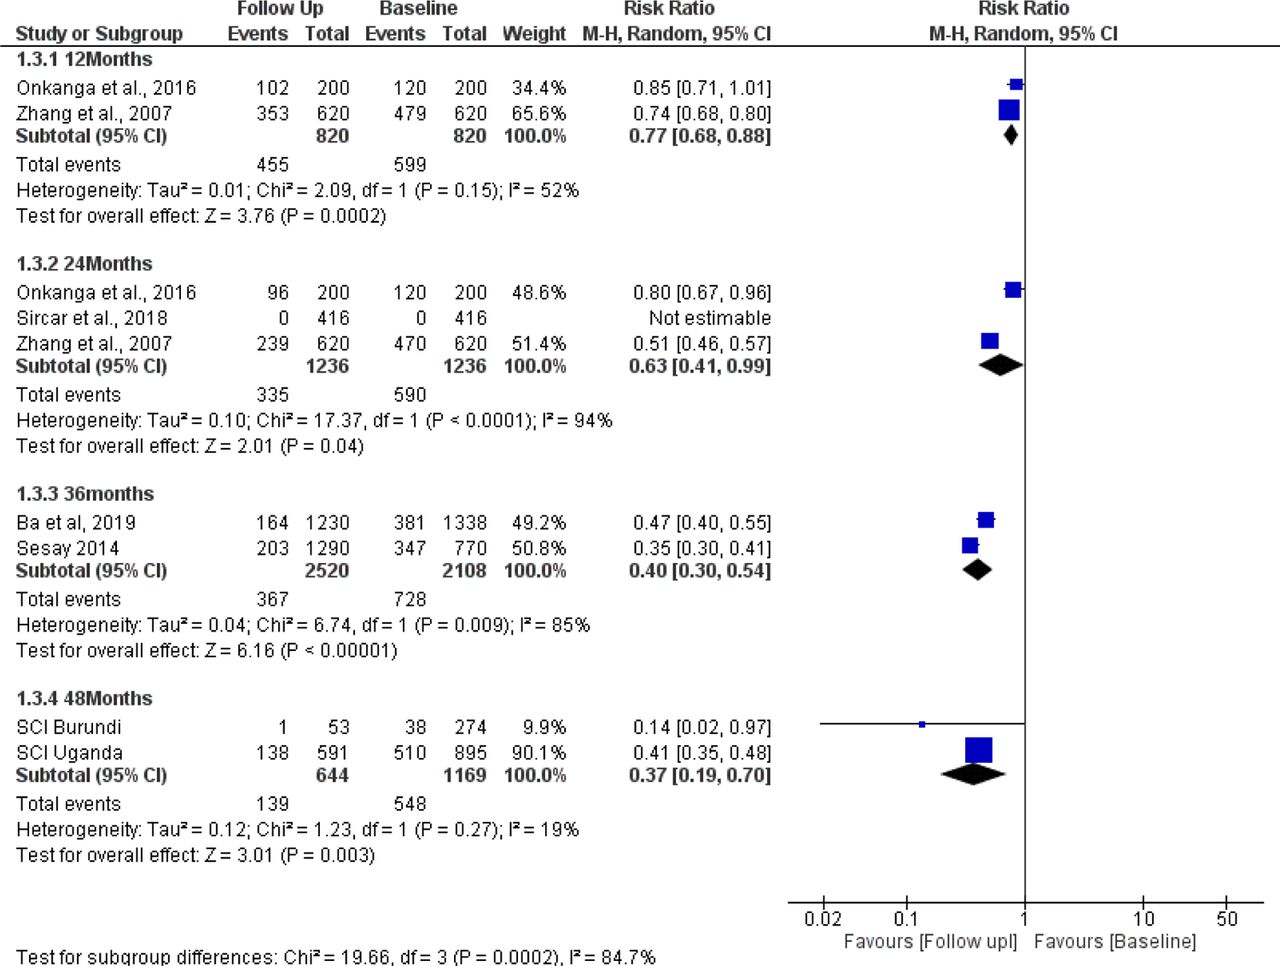
Forest plot of effect of single oral 40 mg/kg dose in adults with S. mansoni treated through cwt MDA campaign (see Fig. 3 for further explanation of the figure).
The meta-analysis of the effect of MDA in adults that compared baseline and follow-up prevalence of infection after 12, 24, 36 and 48 months of annual Community-Wide Treatment (cwt) has been presented (Fig. 3). Two studies investigated adult cwt MDA and the results showed reduction in the prevalence of infection at 12 months (RR 0.77, 95% CI 0.68 to 0.88; 2 studies, 1,640 school children, moderate heterogeneity I2=52%); at 24 months (RR 0.63; 95% CI 0.41 to 0.99; 3 studies; 2,472 school children, very high heterogeneity I2=94%); at 36 months (RR 0.40, 95% CI 0.30 to 0.54; 2 studies, 4,628 school children, I2=85%)) and at 48 months (RR 0.37, 95% CI 0.19 to 0.70; 2 studies; 1,813 school children, low heterogeneity I2=19%)).
Longitudinal meta-analysis
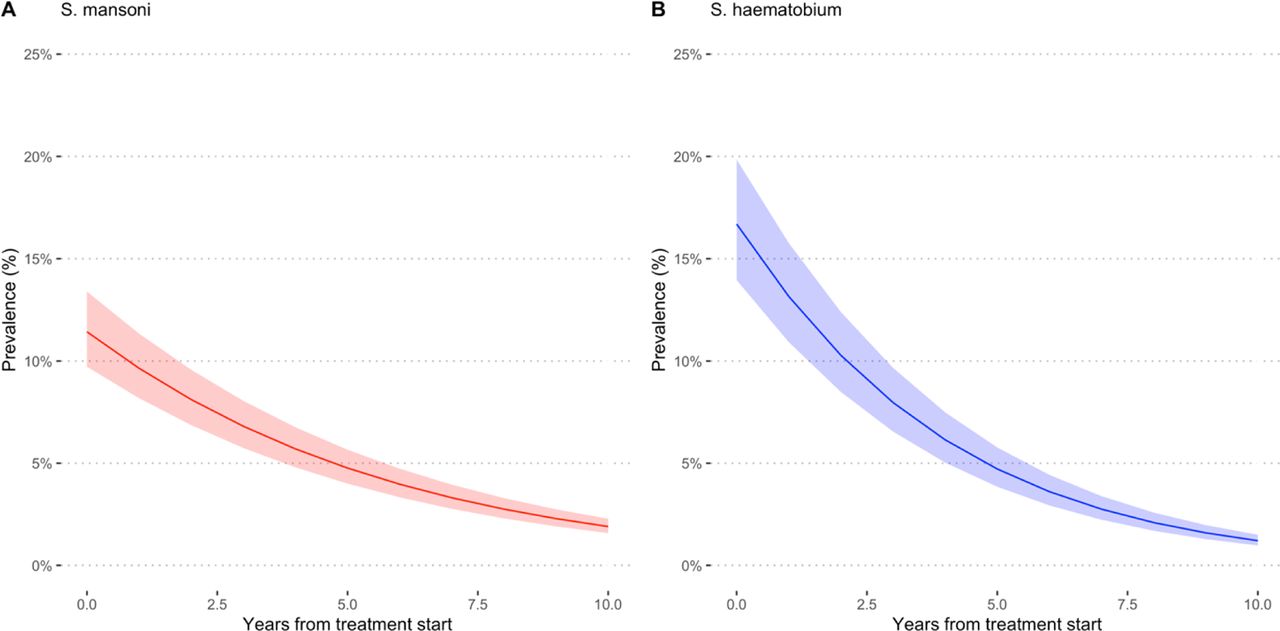
Praziquantel showed to be effective in reducing the prevalence of S. mansoni (PR=0.83, 95% CI = 0.82 to 0.83) and S. haematobium (PR=0.76, 95%CI = 0.75 to 0.76), translating into a 17% annual reduction for S. mansoni and 24% annual reduction for S. haematobium in PC/MDA programmes (as reported in Table 2 and Fig. 6). There is a sharp drop in prevalence rate after MDA but the decrease becomes less prominent and the curves appear to be leveling off over time. This may have important implications for control as it suggests that prevalence can drop after MDA but at some point it becomes difficult to reduce prevalence further by repeated MDA.

Estimated prevalence at baseline and at different follow-up times during annual MDA for S. mansoni (A) and S. haematobium (B). All the studies used PZQ 40 mg/kg administered as a single oral dose alone or in combination with Albendazole (400 mg) in MDA campaigns in endemic countries in Sub-Saharan Africa.
Meta-regression results in terms of Prevalence Ratios (95% CI) per year of treatment*
Meta-regression results in terms of Prevalence Ratios (PR, 95% CI) per year of treatment and baseline prevalence or type of treatment for S. mansoni
Meta-regression results in terms of Prevalence Ratios (PR, 95% CI) per year of treatment and baseline intensity of infection or type of treatment for S. haematobium
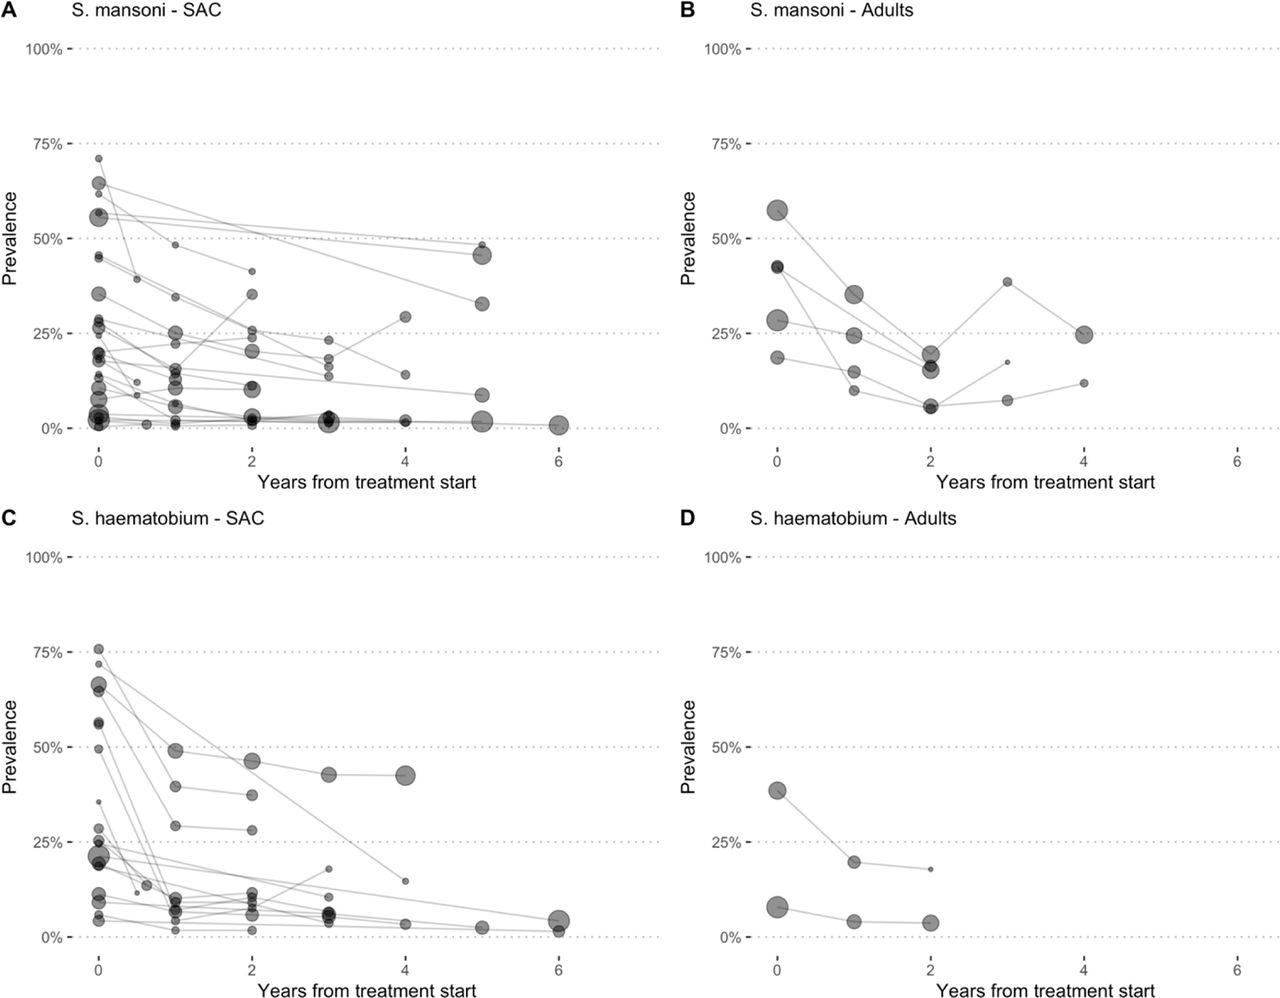
We conducted further analysis on prevalence rates at baseline and after annual MDA for SAC and adults for S. mansoni and S. haematobium (Fig. 7 A, B, C, D). for both SAC and adults prevalence rates decrease, more prominently in SAC (A and C) but not so much for adults with S. mansoni or S. haematobium (Fig. B and D). Fig. 7B shows that after a decrease of up to 2 years, prevalence starts to increase. The same is observed for MDA for adults with S. haematobium where the drop in prevalence levels off after about two years and bounces back (Fig. 7D).

Prevalence Rates over time points following MDA of adults are plotted for studies that investigated S. mansoni in SAC (A), S. mansoni in adults (B), S. haematobium SAC (C) and S. haematobium adults (D). The size of the circles is proportional to the tested population at each follow-up assessment. Follow up was up to six years.

Estimated prevalence at baseline and at different follow-up times during MDA for S. mansoni (A-B) and S. haematobium (C-D). High prevalence (pink colour) is defined as prevalence ≥50% by microscopy and ≥60% by CCA, moderate (blue colour) is prevalence =10% but <50% by microscopy and ≥15% but <60% by CCA and low prevalence (green colour) is prevalence <10% by and <15% by CCA. All the studies used PZQ 40 mg/kg administered as a single oral dose alone or in combination with Albendazole (400 mg) in MDA campaigns in endemic countries in Sub-Saharan Africa.
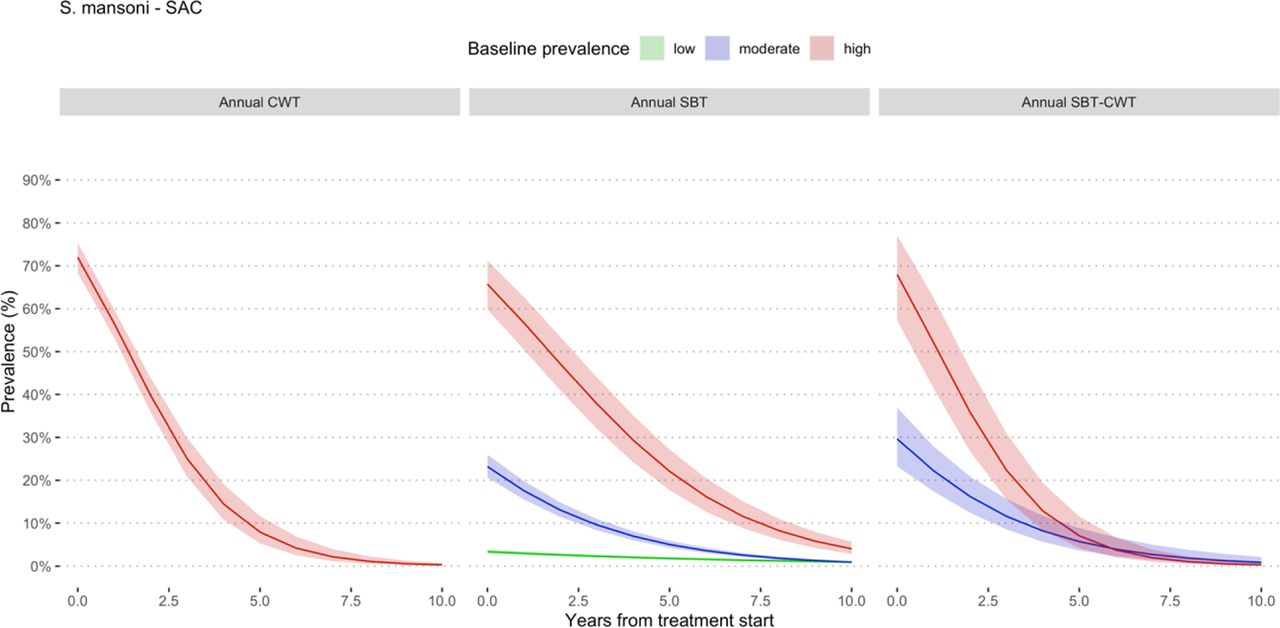
Estimated prevalence at baseline and at different follow-up times during MDA involving school age children for S. mansoni. Prevalence categories have been defined using WHO classification (WHO 2012). High prevalence is defined as prevalence ≥50% by microscopy and ≥60% by CCA, moderate is prevalence =10% but <50% by microscopy and 15% but <60% by CCA and low prevalence is prevalence <10% by and <15% by CCA. All the studies used PZQ 40 mg/kg administered as a single oral dose alone or in combination with Albendazole (400 mg) in MDA campaigns in endemic countries in Sub-Saharan Africa. SBT means school-based treatment and CWT community wide treatment.

Estimated prevalence at baseline and at different follow-up times during MDA involving Adults for S. mansoni. Prevalence categories have been defined using WHO classification (WHO 2012). High prevalence is defined as prevalence ≥50% by microscopy and ≥60% by CCA, moderate is prevalence =10% but <50% by microscopy and 15% but <60% by CCA and low prevalence is prevalence <10% by and <15% by CCA. All the studies used PZQ 40 mg/kg administered as a single oral dose alone or in combination with Albendazole (400 mg) in MDA campaigns in endemic countries in Sub-Saharan Africa. SBT means school-based treatment.
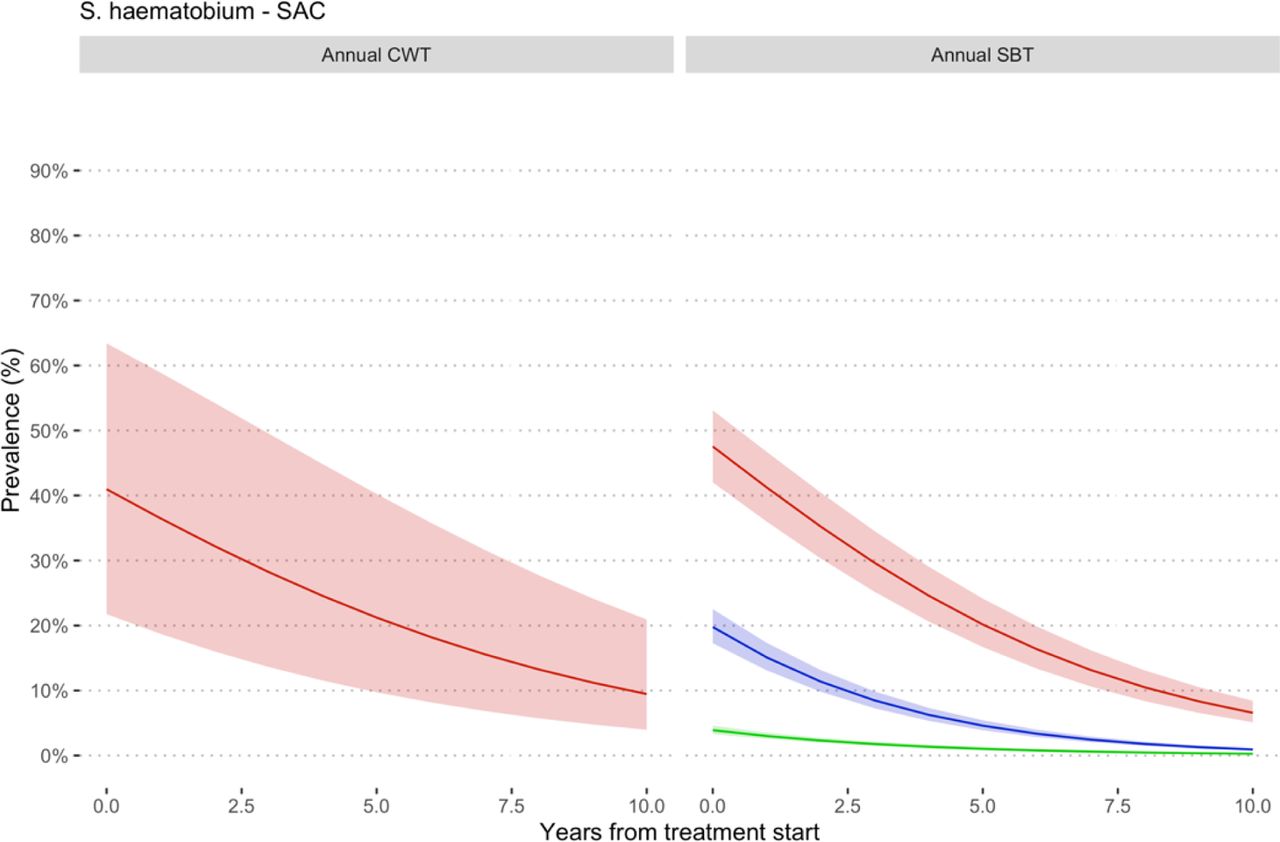
Estimated prevalence at baseline and at different follow-up times during MDA involving school age children for S. haematobium. Prevalence categories have been defined using WHO classification (WHO 2012). High prevalence is defined as prevalence ≥50% by microscopy and ≥60% by CCA, moderate is prevalence =10% but <50% by microscopy and ≤15% but <60% by CCA and low prevalence is prevalence <10% by and <15% by CCA. All the studies used PZQ 40 mg/kg administered as a single oral dose alone or in combination with Albendazole (400 mg) in MDA campaigns in endemic countries in Sub-Saharan Africa. SBT means school-based treatment and CWT community wide treatment.

Estimated prevalence at baseline and at different follow-up times during MDA involving Adults for S. haematobium. Prevalence categories have been defined using WHO classification (WHO 2012). High prevalence is defined as prevalence ≥50% by microscopy and ≥60% by CCA, moderate is prevalence =10% but <50% by microscopy and ≤15% but <60% by CCA and low prevalence is prevalence <10% by and <15% by CCA. All the studies used PZQ 40 mg/kg administered as a single oral dose alone or in combination with Albendazole (400 mg) in MDA campaigns in endemic countries in Sub-Saharan Africa. SBT means school-based treatment.

Estimated prevalence at baseline and at different follow-up times during MDA involving school age children for S. mansoni. All the studies used PZQ 40 mg/kg administered as a single oral dose alone or in combination with Albendazole (400 mg) in MDA campaigns in endemic countries in Sub-Saharan Africa.

Estimated prevalence at baseline and at different follow-up times during MDA involving adults for S. mansoni. All the studies used PZQ 40 mg/kg administered as a single oral dose alone or in combination with Albendazole (400 mg) in MDA campaigns in endemic countries in Sub-Saharan Africa.

Estimated prevalence at baseline and at different follow-up times during MDA involving school age children for S. haematobium. All the studies used PZQ 40 mg/kg administered as a single oral dose alone or in combination with Albendazole (400 mg) in MDA campaigns in endemic countries in Sub-Saharan Africa.

Estimated prevalence at baseline and at different follow-up times during MDA involving Adults for S. haematobium. All the studies used PZQ 40 mg/kg administered as a single oral dose alone or in combination with Albendazole (400 mg) in MDA campaigns in endemic countries in Sub-Saharan Africa.

Expected prevalence rates reduction in SAC MDAs for S. mansoni according to longitudinal analyses. Different lines represent different thresholds. SBT stands for School Based Treatment and CWT for Community Wide Treatment.

Expected prevalence rates in SAC MDAs for S. haematobium according to longitudinal analyses. Different lines represent different thresholds. SBT stands for School Based Treatment and CWT for Community Wide Treatment.
Longitudinal data
Prevalence reduction following MDA
Different communities within a study and repeated follow-ups were each considered as separate data points. The interdependence between observations (communities and repeated follow-ups) within the same study was accounted for by using linear mixed modeling (LMM). In the GLMM study and /or study arms were considered as random intercepts and random slopes (Danso-Appiah and De Vlas 2002). Marginal estimates are then plotted along their 95% CI. The lme4 R package was used to estimate the impact, variance and covariance of random and fixed effects. Significances of the coefficients were assessed by the Wald-test.
Risk of Bias Assessment
The risk of bias in the included studies has been represented graphically (Fig. 13). Thirty-four studies were assessed to be of low Risk of Bias due to confounding and selection of participants into the study, bias in classification of interventions bias due to deviations from intended interventions and bias in selection of reported results. For Bias in measurement of outcomes, all the studies were considered to have moderate bias whilst only three studies had information on missing data and scoring moderate; the rest did not report on missing data. None of the studies had high risk of bias, all were assessed to have moderate risk (Table 7).

Graphical representation of Risk of bias in the included studies in the systematic review
Results of risk of bias assessment of the studies included in the systematic review
Of the 34 studies included in the meta-analysis, all of them had low risk of bias due to confounding, low risk of bias due in selection of participants, low risk of bias in the classification of intervention, low risk of bias due to due to deviations from intended interventions and low risk of bias in selective reporting of outcomes. All the 34 studies showed moderate risk of bias in measurement of outcomes. None of the studies had serious or critical risk of bias in them (Table 7).
SUMMARY OF FINDINGS
PICOS
LEVEL OF EVIDENCE (GRADE)
Discussion
This systematic review and meta-analysis showed the relationship between prevalence and intensity of infection is not linear, instead quadratic polynomial relationship. Obviously, this has implications for policy and control. The pooled data come from thousands of communities that representing the diversity of demography, settings and schistosome dynamics and, therefore, informative. Also, given that assumed linear relationship held by many may not be accurate means that caution should be exercised when justifying the use of prevalence as a proxy for determining the threshold upon which to justify an MDA. We suggest more rigorous work that attempts to conduct head-to-head comparison of prevalence and intensity is warranted to ascertain which of the two measures is more stable and responsive across settings and contexts to measure effect of MDA.
The results also showed that when given as annual MDA, prevalence of S. mansoni and S. haematobium in school age children decreases, but no apparent difference between baseline and 48 months. Similarly, annual MDA for S. mansoni achieved a reduction for SAC and adults but no apparent further reduction after 12 months by repeated MDA. Community-wide treatment sowed similar results. Annual mass drug administration for up to 9 years did not achieve prevalence reduction to the elimination target for S. mansoni in settings with baseline prevalence 10%. For S. haematobium, although annual mass drug administration up to 5 years reduced prevalence to lower levels than S. mansoni, elimination target was not reached in setting with baseline prevalence 10% by 10 years of mass drug administration. From extrapolated findings, up to 15 years of annual whole community mass drug administration will be required to achieve elimination when baseline prevalence is 10%. Further analyses using a series of prevalence thresholds showed no apparent difference in the time to elimination between 5% and 10%, 15%, 20%, 30% and 40%, but higher than 10% thresholds took longer to achieve elimination. as a lot of endemic settings with high prevalence, as pooled in this analysis, do not necessarily appear to support that. This means that to have an appropriate threshold to justify MDA, we need to reassess both prevalence and intensity and find which one is more stable to use as threshold for population MDA.
Heterogeneity between the studies pooled was high (I2 >97%) but given the huge number of studies and individuals treated, this is not likely to influence the study conclusions. This could be a possible explanation of ‘real’ differences between MDA programmes which is what the I2 is measuring. In terms of strategy, some MDA programmes treated only SAC (sbt), SAC and occupationally at-risk adults (SAC and adults) or community wide treatment (cwt). In some settings, other control measures that took place during the same period of the MDA, villages differed in baseline intensity of infection and thereby force of transmission, variation in sensitivities in diagnostic criteria existed between MDA programmes as well as differences in follow-up times after MDA. As data on some of these factors were not documented or in formats that could be used, these variations could not be quantitatively addressed in the meta-analysis or sub-group analysis.
Heterogeneity between the studies pooled in this meta-analysis was high (I2 > 95% in most of the analysis) but given the huge number of studies and individuals treated, between studies heterogeneity is not expected to change the direction of treatment effect or the overall conclusions from this review. The high levels of heterogeneity could be explained by the following: 1) there are ‘real’ differences between MDA programmes so the I2 values are a true reflection, 2) MDA programmes differed in strategy (some treated only SAC, SAC and occupationally at risk adults (SAC and adults) or community wide treatment, 3) other control measures took place during the period of the MDA in some cases but not accounted for in reporting the results of MDAs, 4) villages differed in baseline intensity of infection and thereby force of transmission, 5) variation in sensitivities in diagnostic criteria existed between MDA programmes, and 6) differences existed in follow-up times of MDAs.
Data on some of these factors were not documented or presented in formats that could be used in this systematic review and meta-analysis and therefore some of these variations could not be quantitatively addressed in the meta-analysis or in sub-group analyses.
Conclusions and recommendations
The evidence presented in this review (given ethical implications) suggests that 10% prevalence can be used as the ‘global’ prevalence threshold for MDA in endemic countries.
Most of data are from SAC population, no data on pre-school children and few on adults makes is difficult to make concrete statement about generazability of the review findings
From this review, PZQ appears to be effective in reducing the prevalence of schistosomiasis at 12 months, but incremental benefit of repeated annual treatment appears to be minimal in further reducing prevalence over time
In both light prevalence and intensity, infection rates do not decrease but rather tended to increase with biennial MDA
Effectiveness depends of several factors, which are difficult to disentangle, however the rate of prevalence decrease seems not influenced by the baseline intensity of infection and type of treatment
Further analyses were conducted from a series of created prevalence thresholds of 5%, 10%, 15%, 20%, 30% and 40% and although showed differences in effect of MDA, the differences in effect based on threshold regressed over time (after about 8 years). For annual MDA of SAC, SBT appears to perform better than CWT in terms of prevalence reduction. For schistosome species, the model suggests, using the same prevalence threshold, it will take shorter time to reach elimination for S. haematobium than S. mansoni; annual MDA for S. haematobium (SBT) will require about 10 years to achieve elimination whereas it will take longer for S. mansoni (over 10 years to around 15 years to achieve elimination).
The question that remains is what happens to endemic communities/settings with less than 10% prevalence?
Integration of non-pharmacological interventions such access to water, improved sanitation, hygiene education (WASH) and snail control will complement MDA to achieve elimination of schistosomiasis
Data Availability
This review was commissioned by the World Health Organization (WHO) and data will be made available to the public.
APPENDIX 1
Evidence-to-recommendation table
PICO
Evidence-to-recommendation tables
Decision table
REFERENCES
- 1.
- 2.
- 3.
- 4.
- 5.
- 6.
- 7.
- 8.
- 9.
- 10.
- 11.
- 12.
- 13.
- 14.
- 15.
- 16.
- 17.
- 18.
- 19.
- 20.
- 21.
- 22.
- 23.
- 24.
- 25.
- 26.
OTHER REFERENCES
References-evidence to recommendations
- 1.
- 2.
- 3.
- 4.
- 5.
- 6.
- 7.
- 8.
- 9.
- 10.
- 11.
- 12.


