
Abstract
Background The leading cause of mortality for patients with the Neurofibromatosis type 1 (NF1) cancer predisposition syndrome is development of Malignant Peripheral Nerve Sheath Tumor (MPNST), an aggressive soft tissue sarcoma. In the setting of NF1, this cancer type frequently arises from within its common and benign precursor, plexiform neurofibroma (PN). Transformation from the benign PN to MPNST is challenging to diagnose due to difficulties in distinguishing cross-sectional imaging results and intralesional heterogeneity resulting in biopsy sampling errors.
Methods and Findings This multi-institutional study used ultra-low-pass whole genome sequencing (ULP-WGS) of plasma cell-free DNA (cfDNA) to distinguish between MPNST and PN in patients with NF1. Using copy number to estimate the fraction of plasma cfDNA originating from tumor (tumor fraction), we developed a noninvasive classifier which differentiates MPNST from PN with 91% specificity. Healthy controls without NF1 (subjects = 14, plasma samples= 14), PN (subjects = 45, plasma samples = 45), and MPNST (subjects = 14, plasma samples = 48) cohorts showed significant differences in tumor fraction in plasma (P = 0.006) as well as cfDNA fragment length (P < 0.001) with MPNST samples harboring shorter fragments and being enriched for tumor-derived cfDNA relative to PN and healthy controls. Mutational analysis demonstrated focal NF1 copy number loss in PN and MPNST patient plasma but not in healthy controls. Genomic alterations associated with malignant transformation (focal copy number gains in chromosome 8 and copy number losses in SUZ12, SMARCA2, CDKN2A/B, and chromosome arm 9p) were more prominently observed in MPNST plasma. Furthermore, the sum of longest tumor diameters (SLD) visualized by cross-sectional imaging correlated significantly with paired tumor fractions in plasma from MPNST patients (ρ = 0.50, P = 0.0007). On case series analysis, tumor fraction levels in plasma correlated with treatment response to therapy and minimal residual disease (MRD) detection before relapse.
Conclusions Tumor fraction levels derived from copy number alteration analysis of plasma cfDNA using ULP-WGS significantly correlated with MPNST tumor burden, distinguished MPNST from its benign PN precursor, and correlated with treatment response. In the future, our findings could form the basis for improved early cancer detection and monitoring in high-risk cancer-predisposed populations.
Introduction
Neurofibromatosis type 1 (NF1) is an autosomal dominant disorder affecting one in 3,000 individuals worldwide, and is caused by a heterozygous inactivating mutation in the tumor suppressor gene, NF1, located on chromosome 17q11.2 [1–3]. NF1 encodes for the protein neurofibromin 1, a negative regulator of the RAS signaling pathway. Thus, NF1 loss-of-function mutations lead to hyperactivated RAS, whose downstream effects contribute to the elevated cancer risk in NF1 patients [4–6].
Approximately 50% of patients with NF1 develop histologically benign plexiform neurofibroma (PN) [1, 7], in which Schwann cells acquire biallelic inactivation of the NF1 gene [3, 8]. Histologically, PNs are heterogeneous, consisting of primarily S100-positive Schwann cells (60-80%), as well as fibroblasts, endothelial cells, perineural cells, smooth muscle cells, mast cells, interspersed axons, and pericytes [2]. Imaging studies of PN mirror this heterogeneity, complicating the radiographic diagnosis of transformation to malignant peripheral nerve sheath tumor (MPNST), which occurs in 8-15% of cases [1, 9, 10], as well as the accuracy of diagnostic tissue biopsy.
MPNST are aggressive cancers with a poor prognosis that frequently arise from within their benign PN precursors [9, 11–13]. Due to rapid development of metastasis and resistance to both chemotherapy and radiotherapy, MPNST account for the majority of NF1-associated mortality [1, 9] with a 5-year survival rate of only 20% [14]. Despite the high incidence and mortality of MPNST in the NF1 population, screening for malignant transformation and monitoring of MPNST is challenging. Clinical exam has poor sensitivity and may only signify MPNST when a PN lesion is showing sudden growth or causing severe pain [12, 15]. Serial PN biopsies are impractical as 9-21% of NF1 patients will have multiple PN, with varying levels of malignant potential requiring surveillance [16–18]. Moreover, biopsies can yield false negative results due to geographic tumor heterogeneity resulting from MPNST arising from within benign and heterogeneous PN precursor lesions [19, 20]. Furthermore, standard cross-sectional imaging cannot reliably distinguish MPNST from PN [21, 22]. Given the high prevalence of deadly MPNST within a benign precursor lesion in a cancer-predisposed population, it is imperative that more reliable screening modalities be explored.
We and others have shown that other cancer types can be monitored through plasma cell-free DNA (cfDNA) analysis [23–26] and that malignancy can be associated with shorter cfDNA fragment sizes [27–30]. We have also shown that sequenced MPNST tissue harbors chromosomal copy number alterations (CNAs) that are not present in PN, including in cases of MPNST transformation arising from within benign PN lesions [31, 32]. Here, we hypothesize that this MPNST-intrinsic genomic instability is also detectable within plasma cfDNA, and can be used to noninvasively distinguish MPNST from its benign precursor lesion.
In this multi-institutional prospective cohort study, we perform ultra-low-pass whole genome sequencing (ULP-WGS) of cfDNA to detect genome-wide CNAs, which enable us to reliably distinguish MPNST patients from those harboring only PN. We also show that cfDNA from patients with MPNST harbors a unique fragmentation profile compared to PN patients. Finally, we demonstrate that cfDNA analysis can be used to track treatment response in MPNST patients, potentially with greater precision than standard cross-sectional imaging.
Patients and Methods
Study design
This study used blood samples prospectively collected from NF1 patients with MPNST and PN tumors with the aim of distinguishing these different tumor types by plasma cell-free DNA analysis. Patients from the National Cancer Institute (NCI) and Washington University in St. Louis (WUSTL) with clinically and radiographically diagnosed PN or biopsy-proven MPNST were enrolled onto this multi-institutional prospective cohort study with written informed consent (NCI protocol NCT01109394, NIH Intramural IRB identifier 10C0086; NCI protocol NCT00924196, NIH Intramural IRB identifier 08C0079; WUSTL protocol NCT04354064, Washington University in St. Louis School of Medicine Human Research Protection Office IRB identifiers 201903142 and 201203042) between 2016 and 2020. NF1 status was determined clinically by consensus criteria [33]. A total of 14 MPNST and 45 PN patients were enrolled with peripheral blood collected at the time of enrollment (Supplementary Tables 1-3). MPNST patients had serial plasma samples collected for a total of 48 MPNST plasma samples (average 3, maximum 6 per subject, Supplementary Table 1). When available, tissue was also collected at a single time point (n = 4 subjects). When PBMCs were isolated from whole blood, these were sequenced as germline DNA (n = 19 subjects). All patients underwent clinical management and follow-up by board-certified physicians per the standard-of-care. All samples were collected with informed consent for research and institutional review board approval in accordance with the Declaration of Helsinki.
Healthy controls
After obtaining written consent, healthy donor blood samples were obtained at a single time point from appropriately consented donors at the NIH Department of Transfusion medicine (NIH protocol NCT00001846, NIH Intramural IRB identifier 99-CC-0168) and WUSTL Clinical Translational Research Unit (WUSTL protocol NCT04354064, Washington University in St. Louis School of Medicine Human Research Protection Office IRB identifiers 201903142 and 201203042; n = 2 from WUSTL; n = 12 from NCI) (Supplementary Table 4). Eligibility for healthy controls included age greater than 18 years old and no known history of neoplastic or hematological disorders.
Clinical specimens
After obtaining written informed consent for genomic analysis, serial peripheral blood samples were collected throughout the clinical course for consenting MPNST patients or at a single time point for PN patients and healthy controls. Treatment regimentation for MPNST was determined by the primary treating clinicians and included radiotherapy, surgery and cytotoxic chemotherapy (Supplementary Table 2).
Venous blood samples (10-30 ml) were collected in EDTA (BD Biosciences, San Jose, CA) or Cell-Free DNA BCT (Streck Laboratories, La Vista, NE) tubes. EDTA tubes were processed within 4 hours of collection, while Cell-Free DNA BCT tubes were processed within 7 days of collection. Whole blood samples were centrifuged at room temperature (NCI: 1,900 x g for 10 minutes, WUSTL: 1,200 x g for 10 minutes). Isolated plasma was centrifuged a second time at room temperature (NCI: 15,000 x g for 10 minutes, WUSTL: 1,800 x g for 5 minutes) in low-bind Eppendorf tubes to remove residual cells. Purified plasma was frozen at −80 °C until cfDNA isolation.
Cell-free DNA isolation
Purified plasma was thawed at room temperature and cfDNA was extracted from 2-8 mL of plasma using the QIAamp Circulating Nucleic Acid kit (Qiagen, Hilden, Germany). Extracted DNA concentration was measured using the Qubit dsDNA High-Sensitivity assay (ThermoFisher, Waltham, MA) and cfDNA concentration and quality were assessed using a Bioanalyzer (Agilent Technologies, Santa Clara, CA) or Tapestation (Agilent Technologies, Santa Clara, CA). Isolated cfDNA was stored at −20°C until library preparation.
Germline DNA isolation and processing
After centrifuging clinical venous blood samples and removing plasma supernatant per above, the red blood cells and buffy coat were resuspended in PBS for germline DNA extraction using the DNeasy Blood and Tissue kit (Qiagen, Hilden, Germany). For a subset of samples, germline DNA from peripheral blood mononuclear cells was collected in and extracted using PAXgene Blood DNA tubes and kit (PreAnalytix, Germantown, MD). DNA was stored at −20°C until further processing. Germline DNA was then fragmented using a LE220 focused ultrasonicator (Covaris, Woburn, MA) or a Q800R3 sonicator (Qsonica LLC, Newton, CT) according to the manufacturer’s instructions and previously published methods [34] to a target length of 200 bp. DNA lengths were assessed using a Bioanalyzer (Agilent Technologies, Santa Clara, CA).
Tumor DNA isolation and processing
Tumor tissue was not procured for research unless clinically indicated and available following the standard clinical pathology workflow. When available, tumor tissue was snap-frozen and stored at −80°C or stored in formalin-fixed paraffin-embedding (FFPE). Nucleic acids were isolated from tumor FFPE samples using the manufacturer’s protocol with the AllPrep DNA/RNA FFPE kit (Qiagen, Hilden, Germany). DNA was extracted from snap-frozen tumor tissue samples using the DNeasy Blood and Tissue kit (Qiagen, Hilden, Germany). Extracted DNA was stored at −20°C until further processing. Tissue DNA was subsequently fragmented using a LE220 focused ultrasonicator (Covaris, Woburn, MA or Q800R3 sonicator (Qsonica LLC, Newton, CT) and analyzed using a Bioanalyzer (Agilent Technologies, Santa Clara, CA) as described above.
DNA library construction and sequencing
Sequencing libraries were constructed from cfDNA (NCI 5-15 ng, WUSTL 10-60 ng) or germline/tumor DNA (NCI 100 ng, WUSTL 32 ng) using commercial kits per the manufacturers’ instructions: TruSeq Nano (Illumina, San Diego, CA) for NCI samples and Kapa HyperPrep (Roche, Basel, Switzerland) for WUSTL samples. Constructed libraries were balanced, pooled and sequenced using 150 bp paired-end reads on a NovaSeq (Illumina, San Diego, CA) or HiSeq 4000 (Illumina, San Diego, CA). Data was then quality-filtered and pooled for analysis.
Copy number alteration and tumor fraction analysis
Sequencing data was demultiplexed and raw reads were quality-filtered using fastp v.0.2. Quality-filtered reads were then aligned to the hg19 human genome assembly using BWA v.0.7.17. Aligned reads were de-duplicated with Samtools v.1.7. To enrich for circulating tumor DNA fragments, in silico size selection was applied to all cfDNA samples [28]. Only quality-filtered reads between fragment lengths of 90 and 150 bp were considered for copy number and tumor fraction analysis for cfDNA samples, while such size selection was not performed for tumor and germline samples. GC-content bias correction, read count normalization, and copy number-based estimation of tumor fraction were then performed using the ichorCNA tool (Broad v.0.2.0) [35]. Briefly, reads were summed in non-overlapping windows of 106 bases. Local read depth was corrected for GC bias and known regions of low mappability, and artifacts were removed by comparison to ichorCNA’s built-in healthy control reference. CNAs were predicted using recommended low tumor fraction parameters for cfDNA samples and default parameters for tumor and germline samples. X and Y chromosomes were not considered in copy number ratios. ichorCNA then used these binned, bias-corrected copy number values to model a two-component mixture of tumor-derived and non-tumor-derived fragments, from which it inferred the fraction of reads in each sample originating from tumor (tumor fraction) [35]. Visualization of genome-wide copy number alterations (Supplementary Figure 1) was generated from compiled log2 ratios of copy number for all study plasma specimens (n = 107 samples). Bins were classified as copy number gain if log2 of the copy number ratio was > 0.58 (log2 (3/2)) and loss if log2 of the copy number ratio was < −1.0 (log2 (1/2)).
Fragment size analysis
Following the sequencing quality-control, deduplication and alignment steps described above, read-pair fragment sizes for cfDNA samples were calculated using deepTools bamPEFragmentSize [36]. The distribution of each sample’s fragment sizes was estimated by kernel density. Distributions were compared among the three clinical states (healthy control, PN, and MPNST), and between high and low tumor fraction samples by two-sided Kolmogorov-Smirnov testing.
Comparisons of cfDNA tumor fraction to imaging
Patients with MPNST and PN were monitored by CT, MRI, and/or FDG-PET imaging at the managing clinicians’ discretion. For patients with MPNST, radiographic tumor burden was quantified by sum of the longest tumor diameters (SLD) per RECIST 1.1 criteria [37]. For comparison to cfDNA tumor fraction, each plasma sample was matched to the nearest SLD value within 30 days and without any interceding treatments. SLDs and plasma tumor fraction levels were then assessed using Spearman’s rank-order correlation. For comparisons of plasma tumor fraction to clinical status, relative per-patient tumor fraction changes were considered, scaled linearly. Changes in clinical status were assessed and categorized as complete response, partial response, stable disease or progressive disease per RECIST 1.1 criteria [37].
Power and statistical analyses
Previous tissue-based studies have shown that PN harbor few genome-wide CNAs [38, 39] but acquire significant genomic instability during malignant transformation to MPNST [32, 39, 40]. Based on these known significant CNA differences between MPNST and PN tumors, we assumed a large effect size would also be evident comparing MPNST plasma tumor fraction to plasma from PN patients or healthy controls. Using Cohen’s f = 0.6 with an a = 0.05 and power = 0.80, we projected that the sample size needed to detect differences between these three categories would be n = 10 per group. Our category group sizes met or exceeded this estimate for all comparisons (Supplementary Tables 1-4).
When testing associations between plasma tumor fraction and clinical status, we limited MPNST plasma samples to those collected either prior to all treatments or after a washout period of least 21 days after completion of chemotherapy or radiation therapy (designated as pretreatment MPNST samples below). The distributions of plasma tumor fraction for each clinical status were compared by Kruskal-Wallis H test with pairwise comparisons by Dunn’s test. To further compare pretreatment MPNST to benign PN patients, we generated a receiver operator characteristic (ROC) curve of plasma tumor fraction. Tumor fraction values derived from ctDNA-enriched 90-150 bp fragments were compared to tumor fractions derived from all cfDNA fragment lengths. For ctDNA-enriched tumor fraction, an optimized cut-point was determined by Youden’s index, and high and low-plasma tumor fraction groups by cut-point were compared to clinical status by Fisher’s exact test. A logistic regression was also performed for the MPNST versus PN groups, evaluating the effects of age and sex in addition to pretreatment plasma tumor fraction. Statistical analyses were performed using R v.3.6.1 or Prism 9 (GraphPad Software).
Results
Overview and patient characteristics
The primary objective of this study was to noninvasively differentiate MPNST tumors from benign PN by quantifying genomic CNAs in blood plasma cfDNA (Figure 1). To quantify CNAs, we profiled 130 samples (plasma, leukocytes and tissue) from 73 subjects by ULP-WGS to a median depth of 2.2x (Supplementary Table 1). Subject groups compared were MPNST and PN patients as well as healthy donor controls. Specimen types included blood plasma cell-free DNA, blood leukocyte germline DNA, and frozen tumor specimens (Supplementary Table 1). The median age was 36, 22 and 40.5 for MPNST patients, PN patients and healthy donors, respectively (Supplementary Tables 2-4). Among patients with MPNST, 86.7% received chemotherapy, 35.7% received radiation therapy, and 42.9% underwent surgical resection (Supplementary Table 2). Median follow-up time for MPNST patients was 237 days.

Patients with imaging- and biopsy-proven MPNST and imaging-proven PN along with healthy donors were enrolled onto this multi-institutional prospective cohort, with plasma collected for tumor fraction analysis at the time of study enrollment. Tumor fraction was assessed in all collected plasma samples by ULP-WGS, which was used to train a noninvasive MPNST vs. PN classifier. During subsequent treatment and follow-up, MPNST patients underwent further serial imaging (analyzed by RECIST) and plasma sample collection (analyzed by ULP-WGS), with results correlated with each other and with clinical outcomes. cfDNA, cell-free DNA; MPNST, malignant peripheral nerve sheath tumor; PN, plexiform neurofibroma; RECIST, response evaluation criteria in solid tumors, version 1.1; ULP-WGS, ultra-low-pass whole genome sequencing.
Genome-wide CNAs from tumor are detected in plasma
Eighty-eight percent of MPNST and benign plexiform neurofibroma patients enrolled onto our study met the NIH criteria for NF1 diagnosis. Genomic copy number analysis of plasma cell-free DNA further revealed that focal somatic CNAs that have previously been associated with PN tumor progression in NF1 patients [32] were prominently observed in MPNST patients and were occasionally found in PN patients, but absent in healthy controls (Figure 2). For example, loss of CDKN2A/B and SMARCA2, alterations shown to be associated with malignant transformation of PN [32, 41], was observed in plasma from MPNST patients. SMARCA2 loss was also found in the two PN patients with highest tumor fraction, while CDKN2A/B appeared to be copy number neutral in plasma across the full PN cohort. Loss of SUZ12 correlated with NF1 loss, consistent with both genes’ location in the 17.q11.2 genomic locus [32, 42]. Additionally, we observed broader copy number gains in chromosome arm 8q and broad losses in arm 9p only in plasma from an MPNST patient, again consistent with previous findings from NF1 patient tumors [32, 40, 43] (Figure 2). Finally, while many types of NF1 gene activation can underlie the NF1 disease process, we observed evidence of one of these, NF1 copy number loss, within our cohort only among MPNST and PN patients, but not in healthy donor controls.

Each column represents one study subject with ID labels below. The heatmap includes all 73 study subjects, with data from the pretreatment timepoint shown for MPNST patients. Tumor fraction in plasma and important tumor and subject characteristics are in the top panel. The lower panel shows copy number alterations in genomic loci relevant to NF1 and MPNST pathogenesis, depicted as log2 of copy number ratio. MPNST, malignant peripheral nerve sheath tumor; NF1, neurofibromatosis type 1; SLD, sum of longest tumor diameters as determined by RECIST 1.1 criteria.
Given the observed copy number changes in patient plasma (Supplementary Figure 1), we next compared genome-wide CNAs and associated tumor fractions across specimen types. For MPNST cases where tumor, leukocyte, and plasma were all available, the observed copy number aberrations were most prominent in the tumor samples, but also detected in plasma cfDNA prior to treatment, with a pattern reflective of the original tumor (Figure 3a). The magnitude of these CNAs decreased in post-treatment cfDNA compared to pretreatment cfDNA, and germline samples harbored the least detectable CNAs. This trend also held for estimated tumor fractions, representing a sample’s aggregate genome-wide copy number changes (Figure 3b). As expected, there was no such increase in tumor fraction observed in PN lesions or in cfDNA derived from PN or healthy adults.

(A) Genome-wide copy number alterations assessed in four specimen types from a single MPNST patient (sar081): tumor tissue DNA, pretreatment blood plasma cfDNA, post-treatment cfDNA, and germline DNA from pretreatment peripheral blood mononuclear cells. Log2 of copy number ratio is shown across the genome (Methods) with blue depicting copy neutrality, green copy number loss, and red copy number gain. (B) Tumor fractions for all subjects where multiple specimen types were assessed, stratified into different clinical diagnoses by color. Where multiple specimens were available, highest tumor fraction is shown. MPNST, malignant peripheral nerve sheath tumor; PN, plexiform neurofibroma.
Tumor fraction distinguishes MPNST from plexiform neurofibroma
Given that tumor-derived CNAs were detected in plasma cfDNA from MPNST patients, we next investigated the ability of plasma tumor fraction to noninvasively differentiate MPNST from PN. Plasma tumor fraction was compared between healthy controls, PN and all pretreatment MPNST patients. Strikingly, cfDNA tumor fraction differentiated all three groups (healthy vs. PN, P = 0.034; healthy vs. MPNST, P = 0.00018; PN vs. MPNST, P = 0.0076) with lowest levels present in healthy subjects (median 0.0242), elevated plasma tumor fraction in PN patients (median 0.0258), and significantly elevated plasma tumor fraction in pretreatment MPNST patients (median 0.0435) (Figure 4a). Comparing plasma tumor fractions between pretreatment MPNST patients and benign PN patients, receiver operating characteristic (ROC) analysis further demonstrated an area under the curve of 0.76 (Figure 4b). This signified the ability to accurately discriminate between MPNST and PN using only plasma tumor fraction levels. Thus, utilizing an optimized cut-point of 0.047, plasma tumor fraction differentiated MPNST from PN with a sensitivity of 0.58 and specificity of 0.91, with 37 of 41 PN cases successfully classified based on plasma tumor fraction alone (P = 0.001). In a multivariate binary logistic regression including age and sex, plasma tumor fraction remained significantly associated with clinical status (P = 0.018) while the other covariates were not (Supplementary Table 5). When including median sequencing depth in the logistic regression, tumor fraction again remained significantly associated with clinical status (P = 0.033). Using high-tumor fraction versus low-tumor fraction groups as determined by the optimal tumor fraction cut-point of 0.047, we also observed that high-plasma tumor fraction and low-plasma tumor fraction cases differed significantly in their fragment length distributions (D = 0.088, P < 0.001 by two-sample Kolmogorov-Smirnov test) with high-plasma tumor fraction cases enriched for shorter cfDNA fragments and low-plasma tumor fraction cfDNA enriched for longer fragments (Figure 4c). Similarly, clinically classified MPNST patients harbored significantly shorter cfDNA fragments compared to PN patients (D = 0.044, P < 0.001) and healthy donors (Supplementary Figure 2).

(A) Tumor fraction in pretreatment plasma cell-free DNA for all study subjects (n = 73), stratified by clinical diagnosis, with significance assessed by the Dunn test after Kruskal-Wallis analysis of variance. (B) Receiver operating characteristic (ROC) curve of plasma cfDNA tumor fraction comparing pretreatment MPNST to plexiform neurofibroma patients. Solid line represents tumor fraction data derived only from 90-150 bp fragments while dotted line represents tumor fractions derived from all fragment lengths. (C) Fragment length density for cell-free DNA in MPNST and PN patients (n = 93 samples) with high (>0.047) versus low (<0.047) tumor fractions in plasma as determined by the Youden’s index-optimized cutpoint of the ROC curve. The dashed line highlights an inflection in the curves with high tumor fraction samples enriched for shorter cfDNA fragment sizes (<138 bp) and low tumor fraction samples enriched for longer cfDNA fragment sizes (D = 0.088, P < 0.001 by two-sample Kolmogorov-Smirnov test). Data is shown for sequencing reads within the 90 to 150 bp in-silico size-selection range (Methods). AUC, area under the curve; bp, base pairs; cfDNA, cell-free DNA; MPNST, malignant peripheral nerve sheath tumor; Sn, sensitivity; Sp, specificity.
MPNST plasma tumor fraction correlates with disease burden by imaging
Having established plasma tumor fraction as a specific means to classify MPNST cases noninvasively, we next investigated the relationship between plasma tumor fraction and radiographic tumor burden. Radiographic tumor burden was quantified by the sum of longest diameters (SLD) by RECIST 1.1 criteria [37] and compared to matched plasma cfDNA tumor fraction levels (Methods). Despite the use of starkly different methodologies to derive SLD versus plasma tumor fraction, a significantly positive correlation was observed between the two metrics (Spearman’s ρ = 0.50, P = 0.0007) (Figure 5a). Also, because RECIST SLD measurements are restricted to five total lesions, two lesions per organ and do not include bony disease, SLD may underestimate tumor burden in metastatic MPNST patients [37]. Conversely, SLD may overestimate the size of malignant tissue in primary MPNST lesions which often arise from within PN, with the relative contribution of PN versus MPNST tissue to the overall lesion size difficult to accurately assess radiographically [44]. These challenges limit the ability of SLD to accurately define MPNST disease burden and may further explain why the correlation of SLD to tumor fraction was not stronger.

(A) Sum of longest diameters (SLD) of target lesions for all MPNST patients are plotted against each SLD’s nearest plasma tumor fraction value (Methods). Spearman correlation is significant at P = 0.0007. (B) Timelines of RECIST classification for MPNST patients that underwent serial monitoring (n = 8). Overlaid are relative plasma tumor fraction values scaled linearly per patient (Methods). cfDNA, cell-free DNA; RECIST, response evaluation criteria in solid tumors, version 1.1.
We furthermore tracked both SLD and plasma tumor fractions over time in patients with serial time point data (Supplementary Table 1). We applied RECIST 1.1 criteria [37] in these patients to classify radiographic response to therapy (Methods). In each instance of disease progression identified by RECIST, we observed a concomitant increase in relative tumor fraction (Figure 5b). Specifically, subjects sar079, sar080 and sar102 began by experiencing long periods of radiographic stability and response before ultimately developing progressive disease (PD). In each such case, cfDNA tumor fraction increased when the patients transitioned from radiographically stable or responsive disease to tumor progression. On the other hand, subjects sar082, sar084 and sar085 experienced persistently progressive disease refractory to treatment throughout the follow-up period with SLD showing disease progression in each follow-up scan, which appeared to correlate with rising plasma tumor fractions as well.
Given that per-patient changes in plasma cfDNA tumor fraction appeared overall to correlate with radiographic tumor burden in MPNST patients, we next studied timelines of disease progression versus response for a set of MPNST patients, comparing imaging SLD to plasma tumor fraction in the context of the specific treatments received. For example, sar085 presented with a small recurrent lung MPNST that rapidly progressed into multiple thoracic metastases despite two lines of cytotoxic chemotherapy, but then partially responded to third-line chemotherapy (Figure 6). Interestingly, plasma tumor fraction levels closely tracked with SLD from CT imaging throughout this dynamic treatment course. These data suggest that plasma tumor fraction could thus be utilized to monitor treatment response.

This patient had a high-grade thoracic MPNST recurrence that progressed rapidly through first- and second-line chemotherapy but responded to third-line chemotherapy. Tumor fraction in plasma was initially undetectable, then rapidly increased during first- and second-line chemotherapy, followed by a rapid decrease during third-line chemotherapy. This dynamic tumor fraction in plasma correlated well with the sum of longest tumor diameters (SLD) measured radiographically by RECIST 1.1 criteria. Chemo, chemotherapy; cm, centimeters; MPNST, malignant peripheral nerve sheath tumor; Tx, treatment.
There were also several instances where we observed cfDNA tumor fraction elevations anticipating and preceding corresponding SLD increases. sar80 is an illustrative example in which the patient had complete resection of a right pelvic MPNST prior to plasma cfDNA analysis (Figure 7). Initial plasma tumor fraction was not detected, which was consistent with our finding of no evidence of disease by imaging. Follow-up imaging again showed no evidence of disease 2.5 months later. Plasma tumor fraction rose, however, just 14 days after this most recent negative imaging study. Still, radiographic recurrence was not detected until 89 days later, suggesting that the measurement of plasma tumor fraction could be utilized as a sensitive surveillance tool for minimal residual disease detection following the completion of therapy.

This patient previously had a high-grade pelvic MPNST that was completely resected with no evidence of residual disease after surgery. Tumor fraction in plasma was undetectable following resection but was detected 150 days later (tumor fraction = 0.021); this preceded metastatic recurrence identified on surveillance imaging by 89 days. cm, centimeters; MPNST, malignant peripheral nerve sheath tumor; SLD, sum of longest tumor diameters as determined by RECIST 1.1 criteria.
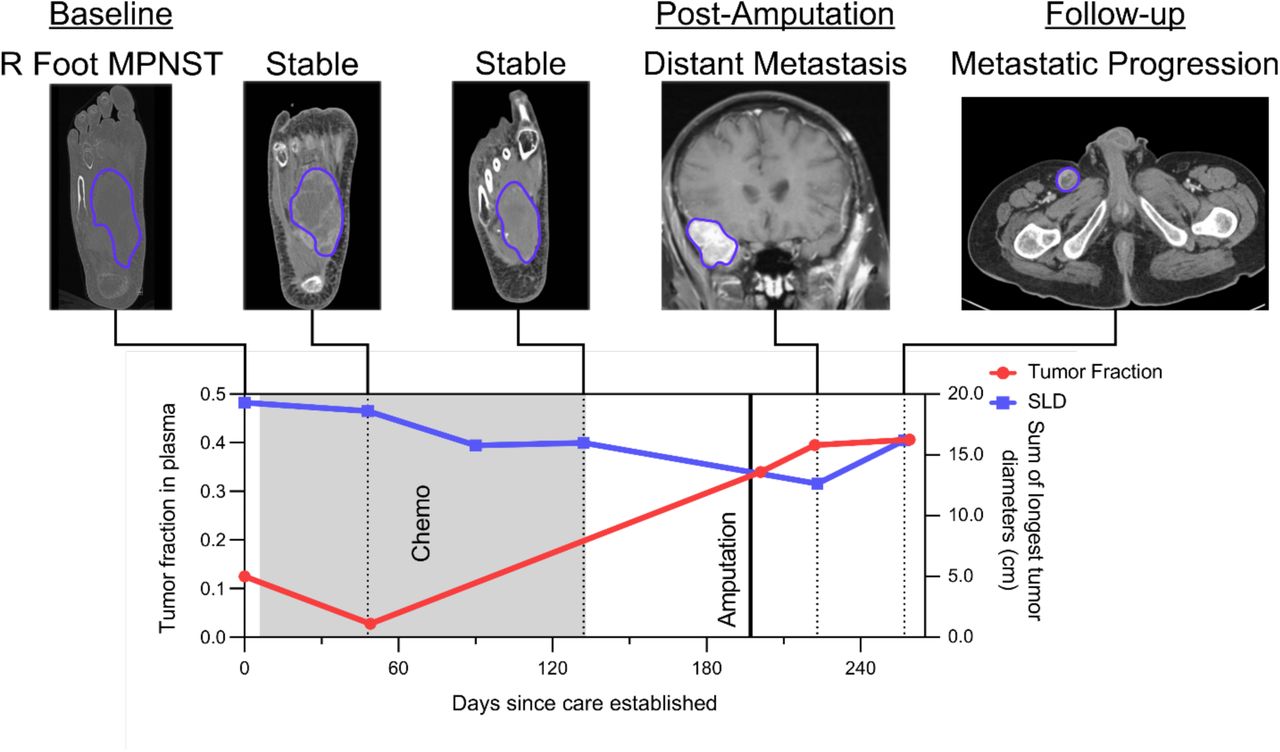
sar102 illustrates another example where cfDNA tumor fraction elevation preceded radiographic progression. This patient had metastatic MPNST with a presumed right foot primary (Figure 8). During and following over four months of cytotoxic chemotherapy, imaging showed a partial response with persistently decreasing SLD. Given radiographic evidence of disease control, the medical team then decided to hold cytotoxic chemotherapy for an elective lower-limb amputation with the goal of improved quality of life (pain reduction and ability to use a prosthetic limb). In contrast to SLD, plasma tumor fraction increased 14-fold during this same interval (Supplementary Table 1). Following cessation of cytotoxic agents and amputation, the patient was found to have significant widespread tumor progression with the development of multiple distant metastases including brain metastases. Here, plasma tumor fraction was more consistent than serial imaging with this patient’s ultimate clinical status, and could have influenced the decision to hold chemotherapy in order to perform an elective, palliative amputation. This illustrates the potential utility of plasma cfDNA tumor fraction analysis for monitoring disease, anticipating progression, and influencing clinical decision-making.

This patient had a high-grade MPNST in the right foot that was stable by imaging and therefore had chemotherapeutic agents held in order to undergo an elective lower limb amputation for improved quality of life. Tumor fraction in plasma, however, increased during this pre-surgical time period, consistent with progressive metastatic disease which became apparent on imaging shortly after surgery. The patient would not have had chemotherapy held to undergo lower limb amputation had there been earlier evidence of progressive metastatic disease. Chemo, chemotherapy; cm, centimeters; MPNST, malignant peripheral nerve sheath tumor; SLD, sum of longest tumor diameters as determined by RECIST 1.1 criteria.
Discussion
MPNST are aggressive soft tissue sarcomas that can be difficult to distinguish from their benign precursors, illustrating the need for new testing modalities for better disease detection and surveillance. Here we present, to our knowledge, the first study to differentiate malignant from pre-malignant solid tumor using cfDNA analysis in the setting of a cancer predisposition syndrome. Our data illustrate several important points. First, we accurately identified copy number-altered genomic loci characteristic of malignant transformation from benign PN using ultra-low-pass WGS of cfDNA (Figure 2) [32, 41]. Specifically, loss of CDKN2A/B and SMARCA2 were commonly found only in MPNST plasma samples, while loss of NF1 was observed in both MPNST and PN plasma, but not healthy controls. When paired tumor was available, plasma cfDNA-detected CNAs recapitulated tissue patterns of genomic instability (Figure 3a). Together, these data suggest that even at low sequencing coverage, the genomic features of both NF1 and of progression from PN to MPNST are detectable in affected patients’ plasma.
Second, we show that plasma tumor fraction derived from genome-wide CNAs, without applying prior knowledge of patient-specific mutational profiles, differentiated MPNST from PN with high specificity (91%) and moderate sensitivity (58%), suggesting that cfDNA tumor fraction could be a valuable adjunct to aid in monitoring patients with PN with the goal of early cancer detection. Currently, malignant transformation in NF1 patients is difficult to screen for due to overlapping clinical symptoms and radiographic findings that are also associated with benign PN [45, 46]. Reflective of this, current standard practice for PN surveillance is to obtain imaging only when clinically indicated. Moreover, clinical surveillance for symptoms such as lesion-associated pain have a low specificity for identifying MPNST on subsequent workup [45, 47, 48]. Furthermore, the lack of reliable radiographic characteristics using standard sequences that can be replicated across institutions has contributed to overall limited sensitivity of MRI (62.5-84%) and specificity of FDG-PET (52.2-83%) for MPNST detection [21, 22, 49]. Highlighting further diagnostic challenges, the development of MPNST from within PN lesions causes sampling bias in image guided biopsies resulting in a low negative predictive value (NPV) [19, 20].
Unlike image-guided tumor biopsy, our liquid biopsy approach to measure tumor fraction reflects chromosomal instability throughout the body, limiting the potential for sampling bias. Previous studies have shown the ability of cfDNA WGS CNAs to identify subjects with cancer [50] but only in comparison to healthy controls. Here we extend this body of work to show that cfDNA copy number aberrations can also detect the malignant transformation in the context of a cancer predisposition syndrome. Moreover, we built upon prior literature showing that fragment lengths of cell-free DNA from cancer patients are shorter than those in healthy donors [28–30], now showing that that malignancy-associated cfDNA is also shorter than its premalignancy-associated counterpart (Figure 4c, Supplementary Figure 1). Overall, our cfDNA tumor fraction metric was a robust classifier of MPNST versus PN despite integrating data from two separate institutions using different library preparation chemistries and sequencing platforms (see Methods).
Third, we show that cfDNA tumor fraction dynamics closely track with disease status in MPNST patients. CNAs in plasma cfDNA have been previously shown to correlate with radiographic burden of disease in established cancer patients [51]. Our study, similarly, showed significant correlation between sample tumor fraction and radiographic tumor burden (Figure 5a). Additionally, for individual patients with serial plasma samples and serial imaging studies, changes in cfDNA tumor fraction predicted changes in tumor burden and disease state (Figure 5b). These findings highlight the potential for ULP-WGS surveillance in NF1, not only to distinguish between benign and malignant tumors, but also to serve as a biomarker to track treatment response and to improve detection of minimal residual disease (MRD) following local disease control. Prospective evaluation in interventional trials is warranted.
A limitation of our study is the modest sample size of MPNST patients. Although MPNST are the most common cause of mortality in the most common cancer predisposition syndrome (NF1), they still represent a rare tumor. Indeed, landmark publications on MPNST genomics comprise of cohorts ranging from 12 to 15 patients [41, 42]. We were able to obtain a comparable sample size in our study for this rare tumor and a 4-fold greater number of samples from patients with its precursor lesion given that we prospectively enrolled from two worldwide NF1 referral centers, WUSTL and the NCI. The clinical translation of our findings, however, will ultimately require even larger multi-institutional cohorts.
The sensitivity of our current method is also impacted by low sequencing depth. We partially mitigated this limitation through in silico size selection of plasma cfDNA to enrich for shorter-sized ctDNA fragments as previously described [28]. In this way, we significantly lowered our assay’s limit of detection (Figure 4b, Supplementary Figure 2). Future studies will aim to distinguish PN and MPNST from atypical neurofibroma (AN) which represents an intermediate step of malignant transformation in at least a subset of patients [52, 53]. Future studies should also incorporate additional circulating biomarkers including methylomes [54–56] as well as nucleotide variants identified by targeted hybrid-capture sequencing [57] for co-analysis to further improved sensitivity, lower the limit of detection, and ultimately identify malignant transformation sooner.
In conclusion, CNAs detectable in plasma cfDNA by ULP-WGS can specifically identify MPNST in patients with NF1 and distinguish them from their predisposing benign neoplasms. Application of this non-invasive method has potential as an arbiter for equivocal imaging, as a biomarker for treatment response, and most importantly for the early detection of MPNST. These advances are critical for improving the substantial morbidity and mortality associated with these aggressive tumors in patients with this common cancer predisposition syndrome.
Data Availability
Data will be publicly available following print publication of the study.
Supplementary Figures and Tables

The shown plots represent aggregate plasma cell-free DNA data compiled from all blood plasma specimens in this study (n = 107) categorized by tumor fraction to be either (A) MPNST or (B) plexiform neurofibroma using our noninvasive classifier (Figure 4b; Methods) or (C) acquired from healthy donors. Copy number ratios across the genome are shown on a log2 scale with significant gains in red, significant losses in blue, and regions without significant gain or loss depicted in gray (Methods). Loci highlighted in green have been previously associated with MPNST or NF1 (Figure 2; Methods). The associated genes are also labeled and depicted by green diamonds. MPNST, malignant peripheral nerve sheath tumor; PN, plexiform neurofibroma.

(A) Fragment size distributions of cfDNA from healthy donors, PN and MPNST patients (Methods). cfDNA fragment sizes in MPNST patients were significantly shorter than from PN patients (D = 0.044, P < 0.001) or healthy donors (D = 0.075, P < 0.001) by two-sample Kilmogorov-Smirnov testing. (B) Log2 ratio of the differences in cfDNA fragment sizes from patients with MPNST versus PN with the dashed line indicating the upper boundary used for in-silico size selection (150 bp). For panel A, all plasma samples in the study were analyzed (14 healthy, 45 PN, 48 MPNST), while in panel B, only samples without in vitro size selection were included (n =62; Methods). bp, base pairs; cfDNA, cell-free DNA; MPNST, malignant peripheral nerve sheath tumor; PN, plexiform neurofibroma.
Supplementary Table 1. Details of all sequencing libraries used in study.
Supplementary Table 2. MPNST patient characteristics.
Supplementary Table 3. Plexiform neurofibroma patient characteristics.
Supplementary Table 4. Healthy adult donor characteristics.
Supplementary Table 5. Logistic regression predicting clinical status.
Acknowledgements
We are grateful to the patients and families involved in this study, to the clinical research team for collection of samples and clinical data, to the Washington University Neurofibromatosis (NF) Center, and to the NCI Center for Cancer Research Intramural Research Program. We also thank D. Gutmann, T. Ley and A. Newman for providing critical feedback on the manuscript. This study utilized the computational resources of the McDonnell Genome Institute at Washington University, and the High Performance Computing Biowulf cluster at the National Institutes of Health. Images from Biorender.com were used to create Figure 1.
Abbreviations
- AN
- atypical neurofibroma
- CNA
- copy number alteration
- cfDNA
- cell-free DNA
- NCI
- National Cancer Institute
- NF1
- neurofibromatosis type 1
- PN
- plexiform neurofibroma
- MPNST
- malignant peripheral nerve sheath tumor
- ROC
- receiver operating characteristic
- SLD
- sum of longest diameters
- ULP-WGS
- ultra-low-pass whole genome sequencing
- WUSTL
- Washington University in Saint Louis.
References


