
Abstract
Residents of Long-Term Care Facilities (LTCFs) represent a major share of COVID-19 deaths worldwide. Information on vaccine effectiveness in these settings is essential to improve mitigation strategies, but evidence remains limited. To evaluate the early effect of the administration of BNT162b2 mRNA vaccines in LTCFs, we monitored subsequent SARS-CoV-2 documented infections and deaths in Catalonia, a region of Spain, and compared them to counterfactual model predictions from February 6th to March 28th, 2021, the subsequent time period after which 70% of residents were fully vaccinated. We calculated the reduction in SARS-CoV-2 documented infections and deaths as well as the detected county-level transmission. We estimated that once more than 70% of the LTCFs population were fully vaccinated, 74% (58%-81%, 90% CI) of COVID-19 deaths and 75% (36%-86%) of all documented infections were prevented. Further, detectable transmission was reduced up to 90% (76-93%). Our findings provide evidence that high-coverage vaccination is the most effective intervention to prevent SARS-CoV-2 transmission and death. Widespread vaccination could be a feasible avenue to control the COVID-19 pandemic.
Introduction
Widespread vaccination has the potential to significantly reduce SARS_CoV-2 infections and deaths, and subsequently improve social and economic conditions [1]. Available mRNA COVID-19 vaccines have been approved due to their capacity to reduce symptomatic disease, hospitalizations, and deaths in clinical trials [2,3], but evidence of their real-world effectiveness remains limited [4,5].
Among all populations, residents of Long-Term Care Facilities (LTCFs) represent a major share of COVID-19 deaths, with a 7-fold higher incidence of death compared to the general population in the US [6,7]. As a consequence, they have been prioritized for vaccinations in most settings. While observational data post-vaccination are scarce to date, particularly regarding LTCFs [8], early assessments on whether clinical trial results are good indicators of vaccine effectiveness in LTCFs would help refine control strategies [1].
In this study, we aimed to quantify the early effect of the administration of the BNT162b2 mRNA COVID-19 vaccine on reducing the risk of SARS-CoV-2 transmission and COVID-19 death in LTCFs in Catalonia (Spain).
Methods
Documented COVID-19 infections, identified with a molecular test (PCR or antigen) independently of symptoms, were assumed to capture most infections. Documented deaths attributable to COVID-19 included those with laboratory confirmation and those only meeting clinical and epidemiologic criteria. Detected county-level transmission was used as an indicator of transmission and defined as at least one documented infection in any facility within a county per unit of time. LTCFs residents were defined as those living in a LTCFs and older than 64y. The general population, or “community”, was defined as all people in a county not living in LTCFs. All vaccinated individuals received the two doses of the BNT162b2 mRNA vaccine. For further details see Supplementary Information Section S1.
We generated multiple time series of daily confirmed infections, deaths, and vaccinations in LTCFs, aggregated by healthcare area level (n=9), and in the broader Catalonia region. Similarly, we collected daily confirmed infections in the general population, at the healthcare-area level and regional level. For each of these time series, we took a moving weekly average around each day to smooth some of the daily variation of reporting. Further, we generated a time series of the detected county-level transmission (n= 41, “comarques”) by week. The pre-vaccination period was from July 6 to December 27 2020, when vaccination in LTCFs began. We evaluated the impact of vaccines during an evaluation time period from February 6 to March 28, 2021, the subsequent time period after which 70% of residents were vaccinated with two doses. The 70% threshold was chosen to represent the estimated herd immunity - the estimated level of immunity in a population that prevents uncontrolled spread of infections [9]. As a sensitivity test, we evaluated the effect of partial vaccination in a longer period starting on January 14, when 70% of residents had received the first dose of the vaccine.
We built regression models to predict the number of infections and deaths using community infections as inputs. These models were calibrated during the pre-vaccination period and then used to generate predictions in the absence of vaccines during the evaluation period. We compared the models’ counterfactual predictions with observations; discrepancies were used to quantify the effects of the vaccine. Further, for each county with at least one pre-vaccination week with a transmission event and at least one week without one (n=36), we built logistic regressions to estimate the probability that a documented transmission would be observed, using community infections as input. These models were trained on the pre-vaccination period and then used to predict transmission events in the evaluation period; the aggregated county-level predicted probabilities and the aggregated observed transmissions were compared to quantify vaccine effectiveness. See Supplementary Information Section S1 for further details on the models.
Results
We quantified the effect of administering the BNT162b2 vaccine (a) on reducing deaths and documented infections among residents older than 64y, and (b) on reducing detected transmission caused by SARS-CoV-2 in LTCFs in Catalonia.
Figure 1 A shows the temporal evolution of infections documented in the community and in LTCFs between July 6, 2020 - March 28 2021. For context, the cumulative vaccination coverage among all LTCFs residents is shown in panel B. Vaccination was deployed among residents and healthcare workers at similar times across LTCFs facilities in the region, beginning December 27 and reaching more than 95% of 2-dose coverage within 2 months.
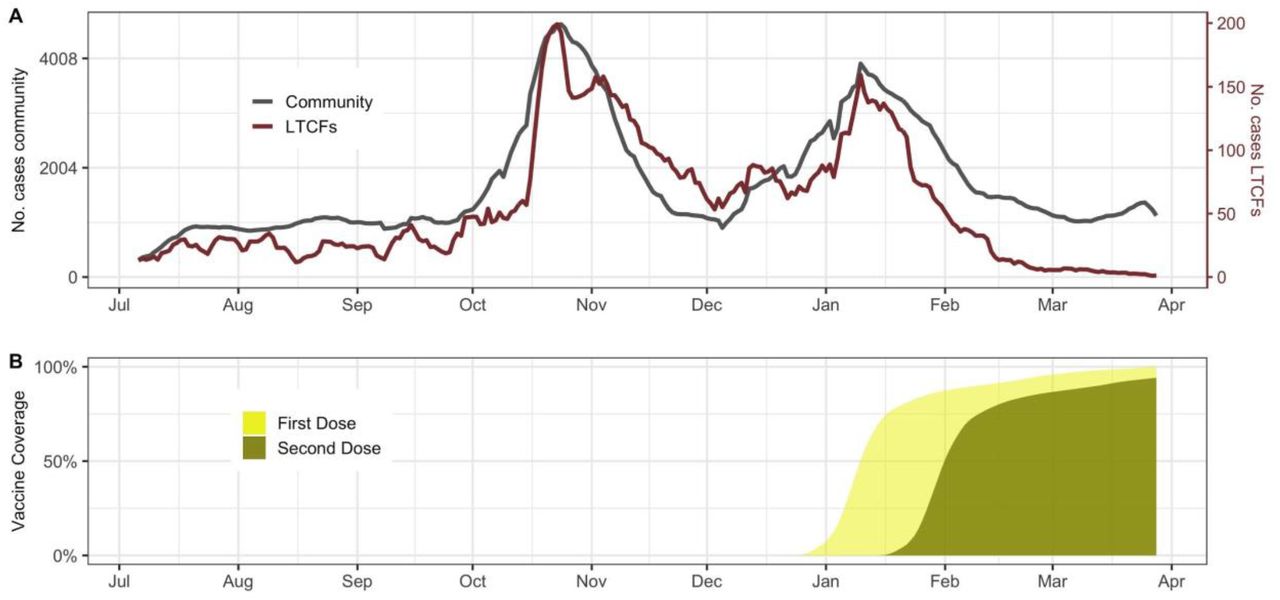
A) Comparison of the total community (grey) and LTCFs documented infections (red) trajectories in Catalonia, Spain. B) First and second dose vaccine coverage among LTCFs residents
Figure 2 A and B show predictions and observations of documented infections and deaths in all of Catalonia over time. We estimated that between February 6-March 28 2021, vaccines prevented 75% of documented infections (36% - 86%, 90% CI), and 74% of deaths (58% - 81%, 90% CI). As well, our analysis shows that two weeks after 70% of residents were fully vaccinated, detected transmission was significantly reduced by 69% (24-80% 90%CI), 54% (0-70%), 50% (0-68%), 69% (25-80%), and 90% (76-93% 90%CI) for each subsequent epidemiological week (Figure 2C).
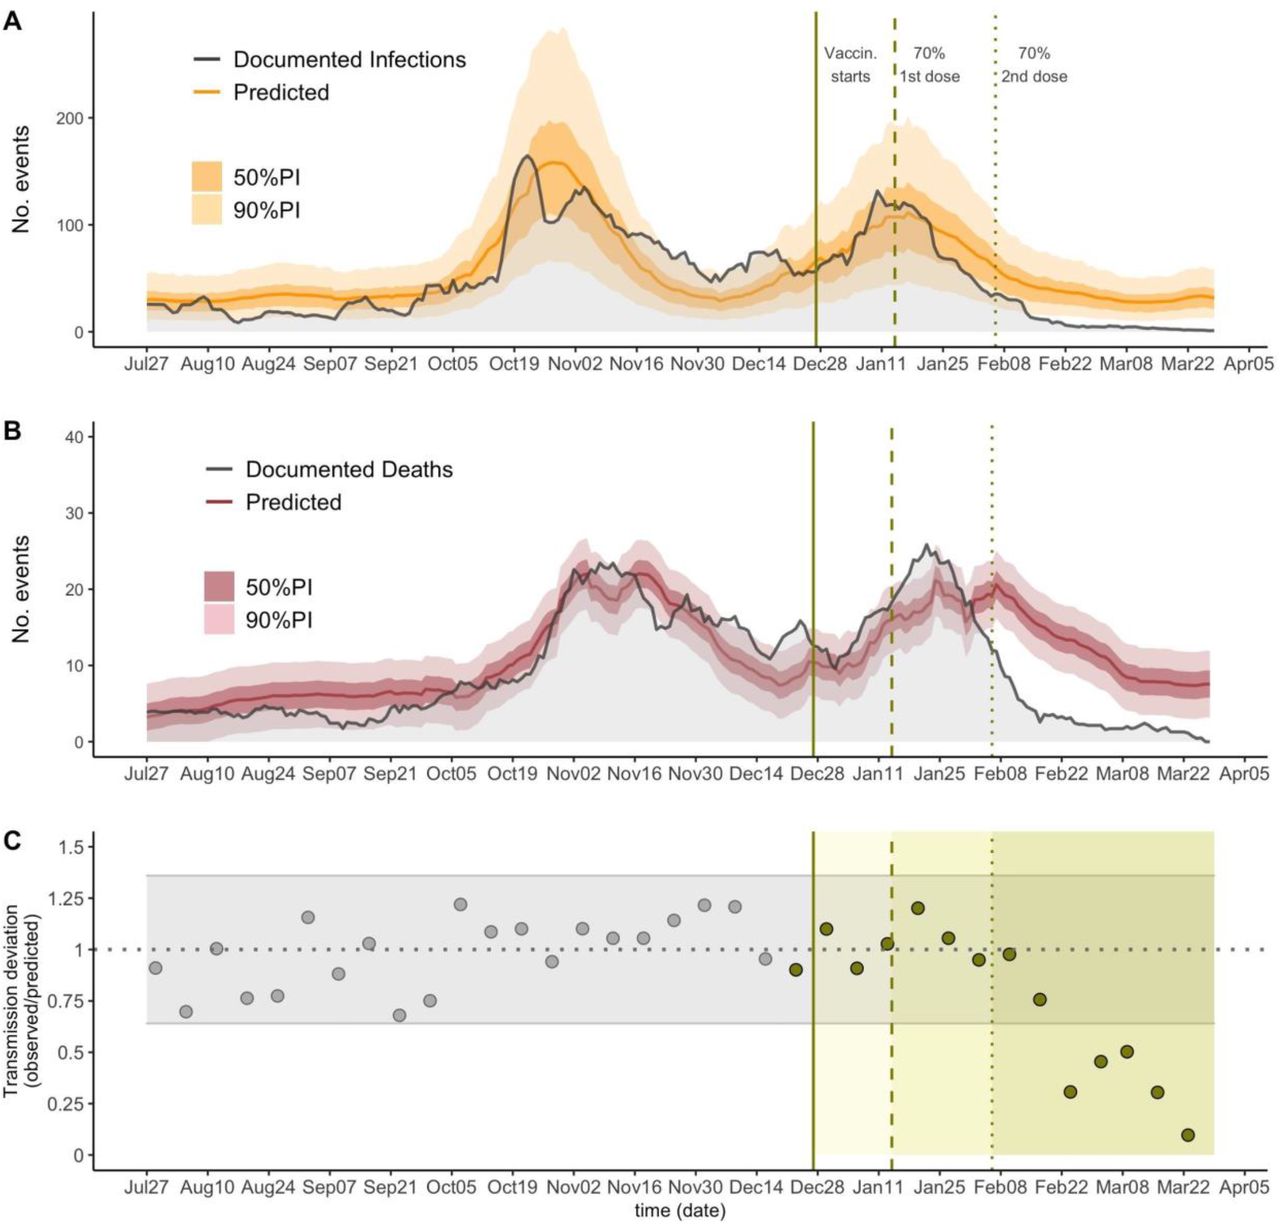
The predictions for infections (A) and deaths (B) across all of Catalonia. The solid lines show the model predictions from training July 6, 2020 through December 27, 2020, the darker shaded background shows the 50% prediction intervals (PI) and the lighter background shows the 90% PI. Vertical lines show key analysis time points: when vaccination started (solid), when 70% of residents received the first dose and when 70% of residents received the second dose. (C) The ratio between observed and predicted transmission at county level in Catalonia, represented by point estimates, grey for the training period and green for the prediction period; grey horizontal ribbon represents the 90% confidence interval. Solid green areas represent the prediction periods after vaccination starts.
Discussion
In this study we show that high vaccination coverage (over 70%) prevented around 3 out of 4 expected COVID-19 deaths in subsequent weeks, which is consistent with the vaccine effect estimated in clinical trials [2] and observational studies [4,8].
Furthermore, LTCFs represent enclosed populations, where transmission is caused both by external introduction of the virus, mostly by the staff [10], and internal transmission. Observational findings from facilities with high infection-ascertainment, such as those studied here, may provide valuable information of what may be expected to happen in more general settings and populations. Given this, we conclude that beyond the specific risk factors of the population in LTCFs, such as age or comorbidities, our findings suggest that high-coverage vaccination can rapidly control SARS-CoV-2 transmission in an enclosed population. Particularly, our analysis suggests that transmission is reduced 3-10-fold one month after vaccination has reached 70% coverage.
Our methodological assumptions may lead to underestimation of the true vaccine effect. First, our definition of transmission events at the county-level does not capture the facility-level transmission; thus, our results may fail to capture more dramatic facility-level reductions in transmission. Second, the counterfactual estimates of deaths produced by our models may be underestimations of mortality during the evaluation period. Indeed, the documented deaths were generally higher than those estimated by our models in December and January (Figure 2B). It is plausible that factors not considered in the model, such as seasonality [11] and/or the spread of more lethal variants [12] may have increased COVID-19 mortality in recent times.
In addition, we acknowledge that our investigation has limitations. We assume that the rigorous screening standards in LTCFs in Catalonia led to infection ascertainment close to 100% and also that the ascertainment of community infections does not change dramatically over time. While this may appear unrealistic, we suspect it is not far from the truth, as public health authorities in Catalonia substantially increased the infection screening efforts in LTCFs before the vaccination campaign [13].
Further, regression models were not designed for accurate infection (or deaths) forecasting and as such, they may not fully capture the epidemiological dynamics. However, our efforts were focused on proper inference of the expected epidemic trajectory in the absence of vaccination. This goal is achieved as our models appear to reasonably capture the overall dynamics during the pre-vaccination time periods, even at high spatial granularity (Supplementary Information Figure S1-S2).
Finally, there could be unmeasured confounders, such as behavior or policy changes, not captured by our models, that may have changed the dynamics of transmission between the community and LTCFs over time ╌this may be the case in the health area Alt Pirineu i Aran (Supplementary Information Figure S1-S2). In most studied regions, however, we suspect this was not the case.
In spite of these limitations, our analyses provide evidence that vaccination may be the most effective intervention in controlling SARS-CoV-2 spread and subsequent risk of death available to date. If our findings continue to be confirmed by future studies, widespread vaccination could be shown to be a feasible avenue to control the COVID-19 pandemic.
Data Availability
All data was obtained from a publicly available repository https://www.dadescovid.cat.
Data availability
All data was obtained from a publicly available repository https://www.dadescovid.cat.
Funding statement
PMD was supported by National Institute of General Medical Sciences, grant number 5R35GM124715-02. NL was supported by the National Institute of Health Big Data Training Grant (T32 LM012411) and MS was partially funded by the National Institute of General Medical Sciences of the National Institutes of Health (R01 GM130668). The content is solely the responsibility of the authors and does not necessarily represent the official views of the National Institutes of Health.
Competing interests
All authors declare no competing interests.
Author’s contributions
PMD, NL, and MS conceived the study and designed and formulated the primary statistical models. PMD and NL implemented the models, wrote the code and performed analysis. All authors contributed to model design, interpretation of results, writing and editing for the manuscript. MS supervised the study.
Supplementary Information
Section S1. Supplementary Methods
Details on ascertainment standards
Starting in July 2020, LTCFs in Catalonia implemented rigorous COVID-19 surveillance that did not solely rely on detection of symptomatic cases [1]. All contacts among staff and residents are screened using molecular test (PCR or antigen test) immediately upon confirmation of an index infection in a facility; further, all staff and residents are regularly screened independently of whether the individuals show symptoms or not; public health guidelines require to screen staff every 2-4 weeks depending on the population size where the LTCFs is located. Thus, the amount of documented infection relies under all infections but over symptomatic infections (which have been estimated to be around ∼60% in LTCFs/skilled nursing homes) [2,3]. For our analysis using this dataset, we assume that the number of documented infections and COVID019 deaths closely approximates the true number of infections and deaths. For example, in a facility where individuals are screened every 2 weeks [4] on top of having symptomatic surveillance and outbreak investigation standards, reporting no documented infections ╌when in reality there is transmission╌ would require the full outbreak to remain undetected (i.e all infections occurring within the same outbreak remain asymptomatic), the outbreak to die off within days or weeks without isolation of exposed individuals, and the infections to show no detectable viral RNA in <14 days after infection (the median duration of detectable SARS-CoV-2 in unvaccinated individuals is estimated to be ∼20 days [5]). Similarly we assume that the event of not detecting any infection in any of the facilities of a county for a whole week closely approximates the true absence of transmission in the county. Deviations from these assumptions are discussed in the main text.
Estimating Infections and Deaths Averted By Vaccinations
To estimate the total infections and deaths averted, we aggregate data across all of Catalonia. While it might make sense to use point estimates of infections and deaths averted from individual counties, the more granular model fits are not as good and there is not a clear way to combine the uncertainty from these multiple estimates given their temporal and spatial correlation. We trained a negative binomial model (model 1, eq. 1) to predict the nursing home infections, Nd, for day d using community infections that day and one week prior, Cd and Cd−7 respectively. Nd and Cd are moving weekly averages of documented infections.
 where Sd = 1 − Imd andImd is the proportion of the population that is immune:

We include an offset term log(Sd), where Sd is the proportion of the population that is susceptible, to account for the expected decrease in infections due to susceptible depletion; including log(Sd) amounts to multiplying predictions by the susceptible proportion. Dd is the weekly average of deaths on day d, the (1 − 0.18/365) term accounts for a 18% turnover rate in nursing homes in a usual year [6], and n is the estimated nursing home population (n=57,922). Since the exact population size in LTCFs was not available at all considered spatial resolutions, we approximated this quantity by the maximum number of vaccinated people once vaccination was reported complete (n=57,922).
For deaths, we use a similar model (model 2, eq. 2), though we use a zero-intercept linear regression of community infections because the relationship between number of infections and number of deaths is likely linear (because a specific proportion of nursing home infections weeks prior will be expected to die).

The model was trained on data from a baseline period, July 6, 2020 to December 27, 2020, and then applied to data from an evaluation period, December 28 to March 28 (on December 26, nursing homes began administering vaccines). We generated model fits and prediction intervals in the evaluation period. The prediction intervals for deaths (eq. 2) were generated by using R’s prediction function and the prediction intervals for infections (eq. 1) were generated using a parametric bootstrap procedure. To estimate the number of infections or deaths averted during a target period, we summed the daily model fits and bounds of the prediction intervals. This yields wider intervals than is likely true but given the temporal correlation of the predictions it would not be sensible to combine the variances of each prediction as if they were independent. We selected two target periods to compute averted infections and deaths based on the dates when 70% of the nursing homes residents received the first vaccine dose and when the same proportion received the second dose January 14 and February 6. This allowed us to adjust for changes over time of the vaccines’ effect given the delay between vaccination and efficacious immunization, as well as to account for vaccine coverage close to herd immunity estimates (assumed >70%, see main text). As a supplementary analysis (see supplementary analysis, section S2), we estimated the number of deaths per LTCFs infection, which approximates the mortality rate, before and after vaccination.
Predicting change in probability of detected transmission in facilities
We analyzed the changes in detected transmission at the county level. We define a detected transmission occurrence, Oiw, as at least one COVID infection among nursing homes residents in county i for week w. We predict the probability of a transmission occurrence, πiw = P(Oiw), using the logistic regression model (model 3, eq.3).

Counties without any detected transmission during the pre-vaccination period (1 county) or without any weeks with no transmission (4 counties) were excluded from this analysis because of the inability to fit a logistic regression model with only one outcome class. To avoid overfitting, we calculated leave-one-out predictions during the pre-vaccination period and out-of-sample predictions for the vaccination period using a model trained in the pre-vaccination period. Then we computed the ratio of observed to predicted transmission events (denoted asTDw = Transmission − Deviationn (week w)) as an approximation of the vaccine effectiveness in fully preventing transmission.
To generate confidence intervals around our predictions, we calculated the sample standard deviation (σTD) of the pre-vaccination predictions (around a mean ≈1) and use the normal distribution confidence intervals. We believe this is reasonable because we are summing 36 (41 - 5 excluded counties) individual (non-normal) distributions, and by the central limit theorem this should be approximately normal. To estimate the proportion of documented transmission averted with 90% confidence intervals, we calculated 1 − TDw(1 − 1.645σTD − TDw, 1 + 1.645σTD − TDw).
All analysis was conducted using R 4.0.3 (https://www.R-project.org/).
Section S2. Predicting change in epidemic size across healthcare areas
Due to the high zero-inflation of documented infections LTCFs at the county level and the difficulty this provides for statistical modeling and inference, we predicted the epidemic size at a higher aggregate level, named “regió sanitaria” (herein healthcare area, n=9). For each area, we predicted LTCFs infections using model 1 and LTCFs deaths using model 2 (see methods). We followed the same procedures as described in the methods to obtain the prediction intervals.
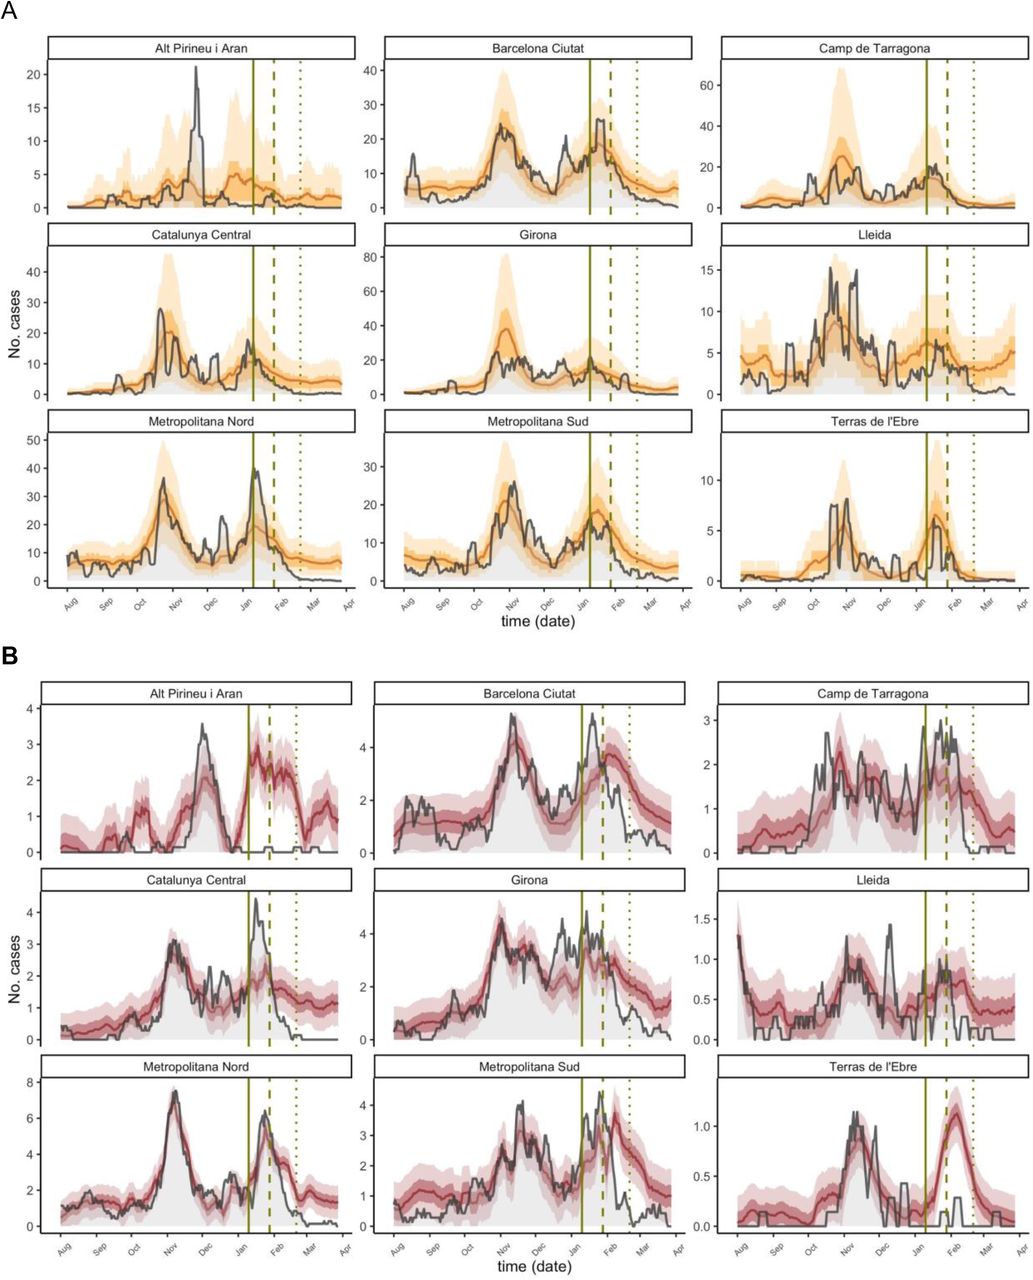
Consistent with the main analysis, healthcare area predictions showed lower-than-expected documented infections and deaths at a more granular level for both target periods of analysis, as seen in eFigure 1 A and B respectively. In 7 out of the 9 health areas the documented infections during the analysis period were consistently lower than the expected infections, and in the two areas where observed infections were higher (Barcelona Ciutat and Metropolitana Nord, among the most heavily populated) they became lower than expected in the final two weeks. Also, infections in Alt Pirineu i Aran become lower than expected around 1-2 weeks earlier than vaccine interventions and remain low for the target time periods, which likely reflect strong specific lockdown measures implemented there. Further, observed deaths were higher during the early analysis period (∼January) in 5 out of 9 healthcare areas (Barcelona ciutat, Camp de Tarragona, Catalunya Central, Girona, Metropolitana Sud), and later became significantly lower, consistent with the main analisis. Factors not considered in the model such as variation of mortality rates due to seasonality or spread of variants with higher lethality might have biased our estimates; in this case, the true number of prevented deaths and infections would be bigger than those estimated by our model. eTable 1 and 2 summarize the number of documented infections and deaths averted by each healthcare area for the two target periods described in the methods. Note that because we used a linear model to predict deaths, some of the predictions are negative, which we truncated at zero. Due to the granularity of the area-level and the greater uncertainty around both models’ predictions, many of the infections- and deaths-averted confidence intervals contain negative values, which would indicate an increase in either outcome. The locations with a greater population (Barcelona Ciutat and Metropolitana Nord) tend to have smaller confidence intervals because their greater population size yields more stable outcome values. While the area-level confidence intervals are wide, when we look at Catalonia as a whole (as in our main analysis) we see a more certain effect of vaccines.

The grey lines are the observed documented infections (A) and deaths (B) and the yellow and red lines are the predicted infections, with ribbons for the IQR and 90% PI. Vertical lines show key analysis time points: when vaccination started (solid), when 70% of residents received the first dose and when 70% of residents received the second dose. Negative predictions are truncated and plotted as 0 for consistency.
Number of predicted averted cases in all of Catalon and in each healthcare area. All values are cumulative estimates of cases averted between the starting dates, Jan 14, 2021 and Feb 6, 2021, and March 28, 2021. The 90% confidence intervals are the sums of the bounds of the daily 90% prediction intervals, so they are likely wider than in reality. Negative confidence interval values (indicating higher-than-expected cases) are truncated at 0.
Similar to TableS1, but for deaths averted.
Section S3. Estimating changes in the fatality rates
As sensitivity, we predicted the number of LTCFs deaths from LTCFs documented infections using the model 4 (eq. 5) in Catalonia.

This is a proxy for the fatality rate per infection. Interestingly, the fatality rates seem to increase in January (Figure S2) after vaccines are first delivered and decrease after later on, which could explain the excess of deaths observed in the main analysis compared to those predicted from community infections.

The grey lines are the documented deaths, and the brown lines are the predicted deaths, with ribbons for the 50%PI and 90% PI. Vertical lines show key analysis time points: when vaccination started (solid), when 70% of residents received the first dose and when 70% of residents received the second dose.
Section S4. Percent Errors for Documented Infections and Death Models
As sensitivity we computed the percent error over time for documented infections (model 1, eq 1) and deaths (model 2, eq 2). As shown in Figure S3 the trend consistently increased toward negative values after vaccination started. For both events, the deviation predictions vs observations during the target time period Feb 6-March 28 becomes close to −100%.

Solid lines represent daily percentage error for documented infections (A) and death model (B). Grey color is used for the training time period pre vaccination and orange and red once vaccination started. Vertical lines show key analysis time points: when vaccination started (solid), when 70% of residents received the first dose and when 70% of residents received the second dose.
Acknowledgements
We thank Rebecca Kahn, Cristina Colls-Guerra and Antoni Plasencia for their technical advice.


