
Abstract
Worldwide governments have rapidly deployed non-pharmaceutical interventions (NPIs) to mitigate the COVID-19 pandemic, together with the large-scale rollout of vaccines since late 2020. However, the effect of these individual NPI and vaccination measures across space and time has not been sufficiently explored. By the decay ratio in the suppression of COVID-19 infections, we investigated the performance of different NPIs across waves in 133 countries, and their integration with vaccine rollouts in 63 countries as of 25 March 2021. The most effective NPIs were gathering restrictions (contributing 27.83% in the infection rate reductions), facial coverings (16.79%) and school closures (10.08%) in the first wave, and changed to facial coverings (30.04%), gathering restrictions (17.51%) and international travel restrictions (9.22%) in the second wave. The impact of NPIs had obvious spatiotemporal variations across countries by waves before vaccine rollouts, with facial coverings being one of the most effective measures consistently. Vaccinations had gradually contributed to the suppression of COVID-19 transmission, from 0.71% and 0.86% within 15 days and 30 days since Day 12 after vaccination, to 1.23% as of 25 March 2021, while NPIs still dominated the pandemic mitigation. Our findings have important implications for continued tailoring of integrated NPI or NPI-vaccination strategies against future COVID-19 waves or similar infectious diseases.
Main
As of 30 March 2021, the COVID-19 pandemic has spread worldwide, causing over 127 million confirmed cases and 2.8 million deaths1. Non-pharmaceutical interventions (NPIs) have been deployed across the world to curb the pandemic2. With the rollout of COVID-19 vaccine using different dosing and population targeting strategies3, robust vaccination programs will enable the relaxation of NPIs4,5. However, given the delays in vaccine production and the inequality of vaccine allocations as well as the emergence of novel variants6,7, NPIs should be maintained to avoid further resurgences before herd immunity can be achieved4. It is critical to understand the role of different NPIs and initial vaccination efforts to reduce COVID-19 transmission, before and after vaccine rollouts, thereby tailoring effective and integrated NPI-vaccination strategies for future COVID-19 waves.
The effectiveness of NPIs on pandemic mitigation had been shown by previous studies that mostly focused on the first wave of the pandemic before July 20205,8-12, with limited analysis of subsequent waves, regional diversity and integrated NPI-vaccination efforts. The implementation of NPIs in the first wave had, to some degree, changed human knowledge and perceptions, behaviours and responses to mitigate the outbreaks13-17. Whether NPI effectiveness increases with adherence or decreases with fatigue in the subsequent waves remains unclear. Additionally, the effects of NPIs may vary across countries with different country characteristics, such as health capacity, residential population density, aging ratio, humidity and air temperature18,19. The potential differences in NPI effectiveness across continents are rarely discussed in existing global analyses12. Moreover, vaccination is the most promising approach to lead the way out from this pandemic. However, the uneven distribution and allocation of vaccine rollout among countries and population groups might hinder the way to herd immunity20. Modelling studies have been conducted to simulate the combining effects of vaccination and NPIs for COVID-19 under various scenarios5,21,22. However, it is critically needed to understand how vaccination integrated with NPIs reduces COVID-19 transmission in the real world since the rollout of vaccines across multiple nations.
In this study we estimated the effects of individual NPIs and vaccination by identifying their contributions to the decay ratio of COVID-19 infections across waves and countries after the implementation of these measures. We used databases of global comparable outcomes, covering epidemiological23, intervention policy24, environmental and demographic data in 133 countries, territories and areas, from the earliest available dates to 25 March 2021. The deployment time and intensity of seven NPIs, including school closures, workplace closures, gathering restrictions, movement restrictions, public transport closures, international travel restrictions, and facial coverings, were considered in the data processing. We defined epidemic waves, mainly focusing on the first and second waves, according to the daily number of new confirmed cases reported and the changing pandemic situations in corresponding countries (see Methods and supplementary information [SI]). We also divided the 133 territories into four country groups, according to their geographical proximity, morbidity and mortality, implicitly related testing rate, to compare the regional variations in NPI efficacy. Data on vaccine rollouts25 in 63 countries from 8 December 2020 to 25 March 2021 were also collated to assess the integrated impact of vaccination and non-pharmaceutical policy on COVID-19. More details can be found in Methods and SI.
Spatiotemporal Bayesian inference model to assess effects of NPIs and vaccination
A Bayesian inference model10,15 was built to disentangle the individual effects of NPIs and vaccination by measuring their relative contributions on the decay ratio of COVID-19 infections (denoted as %Δω t), in the presence, absence and intensity change of these interventions. The decay ratio was defined as a percentage of reduction in the baseline growth rate by the instantaneous growth rate. In addition to interventions, there were many other factors (e.g., the transmissibility of new variants and the variation of case diagnosis and reporting) that might affect the transmission of COVID-19 over time. Therefore, the baseline growth rates in different waves and countries were assumed as the mean of the top three highest instantaneous, weekly growth rates in the corresponding wave and country. The instantaneous growth rate of transmission at each point of time was calculated as the current weekly number of new infections over the infections in the previous week. We used the decay ratio directly derived from the reported case data, rather than the reproduction number (Rt)10,12, to avoid introducing the uncertainty of estimating Rt over time26. It should be noted that we estimated the relative effects of individual measures, while their combined effectiveness should be higher than individual effects, but not linearly accumulated (see Method).
We modelled NPI effects over time without assuming a functional relationship between effectiveness over time, which allows for variable community responses to the variation of each intervention. The effects of each NPI and vaccination with same intensity were assumed to be constant across countries in our model for each single estimation, and then decomposed for each country and week according to the corresponding decay ratio, intervention timing and intensity. The NPI with different intensities was modelled by the same effect parameter. The spatial variations in NPI and vaccination effectiveness across countries were controlled by employing the country-specific characteristics, including health capacity, residential population density, aging ratio, humidity and air temperature. All the estimations were performed by Markov chain Monte Carlo (MCMC). The reliability of our model was assessed by the cross-validation for overall intervention effects. Sensitivity analyses were also performed to assess model robustness in terms of our assumptions. More details on models and covariates can be found in Methods and SI.
Global impact of individual NPIs across waves
We estimated that three NPIs had substantial effects (>10%) on mitigating COVID-19 transmission in general (Fig. 1), including facial coverings (median 24.93%, interquartile range [IQR] 24.10 - 25.75%), gathering restrictions (24.01%, 22.38 - 25.65%) and international travel restrictions (11.23%, 9.93 - 12.56%). The effect of school closures (5.53%, 3.60 - 7.23%) performed moderately (1 - 10%) among all the seven NPIs, whereas workplace closures, public transport closures and movement restrictions had limited efficacy (<1%).
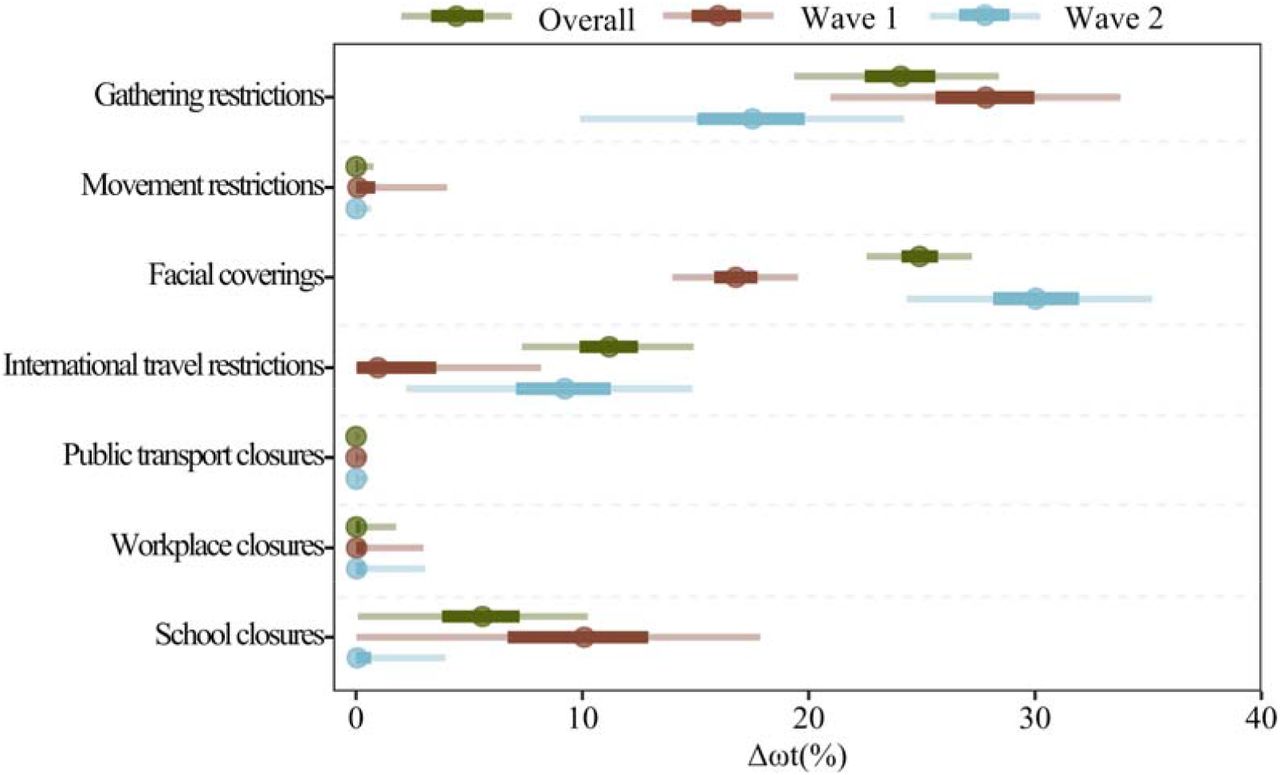
The overall effect represents the average performance of NPIs against COVID-19 in 133 countries (Fig. 2) by 25 March 2021 or the last dates before vaccination. Wave 1 refers to the average performance of NPIs against COVID-19 in the first wave of the 133 countries. The specific period of the first wave in each of 133 countries is not the same, indicating Wave 1 does not refer to a particular time but the general period of the first outbreak. Wave 2 refers to the effects in the second wave. %Δωt represents the decay ratio in the COVID-19 infection rate in 133 studied countries, territories and areas. The 5th, 25th (Q1), 50th (median), 75th (Q3), and 95th percentiles of estimates are presented, respectively. The uncertainty intervals of NPI effectiveness refer to the variance over the corresponding data context.
The efficacy of NPIs varied across waves. In the first wave, the most effective NPIs were gathering restrictions (median 27.83%, IQR 25.60 - 29.97%), facial coverings (16.78%, 15.82 - 17.74%), and school closures (10.08%, 6.70 - 12.91%). In the second wave, the efficacy of facial coverings surged to be the top-ranked one (30.04%, 28.14 - 31.94%). Another significant rise was the effect of international travel restrictions, from limited in Wave 1 (0.96%, 0.03 - 3.55%) to moderate in Wave 2 (9.22%, 7.07 - 11.25%). Meanwhile, the effects of gathering restrictions and school closures declined to 17.51% (IQR 15.08 - 19.82%) and 0.06% (0.00 - 0.67%) in the second wave, respectively. In both waves, workplace closures, public transport restrictions and movement restrictions presented limited effects (< 1%) in reducing the transmission.
Effectiveness of NPIs across countries by wave
Our analyses also revealed that the impact of individual non-pharmaceutical measures had obvious spatiotemporal variations across countries by waves before vaccine rollouts (Fig. 2).
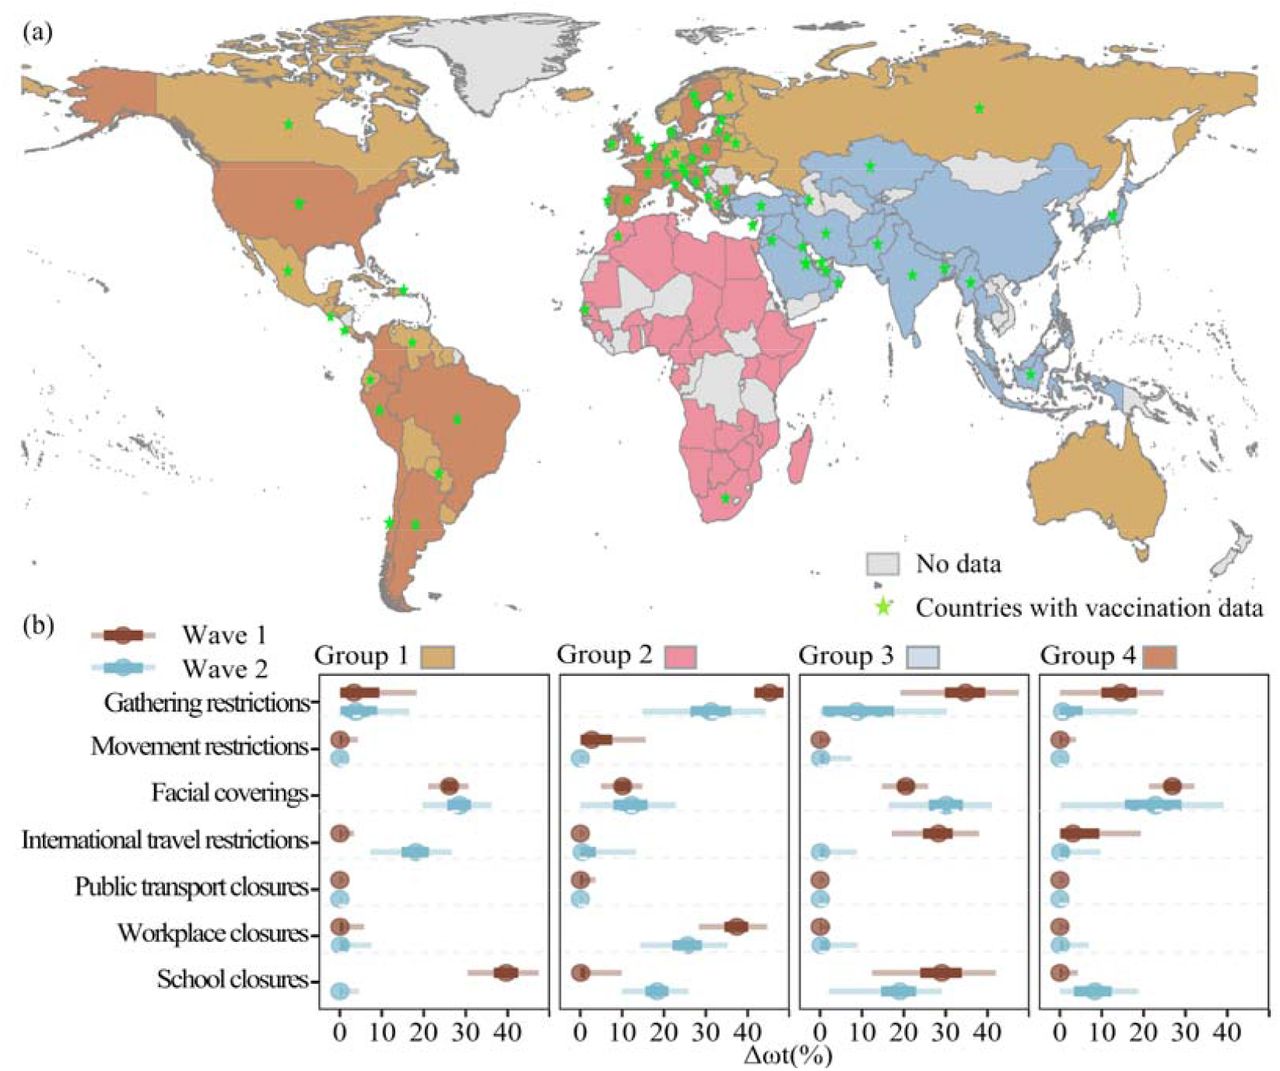
(a) Country groupings, as determined by pandemic parameters and geographic proximity (see SI for more information). Countries with vaccination data in this study are marked by the green stars. (b) Effects of individual NPIs on reducing the transmission of COVID-19 across waves and groups. %Δωt represents the decay ratio in COVID-19 infection rate. The 5th, 25th (Q1), 50th (median), 75th (Q3), and 95th percentiles of estimates are presented, respectively. The uncertainty intervals of NPI effectiveness refer to the variance over the corresponding spatiotemporal extent. A full list of countries and the corresponding time frames of different waves for each group can be found in SI Table C2 – C5.
The countries in Group 1 and Group 2 were predominantly comprised of European, American, and Oceanian countries with relatively low and high morbidity and mortality, respectively. Facial coverings had an important role in reducing transmission in both groups and waves (%Δωt >10%). Gathering restrictions and workplace closures had substantial effects in both waves in Group 2, but only played moderate and limited roles, respectively, in Group 1 for both waves. School closures were the most effective NPI in the first wave in Group 1 (39.65%, 36.67 - 42.50%) but had limited effects in the second wave (0.03%, 0.00 - 0.50%). The opposite happened in Group 2, from 0.10% (0.00 - 1.19%) in Wave 1 to 18.36% (15.54 - 21.09%) in Wave 2. International travel restrictions and movement restrictions solely affected the pandemic transmission of Group 1 in the second wave (18.15%, 14.68 - 21.25%) and Group 2 in the first wave (2.74%, 0.10 - 7.67%), respectively. In other cases, their influences were limited. The effectiveness of public transport closures was below 1% in both groups among both waves.
Asian countries formed Group 3. Facial coverings and school closes had substantial impacts in both waves. The former’s effect increased from 20.53% (IQR 18.58 - 22.40%) to 30.13% (25.94 - 34.13%), while the latter declined from 29.08% (23.94 - 33.88%) to 19.06% (14.55 - 22.95%). The other two effective, with declined effectiveness, NPIs were gathering restrictions (from 34.80% to 8.78%) and international travel controls (from 28.13% to 0.10%). Workplace closures, public transport closures and movement restrictions were limited effective in both waves.
Group 4 countries included mostly African countries, whose effective NPIs were similar to Group 1 and Group 3. Facial coverings were the only NPIs that had substantial effectiveness among both waves ((26.86%, 24.98 - 31.79) and (22.84%, 15.51 - 29.06%)). Gathering restrictions (15.58%, 9.91 - 18.35%) and international travel restrictions (3.11%, 0.08 - 9.42%) prevented the COVID-19 transmission in the first wave, while school closures (8.35%, 3.32 - 12.39%) showed moderate effects in Wave 2. The remaining three NPIs, including workplace closures, public transport closures, and movement restrictions had limited effects (< 1%) in both waves.
Effect of integrated COVID-19 vaccination and NPIs
We compared the effects of NPIs and the first-dose COVID-19 vaccination in 63 countries (Fig. 2a; listed in SI Table A2), from 8 December 2020 to 25 March 2021. Our results showed, the overall short-term effect of vaccination has been cumulatively rising with the increasing total vaccinated populations over time (averagely 5.1% population vaccinated by 25 March 2021 in the 63 study countries). The early impact of vaccination on reducing infections was only 0.71% (IQR 0.02 - 2.84%) within 27 days after vaccination (i.e. half a month since Day 12 after vaccination), given the induced antibody response and immunity might sufficiently prevent COVID-19 infections since the 12th day after receiving the first-dose vaccine27. However, the accumulative effectiveness slightly rose to 0.86% (0.57 - 3.26%) within 42 days after vaccination (i.e., a month since Day 12 after vaccination), and 1.23% (0.09 - 2.8%) by 25 March 2021. In the country - Israel - with the highest vaccinated population ratio (53.14%), the short-term effectiveness of vaccination had contributed to 8.62% (7.06 - 13.8%) in reducing COVID-19 transmission, as of 25 March 2021.
Nevertheless, at the early stage of the vaccination era, NPIs remained important and predominant for mitigating COVID-19 pandemic before most populations were infected or effectively vaccinated. In these countries with vaccine rollouts, gathering restrictions contributed to 39.62% (IQR 25.73 - 46.70%) of the suppression in infections, followed by international travel restrictions 15.38% (0.59 - 26.81%) and workplace closure 6.78% (0.58 – 22.79%) by 25 March 2021 (Fig. 3).

%Δωt represents the decay ratio in the suppression of COVID-19 infection rate. For 63 countries with vaccination data, effects of NPIs and the vaccination were evaluated for three periods, within 15 days and 30 days since the 12th day after vaccination and by 25 March 2021, as the induced antibody response and immunity may sufficiently prevent COVID-19 infections since Day 12 after receiving the first-dose vaccine27. The uncertainty intervals of NPIs and vaccination effectiveness refer to the variance over the corresponding period in the 63 countries.
Discussion
Based on longitudinal public health interventions and socio-demographic datasets across COVID-19 waves, our study revealed that NPI measures played important roles in mitigating the pandemic, with varied effects across waves and regions. The most effective NPIs were gathering restrictions, facial coverings and school closures in the first wave, which switched to facial coverings, gathering restrictions and international travel restrictions in the second wave. The effectiveness of facial coverings was statistically significant in both waves of four groups. Since the vaccine rollout, vaccinations have gradually contributed to the suppression of COVID-19 transmission, but NPIs still dominated the pandemic mitigation as of 25 March 2021. Our results presented NPI effectiveness along both spatial and temporal scales, and this study was the first impact assessment of integrating worldwide COVID-19 interventions and the vaccination in the real world, to our knowledge. These findings are crucial for continued tailoring and implementation of NPI strategies to mitigate COVID-19 transmission among future waves (e.g., as a result of new variants) or similar emerging infectious diseases, such as pandemic influenza.
Preliminary data showed vaccines could significantly reduce the severity of infections in older people28, and our results also showed that vaccines have an increasing effect to reduce SARS-CoV-2 transmission in the whole population, while vaccination alone was still insufficient to fully contain the coronavirus spread, for the time being, considering the vaccinated population ratio in most countries below 10% by 25 March 2021. Mass vaccination is needed to confer broad protection to the coronavirus, through reducing the unevenness of vaccine distribution among regions and groups20. However, the efficacy of vaccines and herd immunity might be undermined due to the emergence of new variants of SARS-CoV-2, the wane of infection-associated immunity over time, and the changing attitudes and behaviours on vaccination, even with vaccine roll-out in full force20. Therefore, it is necessary to maintain the implementation of target and effective NPIs and closely monitor the changing efficacy of NPIs and vaccines across waves and countries for local intervention design.
We found that gathering restrictions and facial coverings significantly changed the pandemic trajectory in both waves, and gathering restrictions include both gathering cancellation29 and closure of non-essential businesses30-32. The significant effects of these measures might be due to the virus most commonly spread through droplets or aerosols among people who were in close contact33. In contrast, public transport closures, movement restrictions, and workplace closures presented limited or moderate effects in both waves. Travel patterns have been significantly affected by the pandemic, causing a reduction in public transport usage34. Besides, facial coverings on public transport were required by numerous governments, which might reduce the risks of infection35. The decreasing usage of public transit and increasing personal protection measures might jointly explain the minor impact of public transport closures in both waves. The effect of movement restrictions contributed by both stay-at-home orders and internal movement restrictions in our study. The impact of movement restrictions, especially lockdowns, varied across previous studies, ranging from little effect36 to as much as an 80% reduction in Rt10. Because lockdowns inherently encompass all other NPIs by definition, this might pose a problem for determining efficacy among NPI strategies alone33. Our study might underestimate the impact of movement restrictions and workplace closures due to differences in the timing, intensity, and combination of interventions (SI Fig. A3).
The effectiveness of school closures and international travel restrictions fluctuated in the two waves. School closures played an important role in the first wave epidemic mitigation, but not in the second one. School holidays were identified and corresponded to the highest intensity of school closures in both waves. In the second wave, education was primarily guaranteed in many countries like the United Kingdom and other European countries. Besides, health safety measures, including facial coverings and social distancing, were introduced by schools to adhere to. Due to the protection of other intervention measures, school closures might be avoided in the following waves of the pandemic. Contrary to the school closures, international travel restrictions had a relatively minor effect in the first wave but seemed important in the second wave (Fig. 1). Countries that quickly placed border controls might have reduced the seeding of the coronavirus between countries, but international travel restrictions cannot prevent local transmission at the community level in countries where the virus had already been introduced37,38. Previous models suggest that unless community-level transmission is reduced by no less than 50%, a reduction in 90% of international travel to and from epidemic centres might only modestly affect the epidemic trajectory39. The small effect of international travel restrictions in the first wave might be explained by the late implementation of this measure across countries. The increasing role of international travel restrictions observed in this study might be also due to increasing control efforts at community level which occurred during the second wave.
After controlling for local contextual confounders in our models, we observed variations in the efficacy of interventions across regions. In this study, we divided 133 countries into four groups based on mortality and morbidity, which were implicitly related to testing rate due to the highly correlation (see SI Table C1). Regardless, socio-economic, cultural and political characteristics could also affect the implementation and effectiveness of NPIs locally33. For example, workplace closures and gathering restrictions might have been implemented more thoroughly in countries with high morbidity and mortality such as Group 2, thereby increasing their efficacy as compared to countries in Group 1. Here we presented the overall trend of the group, not excluding individual countries such as the United States that had fragmented approaches and no NPIs were implemented very effectively (at least from the policy level).
We acknowledge that there are limitations in our analysis. First, we mainly focused on the comparison of NPIs for the first and second waves, as only a small number of countries had experienced the third wave by 25 March 2021 and the most recent wave might involve NPIs together with vaccination. To evaluate the pure effects of NPIs independent of vaccination, we excluded the dates with vaccination in the first and second waves. Meanwhile, the preliminary results of NPI effects in the third wave for a small group of countries are also provided in SI. Second, it should be noted that our study might have underestimated the effectiveness of the vaccination, as we only examined the initial, short-term effect of the first-dose vaccines as of 25 March, but vaccine and infection-induced immunity among populations could last longer, with accumulated long-term effects for reducing transmission. Additionally, some countries/populations have had the second-dose vaccine rollout, which was not estimated in our study, though the proportion of people vaccinated with two doses might be still low.
Overall, the disclosure of epidemic, publicized responses and the COVID-19 vaccination data allows us to estimate and compare the cross-wave effects of public health measures at both global and regional scales. Our work provides a quantitative basis and approach to explore historic spatial-temporal variation in the effectiveness of individual NPIs, integrating vaccinations. The continued pandemic burden across the globe and the non-decisive efficacy of the vaccination suggests the NPI implementation continues to be a priority for many countries, even with a full force vaccine rollout in the early stage of the vaccination era5,20,40.
Methods
Data sources and processing
Epidemiological data
The daily number of confirmed cases reported by country were obtained from the COVID-19 Data Repository by the Center for Systems Science and Engineering (CSSE) at Johns Hopkins University (JHU)23. To remove the influence of outliers and the fluctuation caused by the day-of-week effect, we smoothed daily case counts with the Gaussian kernel and adjusted them for the infection-to-confirmation reporting delay then. First, we set all negative case numbers to zero, as negative values in cases could sometimes appear when a country corrected historical data, because it had previously overestimated the number of cases41. Second, we smoothed case data by calculating the rolling average using a Gaussian window with a standard deviation of 2 days, truncated at a maximum window of 15 days29. Third, we adjusted the data by subtracting 12 days15 from the reporting date in the first wave, accounting for the delay from infection to reporting. With respect to the second, even the third, wave, we slightly reduced the reporting delay to 10 days because of the potential increasing testing and diagnosis capacity. Sensitivity analyses were also conducted to assess the impact of different reporting delays on our estimates (see sensitivity analysis section in Methods).
Intervention policy data
We generated seven non-pharmaceutical measures from the nine NPIs (i.e. school closures, workplace closures, public events cancellations, gathering restrictions, public transport closures, stay-at-home orders, internal movement restrictions, international travel restrictions, and facial coverings), collated by the Oxford COVID-19 Government Response Tracker (OxCGRT)24. The intensity of the nine considered NPIs policies is scaled into discrete values between 0 to 1, where 0 represents an absence of the NPI and 1 represents the corresponding maximum intensity. The intensity of school closures is corrected as 1 during public and school holidays42. We processed public events cancellations and gathering restrictions into a single NPI (i.e., gathering restrictions) for each country in each day by their mean intensity, as the two NPIs documented in OxCGRT were highly collinear in terms of their timing and intensity of implementation across the 133 study countries. We also integrated stay-at-home orders and internal movement restrictions into movement restrictions for the same reason in the same way for each country.
Vaccination data
The COVID-19 vaccination data used in this study was obtained from the Our World in Data25. They regularly updated the first and second doses administered and daily vaccination rates at national scale from official sources in 93 countries as of 25 March 2021. We analysed the vaccination effect in 63 countries whose highest daily confirmed cases exceeded 100. The induced antibody response and immunity might sufficiently prevent SARS-CoV-2 infections since Day 12 after receiving the first dose27. Therefore, we adjusted the vaccination rates for the first dose administered to be rolled forward for 12 days, to account for the delay from vaccination to the generation of sufficient protective immunity.
Environmental and demographic covariates
To control for country-specific confounders in the estimates of intervention effectiveness varied across countries, we also assembled population density, aging ratio, health capacity index, air temperature, and humidity for all these 133 study countries. Within each country, population density (per square kilometre) was the ratio of the total population over the corresponding built-up area in 201443. The total and age-grouping population data in 2019 were obtained from the United Nations to calculate the aging ratio (> 65 year old) among populations 44. Health capacity index was the arithmetic average of the five indices, including i) prevent, ii) detect, iii) respond, iv) enabling function, and v) operational readiness, developed to characterize the health security capacities in the context of the COVID-19 outbreak45. Air temperature and humidity were derived from the Global Land Data Assimilation System 46.
To further remove the day-of-week effect among case testing, diagnosis, and data reporting, all data used in this study were assembled and aggregated into a weekly dataset. The correlations between each two covariates were given to show their collinearity. The studied countries were selected by being documented in every dataset of epidemiological data, intervention policy data and environmental and demographic covariates. The details of data collection and processing are further provided in the Supplementary Information.
Defining waves and country groups
Waves
The inequality in pandemic development across worldwide countries has led some countries to confront more than one COVID-19 wave47,48. Based on the smoothed daily case data, we defined an epidemic wave in each country as below. In a period of three or more consecutive weeks for a country, if the daily numbers of cases in this period all exceeded 5% of the maximum daily number of cases in 2020 in this country, these weeks were considered to constitute an epidemic wave. The first and last days of the period were the start and end of the corresponding wave, respectively. However, considering that the first wave of this pandemic in most countries started from low-level community transmission caused by imported cases, we adjusted the start date of the first wave to the first date: i) when the number of daily cases exceeded 10 cases, for countries where the maximum number of daily new cases in the first wave were less than or equal to 300 cases; or ii) when the number of daily cases exceeded 20 cases, for other countries where their maximum daily cases in the first wave were greater than 300 cases. The details and full lists of waves by country can be found in SI. We focused on the first and second waves in the main text, and the results of the third waves that were only identified in a few countries are provided in SI.
Regional stratification
The reported COVID-19 morbidity and mortality could vary substantially in the study countries, based on the released epidemiological data. We investigated the spatial variation in NPIs effectiveness by dividing 133 countries into four country groups based on their COVID-19 morbidity and mortality together with geographical proximity (SI Fig. C2). Among the four groups, the grading thresholds for high morbidity and mortality were determined according to the principle of “small variance within groups and large variance between groups”49,50. Thresholds of 1800 per 100,000 persons for morbidity and 40 per 100,000 persons for mortality were chosen to select countries with both high morbidity and high mortality. Considering the geographical proximity between countries, Asian countries and African countries were assigned into two separate groups. A full list of countries in each group and the corresponding time frame of different waves of COVID-19 can be found in SI Table C2 – C5.
Model description
Transmission dynamics
The evolution of the COVID-19 in a society can be characterized by  , where I represents the new cases, and ωt is the instantaneous growth rate. We adopted a general linear formula9,10,37 linking NPIs to the pandemic evolution. That is,
 where ω0 represents the baseline growth rate without interventions. αi,t is the correlation between ω0 and ωt in terms of NPIs policy βj,t (visualized in SI Fig A3) on day t, and n is the number of NPIs. βj,t is the correlation between ω0 and ωt in terms of sociodemographic factors yj,t, and m is the number of control variables. τt is the correlation between ω0 and ωt in terms of vaccination vt, and εt is the error term representing the uncertainty of decay ratio at day t. The effect of NPI xi in a period, such as the first wave of the pandemic, can be interpreted as a decay ratio in ω0 by computing
  , where αi is the effect parameter and
  is the average intensity of the NPI during that period. The highest effect of NPIs is 1, representing that the transmission is fully contained or interrupted. In contrast, the effect of vaccination is calculated by 1 − exp (−τmax(Vt)), ranged from 0 to 1 also with 1 representing that the transmission is fully contained or interrupted by vaccination. It should be noted that the combined NPIs effectiveness on day t should be calculated as 1 − exp (−∑i αixi,t)= 1 − Πi(1 − ei), instead of the sum of individual NPI effects.
Assessing the effects of interventions
We used the spatiotemporal Bayesian inference model to evaluate the effect parameters in Eq. (1) based on the observed real-time COVID-19 growth, identifying the relative NPIs and vaccination effectiveness. We assumed that the effects of NPIs on ωt change across waves and country groups, but relatively stable for countries within the same group. The differences in NPIs effectiveness across country groups were assumed to be too large to be controlled by sociodemographic factors. We first evaluated the overall effectiveness of NPIs before the vaccination era. In addition to the overall NPIs effectiveness, we also evaluated respective NPIs effects in the first and second waves for each country group separately to show the potential large spatiotemporal diversity. For vaccination, we evaluated NPIs and vaccination effects for 63 countries regardless of their country groups. We also evaluated vaccination effects within different time periods after vaccinations as of 25 March 2021 to show cumulative effects of vaccine rollouts over time.
We aimed to compare relative effectiveness of COVID-19 interventions across countries and across waves. Specifically, the effect parameters were all pre-defined to have a gamma distribution9 in spite of NPIs, sociodemographic factors and vaccination. Then, we placed 80% of their probability mass on positive effects for both NPIs and vaccination by left shifting their probability distributions with certain values10. While we put no information on effectiveness of sociodemographic factors, i.e., placing 50% of their probability mass on positive effects. Under the circumstance, NPIs and vaccination were more likely to contain the pandemic, while the state-variable effects were unknown. The baseline growth rate (ω0) was defined as the mean of the top three highest growth rates of the confirmed COVID-19 new cases in the corresponding wave. The instantaneous transmission interval (1/ωt) in the following weeks was assumed to have a gamma distribution also.
Model validation
The reliability of our models and corresponding results were evaluated by the leave-forty-countries-out cross validation. We first calibrated our model using 70% countries (93), randomly selected from 133 countries, to estimate the overall NPIs effects in both the first and second waves. Then, we derived the instantaneous growth rates through the estimated NPIs overall effects for the remaining 30% countries (40) in terms of their implemented NPIs. We used mean square error, ranging from 0 to infinite with 0 represents the perfect prediction ability, to assess the difference between the predicted instantaneous growth rates and the corresponding empirical instantaneous growth rates. We repeated this procedure 50 times, where the average mean square error was (median 1.002, interquartile range [IQR] 0.519 – 1.209). Further, we standardised the predicted and empirical instantaneous growth rates, respectively, within each country and then analysed all the data with one-way ANOVA.
Sensitivity analysis
The robustness of models and parameters used in the study was also assessed by a series of sensitivity analyses. The parameters to be assessed included: i) the probability mass of NPIs and vaccination on negative effectiveness; ii) the probability mass of sociodemographic factors on negative effectiveness; and iii) the infection-to-report delay in the first wave (t1) and the second wave (t2). In this study, the default values for these parameters were 20%, 50% and t1=12 and t2=10, respectively. The comparison of parameter impacts on estimates were listed in SI Table B1, representing three scenarios with smaller and larger default parameter settings. The differences of NPI effects among three waves were tested using a Wilcoxon signed-rank test, a non-parametric statistical hypothesis test for comparing NPIs effects between pairs of the three waves. Moreover, we repeated the estimations twice for NPIs effectiveness with default setting, except for the initial full infection rate, as the highest growth rate and the mean of the top five highest growth rates, respectively, of the confirmed COVID-19 new cases in the corresponding wave.
Using an R package, rstan51, this model infers posterior distributions of each NPI effectiveness with the Markov chain Monte Carlo (MCMC) sampling algorithm. To analyse the extent to which modelling assumptions affect the results, our sensitivity analyses included epidemiological parameters, prior distributions, and the structural assumptions introduced above. MCMC convergence statistics are shown in SI Fig. B6 - B7.
Data and code availability
All source code and data necessary for the replication of our results and figures are available at: https://github.com/wxl1379457192/NPIs_code
Data Availability
All source code and data necessary for the replication of our results and figures are available at: https://github.com/wxl1379457192/NPIs_code
Author contributions
YG, WBZ, HYL, WY, CWR and SJL conceived and designed the study, built the model, collected data, finalised the analysis, interpreted the findings, and wrote the manuscript. MGH, XLW, YZS and MXL collected data, interpreted the findings, and revised drafts of the manuscript. NWR, LF, ZJL, WZY and AJT interpreted the findings, and commented on and revised drafts of the manuscript. All authors read and approved the final manuscript.
Ethical approval
Ethical clearance for collecting and using secondary data in this study was granted by the institutional review board of the University of Southampton (No. 61865). All data were supplied and analysed in an anonymous format, without access to personal identifying information.
Role of the funding source
The funder of the study had no role in study design, data collection, data analysis, data interpretation, or writing of the report. The corresponding authors had full access to all the data in the study and had final responsibility for the decision to submit for publication. The views expressed in this article are those of the authors and do not represent any official policy.
Competing interests
The authors declare no competing interests.
Acknowledgments
This study was supported by the National Natural Science Foundation for Distinguished Young Scholars of China (No. 41725006), the Bill & Melinda Gates Foundation (INV-024911 and OPP1134076), the National Natural Science Foundation of China (81773498), and Beijing Natural Science Foundation (Grant No.7212128).
Reference


