
Abstract
In India, households’ use of primary health-care services presents a puzzle. Even though most private health-care providers have no formal medical qualifications, a significant fraction of households use fee-charging private health-care services, which are not covered by insurance. Although the absence of public health-care providers could partially explain the high use of the private sector, this cannot be the only explanation. The private share of health-care use is even higher in markets where qualified doctors offer free care through public clinics; despite this free service, the majority of health-care visits are made to providers with no formal medical qualifications. This paper examines the reasons for the existence of this puzzle in India. Combining contemporary household-level data with archival records, I examine the aggressive family planning program implemented during the emergency rule in the 1970s and explore whether the coercion, disinformation, and carelessness involved in implementing the program could partly explain the puzzle. Exploiting the timing of the emergency rule, state-level variation in the number of sterilizations, and an instrumental variable approach, I show that the states heavily affected by the sterilization policy have a lower level of public health-care usage today. I demonstrate the mechanism for this practice by showing that the states heavily affected by forced sterilizations have a lower level of confidence in government hospitals and doctors and a higher level of confidence in private hospitals and doctors in providing good treatment.
JEL Codes I11, N35, I12, J13
1. Introduction
In India, households’ use of primary health-care services presents a puzzle.1 The puzzle is as follows. First, a significant fraction of households uses fee-charging private health-care services, which are not covered by insurance (CPR 2011; International Institute for Population Sciences (IIPS) 2017; Peters et al. 2002).2 Second, major portions of private health-care providers have no formal medical qualifications (Rohde and Viswanathan 1995; Banerjee, Deaton, and Duflo 2004).3 Although public health-care providers are more qualified and offer free services, they have only around 20% of the market share (Muralidharan et al., n.d.).4 Third, while the absence of public health-care facilities or personnel could partly explain the high use of the private sector, this cannot be the only explanation. The private share of health-care use is higher even in markets where qualified doctors offer free care in public hospitals; despite this service, the majority of health-care visits are made to providers with no formal medical qualifications (Das, Holla, et al. 2016). Fourth, within India, there is a considerable variation in the types of health-care usage across states (Peters et al. 2002; Muralidharan et al., n.d.). Why does this paradoxical situation exist in India?
This paper examines a plausible reason for the existence of such a paradox. In particular, I question whether the current practice of health-care use in India has historical routes. Combining contemporary household-level data with archival records, I examine the aggressive family planning program implemented in India during the emergency rule in the 1970s and explore whether the coercion, disinformation, and carelessness involved in implementing the program could partly explain the puzzle.
India experienced a brief period of autocratic rule between June 1975 and January 1977.5 This period, popularly known as “the emergency,” which was proclaimed by then Prime Minister Indira Gandhi under the Indian constitution, suspended a wide range of civil liberties. A unique policy that affected the general population during this period was the introduction of an aggressive family planning program through forced sterilization.6 The policy—implemented in April 1976— led to a sharp increase in the number of sterilizations (see Figure 1). About 8.3 million sterilizations were performed in a single year between April 1976 and March 1977, more than three times the previous year’s figure. Historical records, court rulings, and anecdotal evidence suggest that these sterilization targets were accomplished through incentives and disincentives, coercion, disinformation, carelessness, and fear (Shah Commission of Inquiry 1978; Panandiker, Bishnoi, and Sharma 1978).

I hypothesize that the forced sterilization policy may have had unintended effects on future health-care usage in India. There are genuine reasons to believe that the policy could have unintended consequences. First, all sterilizations, mostly administered through coercion and disincentives, were performed by government doctors in public hospitals or temporary sterilization camps established by the government. Due to increased pressure, targets to meet, and carelessness, no aftercare was administered, which sometimes led to serious side effects, including death. According to the report published by the Indian Government, 1,778 complaints of deaths related to sterilization were registered. Second, false information was delivered by public health-care workers to motivate individuals to be sterilized. In a survey of four Indian states (Bihar, Madhya Pradesh, Punjab, and Uttar Pradesh) during the forced sterilization period, Panandiker, Bishnoi, and Sharma (1978) summarize the types of disinformation provided to motivate sterilization acceptors:
What was often told was that sterilization, vasectomy or tubectomy, is a simple, quick and safe operation which stops child birth permanently… To the more circumspect of the prospective clients, it was also quietly added that in case of need for a child-birth later it could be reversed also. Nobody explained how an operation is performed, in what manner it stops the conception and what its consequences are to the health of a person … As the program was generally time and target bound, their mission was “Quick Catch” rather than to carry conviction. (p. 104)
Considering these insights, I examine the consequences of the forced sterilization policy on India’s future health-care practice.
To test my hypothesis, I use data from India’s national representative National Family and Health Survey in 2015–16 (NFHS-4) to examine the sources of households’ health-care use. To measure the exposure to the forced sterilization policy, I digitize and use various state-level sterilization performance statistics from the historical yearbooks published by the Ministry of Health and Family Planning, Government of India. I find that higher exposure to the forced sterilization policy is associated with lower use of public health-care facilities today. My results are robust to a variety of controls and a number of alternative measures of exposure to the forced sterilization policy.
After establishing that the forced sterilization policy has a negative association with the use of public health-care facilities today, I turn to the task of addressing concerns of reverse causality and omitted variable bias using an instrumental variable (IV) approach. To identify the causal impact, I need an instrument that exogenously determines the sterilization performance during this period. For this, I exploit the unique history of the implementation of the forced sterilization policy and use distance from New Delhi to state capitals as an instrument. This instrument is developed by and empirically tested in Sur (2021) to examine the impact of the forced sterilization policy on lower vaccination rate in India.
The instrument is constructed considering the well know insight from the emergency period that the forced sterilization policy was aggressively undertaken owing to the active role played by Sanjay Gandhi, the son of the Prime Minister Indira Gandhi (Gwatkin 1979; Indian National Congress 2011; Nayar 2013; Chandra 2017). Due to Mr. Gandhi’s personal influence, forced sterilization was aggressively undertaken in the northern parts of India, and distance from New Delhi, which was previously irrelevant, emerged as an important determinant of excess sterilizations and is itself capable of explaining two-thirds of the variation in sterilization performance among the states (Gwatkin 1979). Based on these insights, I use distance from New Delhi to state capitals as an instrument to capture the variation in exposure to the forced sterilization policy. The unique history of the implementation of forced sterilization during the emergency period provides a basis for the exogeneity of my instrument. In addition, I perform two falsification tests to empirically show the exogeneity of this instrument.
The IV regression produces estimates that are similar to the ordinary least squares (OLS) estimates. I find that an average increase in excess sterilizations (from zero to about 3.2 times) decreases the use of public health-care facilities today by about 18.6 percentage points. This is relative to a sample mean of 44.2% for our sample (public health-care use) as a whole. It suggests that the forced sterilization policy has had a large, negative, and significant effect on the use of public health-care facilities in India.
Finally, I examine the plausible channels through which the forced sterilization policy affects the use of public health-care facilities. To explore the mechanisms, I first examine the reasons why households do not use public health-care facilities. I use the data from NFHS-4 that asks an additional question of households who do not use public health-care facilities, asking them to explain the reasons. I find that the effects of exposure to the forced sterilization policy on standard supply-side constraints—such as no nearby facility, facility timing not convenient, health personnel often absent, and waiting time too long—are minimal, sometimes negative, and statistically insignificant. This suggests that supply-side factors are less likely to be the mechanism for higher usage of private health-care facilities. However, higher exposure to the forced sterilization policy has a positive and significant effect on households answering “poor quality of care” and “other” as their reasons for not using public health-care facilities.
Next, I delve further into the reasons why households respond with “poor quality of care” and “other” as their reasons for not using public health-care facilities. Because public health-care workers did not provide appropriate medical care during the forced sterilization period and often delivered false information to motivate individuals to undergo sterilization, I additionally check whether loss of confidence is a plausible channel. I use data from the Indian Human Development Survey-II in 2011–12 (IHDS-II) on confidence in institutions to examine how exposure to forced sterilization policy affects confidence in hospitals and doctors. The IHDS-II asks households separate questions on confidence in government hospitals and doctors and private hospitals and doctors to provide good treatment. I find that households belonging to states that were highly exposed to the forced sterilization policy exhibit a lower level of confidence in government hospitals and doctors and exhibit a higher level of confidence in private hospitals and doctors in providing good treatment. The results imply that a lower level of confidence or distrust of government hospitals and doctors is a plausible mechanism for lower usage of public health-care facilities.
This paper builds on and contributes to a diverse range of literature. First, it contributes to our understanding of the puzzling factors associated with India’s current health-care use. Several studies have documented that supply-side determinants, such as lower public health-care spending, no nearby health-care facility, absence of health-care personnel, facilities often closed, and quality of health care, are contributing factors for lower usage of public health-care facilities in India (Peters et al. 2002; Banerjee, Deaton, and Duflo 2004; De Costa and Diwan 2007; Das, Holla, et al. 2016). Furthermore, owing to higher usage of private health-care facilities in India, there have been recent initiatives to train unqualified private health-care practitioners to achieve better health-care delivery (Government of Telangana 2015; Das, Chowdhury et al. 2016). However, little causal evidence exists on why people use private health-care facilities in the first place, especially in markets with a qualified doctor offering free care in a public hospital. Similarly, we know little about the causal pathways through which individual or social characteristics influence households’ decisions to use health-care services. I build on and contribute to this literature in three ways. First, I provide an empirical investigation of the importance of historical events in shaping India’s current health-care usage. Second, I offer causal evidence that historical characteristics influence decision-making for households’ health-care usage. Third, I provide a plausible mechanism for this puzzling practice today.
Health-care provision is a public good, and universal health coverage is considered to be an integral part of the Sustainable Development Goals (Goal 3, Target 3.8). To achieve universal health-care coverage in low- and middle-income countries, international organizations such as the World Bank advocate delivering health care through free or nominally priced medical care in publicly run facilities staffed by qualified doctors (World Bank 2003). However, a significant fraction of households in these countries visits fee-charging private health-care providers (Grépin 2014). Furthermore, households in low- and middle-income countries spend a substantial portion of their resources on health care (World Bank Group 2019).7 This paper builds on and contributes to the literature on understanding a potential reason for this practice. I present evidence suggesting that historical interventions in the past could have a long-term and persistent effect on such health-care-seeking behavior.
The remainder of the paper is structured as follows. Section 2 provides a brief background of the emergency period and the forced sterilization policy. Section 3 explains the historical and contemporary data used in the empirical analysis. Section 4 presents the OLS and IV results. Section 5 discusses the mechanisms, and Section 6 concludes.
2. Context: Emergency Rule and Forced Sterilizations in India
In this section, I provide a brief background of the emergency rule period and forced sterilization policy in India. For a detailed overview of the emergency period, please see Nayar (2013) and Dhar (2018). Furthermore, for a detailed overview of the sterilization program during the emergency rule period, please see Panandiker, Bishnoi, and Sharma (1978), Shah Commission of Inquiry (1978), and Gwatkin (1979).
On June 25, 1975, Prime Minister Indira Gandhi declared a national emergency under Article 352 of the Indian constitution.8 The exact reason for the declaration of emergency rule is controversial to this day. However, sociologists, political scientists, and historians agree that economic and political difficulties concerning her leadership and India are the most credible factors.
The emergency rule allowed Ms. Gandhi to suspend a wide range of civil liberties under the Indian constitution. Thousands of people, including key opposition leaders, were arrested, the press was censored, and public gatherings and strikes were declared illegal. With all the power in Ms. Gandhi’s hands, she undertook a series of constitutional amendments and introduced new legislations to govern the country. The executive power of the emergency allowed the central government to give directions to states as to the manner in which the executive power was to be exercised. However, on January 23, 1977, Ms. Gandhi unexpectedly called for an election in March of that year. She released the opposition leaders from jail, lifted press censorship, and permitted public meetings once again. The emergency period officially ended in March after the Indian National Congress Party’s defeat in the Lok Sabha election (the lower house of the Indian parliament).
A distinctive feature of the emergency period was an aggressive family planning program achieved through sterilization. It commenced in April 1976, about a year after the proclamation of the emergency. The aggressive family planning program started with the New Population Policy (NPP) introduced to the parliament by the Ministry of Health and Family Planning.9 The NPP mainly concentrated on propagating sterilization as its method of family planning. Temporary sterilization camps were established by the government. With the NPP’s introduction, the central government authorized and endorsed a series of coercive measures for sterilization and, in extreme cases, the provision for compulsory sterilization. The central and state governments substantially increased the financial rewards for sterilization acceptors. Through a range of incentives and disincentives, they pressured their employees to get sterilized and to motivate others to do so. In some cases, quotas were imposed at the district level. Additionally, state and central government employees were given quotas to produce people for sterilization. In other cases, citizens were required to produce sterilization certificates to access basic facilities, such as public health care, irrigation, and subsidized food through ration cards (Shah Commission of Inquiry 1978; Panandiker, Bishnoi, and Sharma 1978).10
The aggressive nature of the family planning program and the concentration of effort on propagating sterilization resulted in about 8.3 million sterilizations between April 1976 and March 1977, more than three times the number in the previous year. During the peak, over 1.7 million sterilizations were performed in September 1976 alone, a figure that equaled the annual average for the ten preceding years (Gwatkin 1979). The majority of the sterilizations, about 75%, involved men undergoing vasectomies.
Historical records, court rulings, and previous studies suggest that incentives and disincentives were provided, sterilization quotas were imposed, and coercion was applied to motivate individuals to undergo sterilization during this period.11 For example, in Uttar Pradesh, a motivation bonus—of 6 rupees per person motivated to undergo sterilization—was provided to the full-time family planning staff for each person sterilized in excess of their quota. Additionally, as a form of disincentive, over 24,000 employees of the Department of Health and Family Planning were not paid their salaries in June 1976 for their failure to complete their quotas for the April– June quarter (Panandiker, Bishnoi, and Sharma 1978). Some extreme rules were also made. In a letter from the Chief Secretary of Bihar (the most senior position in the civil services of the states in India), Divisional Commissioners were informed of the following decision:
Non-achievement of targets would render officers and staff of Health Department liable to punishment e.g., censure in case of achievement short of cent (100) per cent, stoppage of increment with cumulative effect if achievement was less than 75 per cent and termination of service if achievement fell short of 50 per cent. (Shah Commission on Inquiry 1978 p. 172)
Anecdotal evidence suggests that individuals were influenced and misinformed to lead them to accept sterilization during the forced sterilization period. In a survey of four Indian states during this period, Panandiker, Bishnoi, and Sharma (1978) found that about 72 percent of the sterilized people were motivated by the influence of government officials and more than 58 percent were influenced by family planning (health-care) staff. 12 Only about 19 percent undertook sterilization on their own initiative, and the remaining 9 percent were motivated by friends and relatives. None of those surveyed underwent sterilization because of the lure of money and no one cited any case where money had played a motivating part. They noted the following environment in which most individuals were sterilized:
The common sites for the (sterilization) camps in the rural areas were big villages, locations where village festivals and fairs were held, including weekly markets, and sometimes the primary health centers themselves. In the towns the camps were generally held near the crowded localities inhabited by the lower middle and poor class people. Preparations for the camps were made well in advance. Mobile units of medical staff were deputed to perform the operations. Family planning field staff would go round the neighboring villages or localities usually in government vehicles to exhort and “persuade” people to come forward for sterilization. Revenue officials, block staff, and school teachers were also often pressed into service for mobilizing people for operation at the camps and generally free transport—trucks, pick-ups, etc.—were provided to carry people to camp-sites. At the camps, the assembled people were given refreshments, usually tea and snacks, before operation, and care was taken that nobody slipped away. Where camps were held jointly or separately for tubectomy, women patients were kept in improvised wards for 4 or 5 days and, besides free dressing and medicine, were given free meals. Every acceptor, whether of vasectomy or tubectomy, was also given a cash award at the time of his or her discharge from the camp. (Panandiker, Bishnoi, and Sharma 1978, pp. 108–111).
The aggressive nature of the program led to serious consequences, including medical complications, death, and sterilization of ineligible individuals. Once a person was sterilized and allowed to go home, he or she was generally forgotten and left to fend for himself or herself if any complications arose. Due to increased pressure, targets to meet, and carelessness, no aftercare was administered, which sometimes led to serious side effects, including death. According to the report published by the Indian Government, 1,778 complaints of deaths related to sterilization were registered. In several instances, ineligible individuals were sterilized as well. For example, reports of about 548 sterilization of unmarried individuals had been registered during this period. Similarly, in Uttar Pradesh, 11,434 individuals with fewer than two children and 69 persons over 55 years were sterilized (Shah Commission of Inquiry 1978).
This was the first major program since independence in which the people were pitted against the government. Every action of the government under the sterilization program was regarded as suspect and created a credibility gap in the government’s relationship with the people. The levels of coercion, disinformation, and carelessness associated with sterilization during this period gave free scope for the spread of rumors and fears. As a result, many people tried to avoid being caught by the sterilization programs. Whenever a sterilization campaign was launched or a camp held, a warning was spread through word of mouth to distant places and among a large number of people “Nasbandi-wale aerahe hein, Hoshiya rahena, Bhai” (The operators of sterilization are coming. Beware) (Panandiker, Bishnoi, and Sharma 1978).
The legacy of the forced sterilization remained in peoples’ minds and was evident even after the emergency rule ended. For example, the sterilization program became the biggest political issue and played an important role in the subsequent elections in March 1977 and the defeat of Indira Gandhi’s Indian National Congress Party. To repair its poor reputation, the Indian Government changed the name of the Department of Family Planning to the Department of Family Welfare. In the post-emergency period, the family planning program shifted from vasectomy to tubectomy, with women becoming the primary target (Basu 1985). The word “emergency” itself became synonymous with “sterilization” and, even today, individuals refer to the emergency period as the sterilization period (Tarlo 2000). The emergency rule remains controversial and is considered to be one of the darkest periods in the history of Indian democracy.
3. Data Sources and Description
3.1. Historical Data
The historical data on sterilization for this paper come from the historical yearbooks published by the Ministry of Health and Family Planning, Department of Family Planning, Government of India. The yearbooks report yearly statistics on family planning programs performed between April and March every year along with various demographic and health statistics. Notably, the historical yearbooks include the number of sterilizations performed and the types of sterilization performed at the state level.
I digitized and use the sterilization data from the historical yearbooks published by the Ministry of Health and Family Planning. Figure 1 presents the total number of sterilizations along with the types of sterilization performed in India every year since the start of the program in 1956. As the figure shows, there is a sharp increase in the total number of sterilizations performed during 1976–77. It is also evident that most sterilizations performed during this period were vasectomies.
Figure 2 presents the total number of sterilizations performed between April 1976 and March 1977 at the state level. To provide a visual representation, I group the sterilization measures into several broad categories, with darker shades denoting a greater number of sterilizations performed. As shown, there is a considerable variation in the exposure to the forced sterilization policy at the state level. As I explain in detail in my IV analysis, a key determinant for this variation was because of the unique history of this period and the important role played by Sanjay Gandhi, the son of the prime minister.

3.2. Contemporary Data
I combine the historical data on exposure to the forced sterilization policy with two nationally representative household survey datasets from India—the National Family and Health Survey in 2015–16 (NFHS-4) and the Indian Human Development Survey-II in 2011–12 (IHDS-II). The NFHS-4 is a stratified two-stage sample that covers all Indian states and union territories. The IHDS-II surveys cover all states and union territories of India, with the exception of the Andaman and Nicobar Island and Lakshadweep.
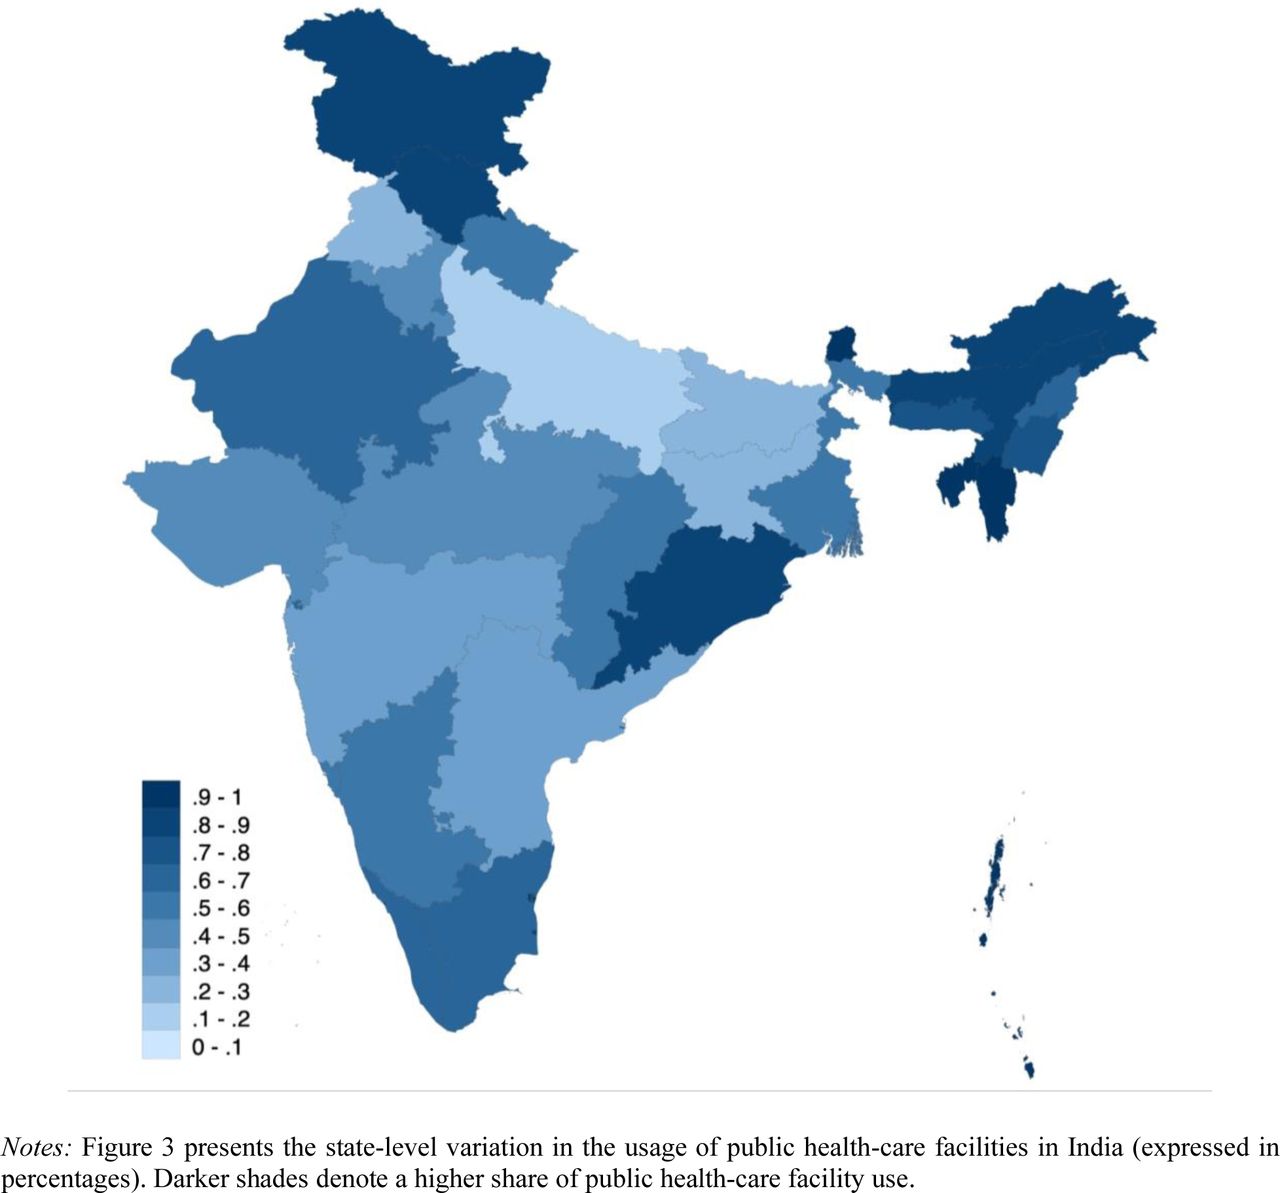
My primary outcome variable is the data on households’ sources of health care from the NFHS-4. The NFHS-4 asks households about the source of health care that they generally use when household members become sick.13 It categorizes health-care sources into four groups: the public health sector, nongovernmental organizations (NGO) or trust hospitals/clinics, the private health sector, and others. I construct an indicator variable measuring whether the household members generally use the public health sector. In the NFHS-4 sample, about 45% of households report using public health-care facilities.14 In Figure 3, I present the average number of households who generally use public health-care facilities at the state level. As we can see, there is a wide variation in the use of public health-care facilities at the state level. This is consistent with the findings of Peters et al. (2002) and Muralidharan et al. (n.d.), who found that there is a large variation in the types of health-care usage across states.

I use additional data to examine the mechanism through which the forced sterilization policy influences decision-making concerning health-care utilization. My first additional outcome variables to explore this mechanism are the responses in the NFHS-4 concerning reasons why households do not use public health-care facilities. Respondents are allowed to provide multiple answers to this question in the survey. It reports a total of six reasons: no nearby facility, facility timing not convenient, health personnel often absent, waiting time too long, poor quality of care, and other reasons. I consider each possible reason separately as my outcome of interest to understand the factors that affect a household’s intention to avoid using public health-care facilities.
My second additional outcome variable to explore the mechanism is the data on confidence in institutions from the Indian Human Development Survey-II in 2011–12 (IHDS-II). The IHDS-II asks households questions on their confidence in hospitals and doctors to provide good treatment. It asks separate questions concerning government hospitals and doctors and private hospitals and doctors. The respondents can choose between three possible answers: a great deal of confidence, only some confidence, and hardly any confidence at all. The IHDS-II assigns the value 1 to “a great deal of confidence,” 2 to “only some confidence,” and 3 to “hardly any confidence at all.” Because public health-care workers did not provide proper medical care during the forced sterilization period and frequently delivered false information to motivate individuals to undergo sterilization, I use these data to test whether loss of confidence or distrust is a plausible channel for the current practice of health-care use.
Finally, I use aggregate data on population and health-care facilities and personnel to control for potential covariates that could affect both the exposure to forced sterilization and current health-care utilization. I collect population data from the 2011 population census to construct state-level population densities. Additionally, I collect health-care facility and health-care personnel data from Rural Health Statistics to construct information on hospitals and on doctors per 1,000 people at the state level.
4. Empirical Analysis
4.1. Correlation Analysis and OLS Estimates
I begin by showing a simple relationship between historical exposure to the forced sterilization policy and India’s current health-care use through a scatter plot. Figure 4 presents the correlation between the total number of sterilizations performed in 1976–77 (expressed in 100,000s of individuals) and the percentage of households who generally use public health-care facilities calculated from the NFHS-4 at the state level. In Figure A1 in the Appendix, I present the same correlation plot but scaling the symbols so that the sizes represent the population of the state (from the 2011 census) for a better visualization. As we can see, the sterilization performance in 1976–77 is strongly associated with less use of public health-care facilities.

Then, I examine this relationship by controlling for household, geographic, and health-care characteristics that are potentially important determinants of a household’s health-care utilization. My baseline estimating equation is:
 where h indexes households, c denotes NFHS-4 clusters, and s denotes states. The variable yℎcs, denotes my outcome variable, which varies at the household level h. It is an indicator variable that measures whether the household usually uses public health-care facilities. The variable Forced Sterilizations denotes one of our measures of exposure to the forced sterilization policy in state s. I will discuss this variable in more detail below
  and
and  are vectors of household-level, NFHS-4 cluster-level, and state-level control variables, respectively.
The household-level control variables  include age and sex of the household head, household size, nine religion fixed effects, four caste fixed effects, 21 education of the household head fixed effects, four household wealth index fixed effects, an indicator for whether the household has a below poverty line (BPL) card, and an indicator for whether any household member is covered by health insurance. These controls are intended to proxy for household income and wealth.
  is a vector of NFHS-4 cluster-level covariates intended to capture the characteristics of the place where the household lives, such as altitude in meters, altitude squared, and an indicator of whether the cluster is urban.
  is a vector of covariates meant to capture state-level characteristics that are likely to be correlated with the use of public health-care facilities. They include population density per square kilometer (in log form), hospitals per 1,000 people, and doctors per 1,000 people. Because NFHS-4 is a stratified two-stage sample designed to produce indicators at the district, state, and national levels and separate estimates for urban and rural areas, undersampling and oversampling are observed in many places. To account for this issue, I conduct the regression analysis using weights defined in the NFHS-4.
I present the OLS estimates of equation (1) in Table 1. In column 1, I use the total number of sterilizations performed in a state in 1976–77 (expressed in 100,000 individuals) as my measure of the intensity of the forced sterilization policy. The estimated coefficient for Forced Sterilizations, β, is negative and statistically significant. This is consistent with my hypothesis that the forced sterilization has a negative effect on households’ usage of public health-care facilities.
A possible concern with the above estimation is that the distribution of my explanatory variable, Total Sterilizations Performed in 1976–77 (in 100,000), is right-skewed with a large number of observations taking on small values. We can see this from Figure A2, which plots the histogram of the number of sterilizations performed in 1976–77 at the state level. To account for this issue, I estimate equation (1) using the natural log of the number of sterilizations performed in 1976–77 as my measure of the intensity of the forced sterilization policy. I present the estimates in column 2 of Table 1. The results are similar to column 1, as I find a significant negative correlation between this measure of forced sterilization and the usage of public health-care facilities.
In columns 1 and 2, I use the total number of sterilizations performed in 1976–77 to measure exposure to the forced sterilization policy. One potential limitation of this measure is that it does not account for the number of sterilizations that would have happened anyway in the absence of the NPP under which the forced sterilization policy was undertaken. Accounting for this difference is important because sterilization, as a family planning method, has been performed in India since the 1950s, as shown in Figure 1. In column 3, I account for this issue and use an alternative measure of the forced sterilization policy measured by excess sterilizations performed in 1976–77 over and above the 1975–76 numbers.15 Additionally, in column 4, I report estimates using the natural log of the excess number of sterilizations performed in 1976–77. As we see, the results are similar using these alternative sterilization measures.
Finally, I report the estimates considering a better measure of forced sterilization policy that collectively accounts for India’s emergency rule, the size of states, and the state-level historical characteristics associated with sterilization performance. The estimates reported in columns 3 and 4 use the absolute number of sterilizations to measure forced sterilization policy. Some shortcomings of these measures are that they a) do not account for the difference in the size of states and b) do not account for any state-level historical factors associated with the level of sterilization performance that I do not capture in the estimation. To account for these issues, in column 5, I report the estimates after normalizing the excess sterilizations performed using sterilization figures in the previous year (1975–76). Specifically, I define Forced Sterilizations as follows:
 I normalized the previous year’s figures to account for the effect of emergency rule in India (as 1975–76 was part of the emergency period) and isolate the impact of the forced sterilization policy from India’s emergency rule.16 This is because the emergency rule itself could affect the outcome in several ways, given that India was primarily governed by autocratic rule during this period, and that it involved numerous policy changes. The results remain robust to this alternative specification, as shown in column 5.
In Section B of the Appendix, I present a series of robustness and sensitivity checks. I briefly discuss them here. First, I verify whether my results are sensitive to the inclusion and exclusion of controls. To verify this, I report estimates that involve adding each set of controls sequentially for each of my measures of forced sterilization (Tables B1–B5). In addition, I check whether the results remain robust when considering excess vasectomies only as an alternative measure of Forced Sterilizations (Table B6), given that vasectomies constituted the majority of sterilization operations (see Figure 1). My findings are robust to these alternative specifications and different measures of the forced sterilization policy.
For the remainder of the analysis, I use state-level excess sterilizations performed in 1976– 77 normalized by the 1975–76 sterilization figure as my baseline measure of exposure to the forced sterilization policy (the specification from column 5 of Table 1). This provides the best measure as it accounts for India’s emergency rule and is normalized by both size and state-level historical characteristics associated with sterilization performance. However, as I illustrate in Table 1, my results are not reliant on this choice of measure only.
4.2. Instrumental Variable Analysis
In Section 4.1, I found that the forced sterilization policy has a negative association with the use of public health-care facilities today. In this section, I address concerns of reverse causality and omitted variable bias using an IV approach. To identify the causal impact, I need an instrument that exogenously determines the sterilization performance during this period. For this, I exploit the unique history of the implementation of the forced sterilization policy and use distance from New Delhi to state capitals as an instrument to capture the state-level variation in exposure to the excess sterilizations performed during the emergency rule in India.
The unique history of the implementation of the forced sterilization policy is as follows. As described by Gwatkin (1979), Nayar (2013), and Chandra (2017), among others, the aggressive manner in which the forced sterilization policy was conducted was due to the active role of Sanjay Gandhi, the younger son of the then Prime Minister Indira Gandhi. Although he had not been officially elected and held no official position, Sanjay Gandhi rapidly rose to power during the emergency period. Family planning was a key element of his self-declared five-point program that became the central theme of his public addresses.17 Owing to his personal influence, sterilization was aggressively undertaken in the northern part of India, particularly in the states adjacent to New Delhi. As a result, distance from New Delhi, which was previously irrelevant, emerged as an important determinant of performance in the excess sterilization program and is itself capable of explaining two-thirds of the variation in performance among the states (Gwatkin 1979). This unique history of the implementation of the forced sterilization policy during the emergency period and the personal influence of Sanjay Gandhi provide a basis for the construction and the exogeneity of my instrument.
I report the IV estimates in Table 2, including each set of control variables sequentially across columns 1–4. Panel A reports the first-stage estimates for the instrument. The first-stage estimates show that distance from New Delhi to state capitals is negatively correlated with excess sterilizations performed during the emergency rule in India. This is consistent with Gwatkin (1979). In panel B, I present the second-stage estimates. They suggest a negative and statistically significant effect of the forced sterilization policy on the current use of public health-care facilities. In Section C of the Appendix, as a robustness check, I consider excess vasectomies only (Table C1). The estimates are robust to this alternative specification and similar to the results reported in Table 2.
Not only are the negative coefficient estimates of Table 2 statistically significant, but they are also economically meaningful. Column 4 of Table 2 indicates that an average increase in excess sterilizations—where sterilizations increased by 3.2 times compared with the rates prior to the enforced sterilization policy—decreases the use of public health-care facilities today by about 18.6 percentage points. This is relative to a sample mean of 44.2% for our sample as a whole. It suggests that the forced sterilization policy has a sizable effect on the use of public health-care facilities in India.
Falsification Tests—My IV strategy rests on the assumption that the instrument I use— distance from New Delhi to the state capital— is exogenous and satisfies the exclusion restriction. I provide some qualitative evidence, including Gwatkin (1979), supporting that my instrument is driven by the personal influence of the son of the then prime minister and in particular, it is not correlated with sterilization performance previously. In this section, I perform two falsification tests to show the exogeneity of my instrument empirically.
My first falsification exercise consists of examining sterilization performance before 1976. Because Sanjay Gandhi had no personal influence over sterilization before 1976, my IV should have no predictive power on sterilization performance before 1976. First, in panel A of Figure 5, I present the relationship between my instrument and excess sterilizations performed in 1975–76. The scatter plot suggests no association between distance from New Delhi to state capitals and excess sterilizations performed in 1975–76. I formally test this relationship by estimating a placebo IV analysis in column 1 of Table 3. As shown, distance from New Delhi to state capitals has no predictive power for excess sterilizations performed in 1975–76 in the first stage and health-care facility use in the second stage.

I undertake a second falsification exercise using excess female sterilizations, or tubectomies, which were not the main focus of the forced sterilization period (Shah Commission of Inquiry 1978; Gwatkin 1979; Basu 1985). The forced sterilization program did not focus on female sterilization because tubectomies constitute major abdominal surgery and require longer hospitalization periods for recovery. Conversely, vasectomies are relatively quick to perform, and recipients can be discharged on the same day of the operation. During the emergency period, sterilization was mostly performed in temporary camps. The existing infrastructure struggled to cope with the large number of operations induced by the increased pressure and targets imposed, which was another reason why tubectomy was not the main focus during this period.
This history provides a falsification test for my instrument. I present the relationship between my instrument and excess tubectomies performed in 1976–77 in panel B of Figure 5. The scatter plot suggests no association between distance from New Delhi to state capitals and excess tubectomies performed in 1976–77. I formally test this relationship by estimating a placebo IV analysis in column 2 of Table 3. The estimate in column 2 suggests that my IV does not have predictive power for excess female sterilizations performed during the forced sterilization period in the first stage and health-care use in the second stage.
These two falsification tests suggest that the instrument that I use in my estimation is plausibly exogenous. In Section D of the Appendix, I report estimates adding each set of controls sequentially for each falsification test (Tables D1–D2). As shown, the estimates are robust to these alternative specifications and similar to the results reported in Table 3.
5. Mechanisms
In the previous section, I found that the forced sterilization policy has had a negative and sizable effect on public health-care use in India. In this section, I examine plausible channels or mechanisms that explain this negative effect. First, I explore the reasons provided by the households in the NFHS-4 questionnaire. Then, I examine confidence in health-care facilities and doctors as a plausible direct mechanism.
5.1. Examining the Reasons Given in the NFHS-4
The NFHS-4 asks households who do not use public health-care facilities to explain the reasons why. It offers a total of six reasons: no nearby facility, facility timing not convenient, health personnel often absent, waiting time too long, poor quality of care, and other reasons. Respondents were allowed to select multiple answers. I consider each answer separately as outcomes of interest to understand whether the forced sterilization policy has had any effect on households selecting these answers as reasons for not visiting a public health-care facility.
I present the results in Table 4. As shown, the effects of exposure to the forced sterilization policy on standard supply-side factors—such as no nearby facility, facility timing not convenient, health personnel often absent, and waiting time too long—are minimal, sometimes negative, and statistically insignificant. These estimates suggest that supply-side constraints are not the mechanism explaining why households do not use public health-care facilities in areas where exposure to the sterilization policy was high.
However, column 5 suggests that higher exposure to the forced sterilization policy has a positive and significant effect on households selecting “poor quality of care” as their reason for not using public health-care facilities. Finally, the estimates in column 6 suggest that households are more likely to answer “other” as their reasons for not using public health-care facilities in states where sterilization exposure was higher.
In Section E of the Appendix, I present a series of robustness and sensitivity checks. I first verify whether my results are sensitive to the inclusion and exclusion of controls (Table E1). Second, I check my results for robustness when considering excess vasectomies only (Table E2). As we can see, overall, the estimates are robust to these alternative specifications and similar to the results reported in Table 4.
5.2. Confidence in Health-care Facilities and Doctors
In this section, I delve further into plausible reasons for households selecting “poor quality of care” and “other” as their reasons for not using public health-care facilities. I check whether loss of confidence or distrust in public health care and public health-care personnel is a plausible channel for the current pattern of health-care use. Several studies have shown that health interventions in the past are associated with subsequent mistrust in medicine (Alsan and Wanamaker 2018; Martinez-Bravo and Stegmann 2021; Lowes and Montero 2018).
I test for this channel in this context because false information was delivered by public health-care workers to motivate individuals to undergo sterilization during this period. As noted earlier, during the forced sterilization period, after being sterilized and discharged from the camp or hospital, patients were generally left to fend for themselves even if any complications arose, which led to serious side effects for some, including death. Therefore, I check whether loss of confidence or distrust is a plausible channel for the current avoidance of public health care.
I use data from the Indian Human Development Survey-II in 2011–12 (IHDS-II) on confidence in institutions to examine how exposure to the forced sterilization policy affects trust. The IHDS-II asks households separate questions on confidence in government hospitals and doctors and private hospitals and doctors to provide good treatment. The respondents can choose between three possible answers to which the IHDS-II assigns values of 1, 2, and 3, respectively: “a great deal of confidence”, “only some confidence”, and “hardly any confidence at all”.
Figure 6 presents the association through scatter plots to aid visual understanding. In panel (A), I plot the correlation between excess sterilizations in 1976–77 and confidence in government hospitals and doctors. In panel (B), I plot the correlation between excess sterilizations in 1976–77 and confidence in private hospitals and doctors. We see a positive association in panel (A) and negative association in panel (B). It suggests that households belonging to states highly exposed to the forced sterilization policy exhibit a lower level of confidence in government hospitals and doctors, and a higher level of confidence in private hospitals and doctors in providing good treatment.

Next, I examine this relationship through an IV regression in Table 5. In column 1 (2), I estimate the relationship between the forced sterilization policy and confidence in government (private) hospitals and doctors. The results are similar to the association found in Figure 5. The results imply that a lower level of confidence in or distrust towards government hospitals and doctors is a plausible mechanism for lower usage of public health-care facilities. In Section F of the Appendix, I report a series of alternative analyses showing that the results are robust overall and similar to those reported in Table 5.
6. Conclusion
In this paper, I examined the importance of historical events in shaping current health-care use in India. In particular, I examined whether the aggressive family planning program under which a forced sterilization policy was implemented during the period of emergency rule in the 1970s could partly explain the lower use of public health-care facilities today.
Using data from the NFHS-4, I examined households’ source of health care. I found that greater exposure to the forced sterilization policy is associated with lower use of public health-care facilities today. I also found that the results were robust to a variety of controls, a number of alternative measures of exposure to the forced sterilization policy, and when examining the impact through an IV approach.
Next, I examined plausible mechanisms. First, I examined the reasons why households do not use public health-care facilities. I found that the exposure to the forced sterilization policy did not have significant effects on standard supply-side constraints. However, higher exposure to the forced sterilization policy has had a large, positive, and significant effect on households answering that “poor quality of care” and “other” reasons were why they chose not to use public health-care facilities.
I delved further into the reasons why households responded that “poor quality of care” or “other” reasons led them to avoid public health-care facilities. Using data from the IHDS-II on confidence in institutions, I found that households belonging to states that were highly exposed to the forced sterilization policy exhibit a lower (higher) level of confidence in public (private) hospitals and doctors in providing good treatment. These results imply that a lower level of confidence in or distrust towards public hospitals and doctors is a plausible mechanism for lower usage of public health-care facilities. This could be expected given that public health-care staff provided disinformation to motivate individuals to accept sterilization and did not provide proper aftercare during the sterilization period which led to serious complications including death.
My results provide robust evidence suggesting that historical interventions in the past have had a strong and persistent impact on shaping health-seeking behavior in India. This has important implications for understanding the puzzling factors behind the higher demand for private health-care facilities, even in markets with qualified doctors offering free care in a public hospital. These findings highlight the unintended consequences associated with medical interventions in the past and the importance of understanding such contexts for the design and implementation of public policy and future interventions.
Data Availability
All the datasets are publicly available and are duly cited in the manuscript.
Online Appendix
Section A: Figures


Section B: Robustness to OLS Estimates
Section C: Robustness to IV Estimates
Section D: Robustness to Falsification Tests
Section E: Robustness to Examining the Reasons in NFHS-4
Section F: Robustness to Confidence in Healthcare Facilities and Doctors
Footnotes
↵1 Henceforth, I refer to “primary health-care” as the “health-care” for simplicity.
↵2 For example, India has one of the highest proportions of private health spending anywhere in the world, constituting 82% of all health expenditure. Only five countries (Cambodia, the Democratic Republic of the Congo, Georgia, Myanmar, and Sierra Leone) have a higher dependence on private health financing (Peters et al. 2002).
↵3 For example, according to the Indian Medical Association, about 1 million unqualified doctors practice allopathic medicine in India. https://www.ima-india.org/ima/left-side-bar.php?pid=291. Accessed on January 28, 2021.
↵4 The Medical Advice, Quality, and Availability in Rural India (MAQARI) project. http://pubdocs.worldbank.org/en/161151429125257286/pdf/13-Medical-Advice-Quality-and-Availability-in-Rural-India-MAQARI-Karthik-Muralidharan.pdf. Accessed on January 28, 2021.
↵5 The autocratic rule (the emergency) officially ended in March 1977. However, it was substantially relaxed in January 1977.
↵6 Henceforth, I refer to “the aggressive family planning program through forced sterilization” as the “forced sterilization policy” or “the policy” for simplicity.
↵7 For a detailed overview of the health-care market, health-care utilization, and access to health care in developing countries, see Dupas (2011), Das and Hammer (2014), and Dupas and Miguel (2017).
↵8 Article 352 (1) states that “If the President is satisfied that a grave emergency exists whereby the security of India or of any part of the territory thereof is threatened, whether by war or external aggression or armed rebellion, he may, by Proclamation, make a declaration to that effect in respect of the whole of India or of such part of the territory thereof as may be specified in the Proclamation Explanation. A Proclamation of Emergency declaring that the security of India or any part of the territory thereof is threatened by war or by external aggression or by armed rebellion may be made before the actual occurrence of war or of any such aggression or rebellion, if the President is satisfied that there is imminent danger thereof.”
↵9 For a detail overview of the NPP, see Singh (1976).
↵10 This was not approved by the central government and was eventually returned to the state for revision.
↵11 For a detailed discussion on quota enforcement, incentives and disincentives, coercion, and fear around sterilization during the emergency, see Panandiker, Bishnoi, and Sharma (1978) and Shah Commission of Inquiry (1978).
↵12 The four Indian states are Bihar, Madhya Pradesh, Punjab, and Uttar Pradesh.
↵13 The question the NFHS-4 asks is “When members of your household get sick, where do they generally go for treatment?”.
↵14 This number is weighted by sample weights. The unweighted figure is about 47%.
↵15 Using alternative measures of excess sterilization performed in 1976–77, involving deducting the average of the last two years or three years, produces nearly identical results.
↵16 Normalizing by the average of the last two years or three years as an alternative measure produces nearly identical results.
↵17 The other four programs were adult education, abolition of dowries, planting of trees, and eradication of the caste system.


