
Abstract
Sequencing of large cohorts offers an unprecedented opportunity to identify rare genetic variants and to find novel contributors to human disease. We used gene-based collapsing tests to identify genes associated with glucose, HbA1c and T2D diagnosis in 363,977 exome-sequenced participants in the UK Biobank. We identified known associations with diabetes including variants in GCK, HNF1A and PDX1, genes involved in Mendelian forms of diabetes. Novel associations were identified for GIGYF1 predicted loss of function (pLOF), TNRC6B pLOF and PFAS predicted damaging missense variants. Multiple rare variants contributed to these associations, including singleton variants. The most significant novel associations were seen for GIGYF1 pLOF which associated with increased levels of glucose (0.77 mmol/L increase, p = 4.42 × 10⁻¹²) and HbA1c (4.33 mmol/mol, p = 1.28 × 10⁻¹⁴) as well as T2D diagnosis (OR = 4.15, p= 6.14 x10⁻¹¹). GIGYF1 pLOF also associated with decreased cholesterol levels as well as an increased risk of hypothyroidism. An independent common variant association for glucose and T2D was identified at GIGYF1 which replicated in additional datasets. Our results highlight the role of GIGYF1 in regulating insulin signaling and protecting from diabetes.
Introduction
Human genetics provides powerful methods for understanding the roles of genes and proteins in disease and can lead to new therapeutic hypotheses and drug targets. Genetic evidence based on sequence variants within coding regions of the genome is better at predicting the efficacy and safety of novel therapeutics than evidence from genome-wide association studies (GWAS), which tends to involve common noncoding variants [1-3]. Among coding variants, predicted loss of function (pLOF) variants are particularly informative in association studies because they establish a direct causal link between reduction in gene function and biological outcomes. Additionally, rare missense variants predicted to be deleterious can provide valuable biological insights [4, 5]. However, interrogation of the effects of such variants is hampered by the rarity of these variants and the cohort sizes needed to identify associations [6]. Exome or whole-genome sequencing of large biobanks coupled with gene-level aggregation of rare high impact variants can help to circumvent these challenges [4]. Biobanks offer a considerable advantage over case-control cohorts as they contain richer phenotyping data which often includes biomarker measurements as well as disease diagnoses. This allows a more complete understanding of the biological consequences of damaging variants in particular genes [7, 8].
Diabetes is a disease that has been extensively studied in traditional array-based GWAS with hundreds of associations identified to date [9-12]. Although these studies have given insight into some of the biological mechanisms contributing to diabetes, most of the reported associations are with variants in non-coding regions, making identification of the causal gene challenging. More recently, exome sequencing has been applied to discover protein-coding variants that alter the risk of developing type 2 diabetes (T2D). Sequencing of 20,791 T2D cases followed by the use of gene-based collapsing tests (to aggregate predicted damaging variants) identified associations of SLC30A8, MC4R and PAM with T2D diagnosis [5].
Using 363,977 whole exome sequences from the UK Biobank (UKBB) we performed gene-level collapsing tests to examine the association of pLOF and damaging missense variants in ∼17,000 genes with biomarkers of glycemic control, glucose and glycated hemoglobin (HbA1c), as well as T2D diagnosis.
Results
Association of rare variants with glucose, HbA1c and T2D
We used 454,787 whole exome sequences from the UK Biobank (UKBB) to identify rare variants with a minor allele frequency (MAF) ≤1% likely to have functional impact; pLOF variants (i.e. frameshift, stop gain, splice donor or splice acceptor variants) called as high confidence by LOFTEE [13] or missense variants predicted to be damaging (Combined Annotation Dependent Depletion [CADD] score ≥ 25). We identified 726,422 rare pLOF variants affecting 16,477 genes, 58.5% of which were singletons (carried by a single individual), and 2.14 million damaging missense variants in 17,312 genes, 49.6% of which were singletons (Supplementary Table 1).
Given the large proportion of variants present in just a single individual, we used gene-based collapsing tests to look for associations with biomarkers of glycemic control and T2D diagnosis. We used two variant aggregation strategies; 1) pLOF variants with MAF ≤1% and 2) damaging missense variants with MAF ≤1% and performed burden testing in the unrelated White population (n=363,977) adjusting for age, sex and genetic ancestry via 12 principal components.
First, we tested genes for association with glucose and HbA1c levels. We required at least 10 variant carriers per gene to have measurements based on an examination of genomic inflation at different carrier thresholds (Supplementary Figure 1). Using a p-value threshold adjusted for the number of variant sets and phenotypes tested (p ≤ 7.82 × 10⁻⁷), four genes significantly associated with glucose levels: GCK pLOF (p = 1.56 × 10⁻⁹, 1.24 mmol/L increase), GCK damaging missense (p = 6.15 × 10⁻¹¹, 0.61 mmol/L increase), GIGYF1 pLOF (p = 4.42 × 10⁻¹², 0.77 mmol/L increase) and G6PC2 damaging missense variants (p = 4.62 × 10−83, 0.33 mmol/L decrease) (Figure 1, Table 1). The same variant sets also associated with HbA1c levels along with 27 additional sets including HNF1A pLOF (p = 2.14 × 10⁻⁷, 4.01 mmol/mol increase), TNRC6B pLOF (p = 2.36 × 10⁻⁷, 3.94 mmol/mol increase) and PDX1 damaging missense variants (p = 2.54 × 10⁻⁷, 0.41 mmol/mol increase) (Figure 1, Table 1).
Association of pLOF or damaging missense variants (CADD score ≥ 25) aggregated per gene with glucose and HbA1c levels. The effect is shown in standard deviations (SD) of transformed values as well as in International Federation of Clinical Chemistry (IFCC) units. CI; confidence interval.

Gene-level associations with glucose and HbA1c levels
A) pLOF associations with glucose levels. B) Damaging missense variant associations with glucose levels. C) pLOF associations with HbA1c. D) Damaging missense variant associations with HbA1c levels. The red line indicates the threshold for significance, genes with significant associations are labeled.
We then tested aggregated pLOF and damaging missense variants for association with T2D diagnosis (Supplementary Figure 1). Using a p-value threshold adjusted for the number of variant sets tested (p ≤ 1.46 × 10⁻⁶), 6 variant sets significantly associated with T2D; pLOF variants in GIGYF1, GCK, HNF1A and TNRC6B and damaging missense variants in GCK and PAM (Figure 2, Table 2). As the time of available follow-up differs between England, Scotland and Wales, we controlled for country of recruitment in the regression (see Methods). In addition, we confirmed that significant hits did not associate with country of recruitment (all p > 0.035) and that hits remained significant when only data from England were considered (Supplementary Table 2).
Association of pLOF or damaging missense variants (CADD score ≥ 25) aggregated per gene with T2D diagnosis. OR; odds ratio, CI; confidence interval.

Gene-level associations with T2D
A) pLOF associations with T2D diagnosis. B) Damaging missense variant associations with T2D diagnosis. The red line indicates the threshold for significance, genes with significant associations are labeled.
Identification of genes with a biological role in diabetes
Variants in two genes, GCK and GIGYF1, significantly associated with glucose, HbA1c and T2D diagnosis, strongly suggesting a biological role in diabetes; GCK is involved in Mendelian forms of diabetes while GIGYF1 has not previously been implicated by genetics in the disease. Both GCK and GIGYF1 are located on chromosome 7 but are 56Mb apart, strongly suggesting that these signals are independent; this independence was confirmed by conditional analysis (Supplementary Table 3). Two additional variant sets, HNF1A pLOF and TNRC6B pLOF, had genome-wide associations with both T2D diagnosis and HbA1c levels while G6PC2 damaging missense associated with decreased levels of both glucose and HbA1c but not T2D (Table 3).
Variant sets significant for at least one trait in our primary analysis that are also associated with additional diabetes traits (p ≤ 0.0016, 32 sets tested). Effect is shown in SD of transformed values or as an odds ratio (OR).
To see which other significant genes were likely to have a role in diabetes we looked at all variant sets with a significant glucose, HbA1c, or T2D association and examined whether they had associations with additional diabetes traits using a more permissive p-value threshold correcting for the number of variant sets tested (p ≤ 0.0016, 32 sets tested). Damaging missense variants in PDX1 and PFAS, which had significant associations with HbA1c levels in our primary analysis, associated with T2D diagnosis using this threshold (Table 3 and Supplementary Table 4).
Showing significant results for burden tests on quantitative traits (p ≤ 1.22 × 10⁻⁴). Effect is shown in standard deviations (SD) of transformed values. RH; right hand, LH; left hand.
Many HbA1c associations appeared to be secondary to effects on red blood cells. 22 out of 31 variant sets associated with HbA1c did not show effects on glucose levels or T2D diagnosis (Supplementary Table 4) and were not implicated in Mendelian forms of diabetes. Out of these 22 variant sets, 12 were in genes implicated in Mendelian disorders affecting red blood cells (for example EPB42 and TFR2; see Supplementary Table 5) and an additional five had highly significant associations with red blood cell traits in our data (p ≤ 7.82 × 10⁻⁷; Supplementary Table 6).
Showing significant results for burden tests on ICD10 coded diagnoses with ≥ 500 cases and ≥ 1 expected case carrier (p ≤ 1.22 × 10⁻⁴). OR; odds ratio.
Associations for the array-typed variant rs221783. For quantitative traits the effect is shown in standard deviations (beta) and for diagnoses as an odds ratio (OR). MAF; minor allele frequency.
We focused on the variant sets associated with multiple diabetes traits as these are strong candidates for regulating glucose homeostasis. The genes fall into three main groups; known MODY (maturity-onset diabetes of the young) genes (GCK, HNF1A and PDX1) [14], known genes reported in previous exome-wide analyses of glucose levels or T2D (G6PC2 and PAM) [5, 15], and novel genes not previously implicated by genetics in diabetes (GIGYF1, TNRC6B and PFAS).
Because obesity is linked to the development of T2D, we adjusted for body mass index (BMI) in the burden tests and found that the association of variants in these genes with diabetes-related traits remained significant (Supplementary Tables 7 and 8).
Associations for rare variants can be susceptible to confounders such as population stratification and sample relatedness leading to false positives. Therefore, we used the generalized linear mixed model implemented by SAIGE-Gene which accounts for relatedness and adjusts for unbalanced case-control ratios [16] to verify association of our variant sets of interest with glucose, HbA1c, and T2D diagnosis. SAIGE-Gene was run in the White population including related individuals (n=398,574). Using the p-value thresholds previously employed, all associations were statistically significant using this method apart from the association of TNRC6B pLOF with HbA1c (p = 6.85 × 10⁻⁶) and T2D diagnosis (p = 4.77 × 10⁻⁵) (Supplementary Table 9). Therefore, additional data or replication is needed in order to determine if TNRC6B pLOF truly associates with HbA1c levels and T2D.
We sought to use independent measurements of glucose and HbA1c to validate the associations of interest seen in our primary analysis which used measurements taken as part of the UKBB assessment. To do this we extracted lab test values for glucose and HbA1c from primary care data, which is available for approximately half of the cohort, taking the mean measurement per individual. In gene-based burden tests all variants showed a direction of effect consistent with that seen in the primary analysis (Supplementary Figure 2). Nine out of the 12 associations with glucose and HbA1c were significant when correcting for the number of tests performed (p ≤ 0.004), including the association of GIGYF1 pLOF with glucose (p=1.21 × 10⁻⁵, effect = 0.63 SD) and HbA1c (p=1.38 × 10⁻⁵, effect = 0.73 SD) levels (Supplementary Table 10).
Multiple variants contribute to associations with diabetes diagnosis and biomarkers
To examine whether specific variants were driving the associations with diabetes traits we conducted “leave-one-out” burden tests. The association of PAM missense variants with T2D diagnosis was driven entirely by a previously reported variant Ser539Trp (rs78408340; p = 0.43 when Ser539Trp is excluded). For all other variant sets, multiple variants contributed to the associations observed (Supplementary Figure 3). Notably, when singleton variants were excluded, half of the associations no longer reached significance including those for GCK pLOF and glucose (p = 0.0015 without singletons versus p = 1.56 x10⁻⁹) and GIGYF1 pLOF and T2D (p = 2.9 × 10⁻⁵ without singletons versus p = 6.14×10⁻¹¹) (Supplementary Table 11), demonstrating the power of including singletons in gene-based tests.

PheWAS of GIGYF1 pLOF
The x-axis is the beta (effect size in standard deviations) for the association and the y-axis is -log10(p-value). Quantitative traits are colored light blue and ICD10 diagnoses colored dark blue. Phenome-wide significant associations are labeled. The dashed line indicates the p-value threshold for phenome-wide significance. Protein; total protein, RH grip; right hand grip strength, round time: time to complete round (cognitive test), LH grip; left hand grip strength, PEF; peak expiratory flow.
For the variants contributing to our novel discovered associations, GIGYF1 pLOF, TNRC6B pLOF and PFAS damaging missense variants, we examined the quality scores, sequencing depth, transcripts affected and presence of contributing variants in gnomAD. We found that for GIGYF1 and PFAS the variants contributing most to the associations had good quality scores and depth and were present in the non-Finnish European population in gnomAD. In contrast, TNRC6B is a highly constrained gene and the most common pLOF variant is not present in gnomAD. This further underscores the need for replication of the TNRC6B associations as pLOF variants for constrained genes may not result in true loss of function (see Supplementary Note and Supplementary Figure 4).
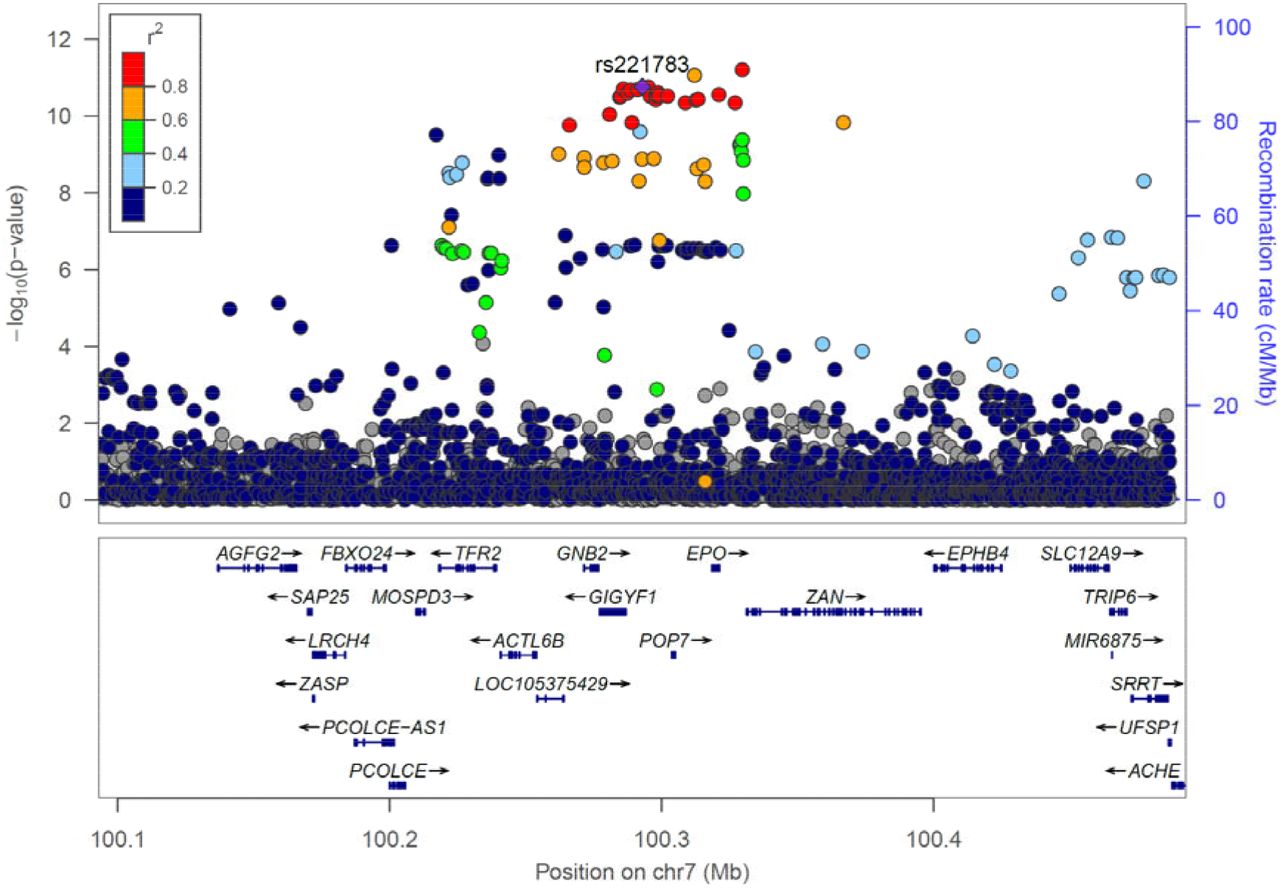
Locus plot of glucose associations at the GIGYF1 locus
Association results for array genotyped and imputed variants are shown. The purple diamond represents the lead variant rs221783. Other variants are colored according to correlation (R2) with this marker (legend at top-left). The region displayed is chr7: 100092914-100492914. Genomic coordinates are for hg19.
PheWAS of GIGYF1 pLOF reveals associations with cholesterol levels, hypothyroidism and complications of diabetes
The most significant novel associations were seen for GIGYF1 pLOF which associates with increased glucose, HbA1c and increased incidence of T2D diagnosis. GIGYF1 encodes a protein named for its binding to GRB10 (GRB10 interacting GYF protein 1), an adapter protein that has been shown to bind both the insulin and IGF-1 receptors. The association between GIGYF1 pLOF and increased diabetes risk indicates that GIGYF1 has a role in regulating insulin signaling and in protecting from diabetes. To give additional insight into the biological roles of GIGYF1 we performed a phenome-wide association study (PheWAS) testing GIGYF1 pLOF for association with 142 quantitative traits and 262 ICD10-coded diagnoses. Based on the number of tests performed, the threshold for significance was p ≤ 1.22 × 10⁻⁴ (Figure 4).
GIGYF1 pLOF strongly associated with decreased levels of total cholesterol (p=2.44 × 10⁻¹², effect = -0.61 SD) which was, in large part, driven by LDL cholesterol (p = 2.40 × 10⁻¹⁰, effect = -0.56 SD) although an effect on HDL cholesterol was also observed (Table 4). We also detected associations with decreased grip strength and decreased peak expiratory flow which may reflect changes in body size, muscle mass or general health in carriers [17, 18]. Notably, GIGYF1 pLOF also associated with increased levels of the kidney injury biomarker cystatin c (p= 6.65 × 10⁻⁶, effect = 0.36 SD) and increased diagnosis of urinary system disorders (p = 7.32 × 10⁻⁵, OR = 2.71) which might suggest renal complications of diabetes in carriers (Table 4 and Table 5).
After diabetes, the next most significant disease association of GIGYF1 pLOF was with increased risk of hypothyroidism (p = 1.25 × 10⁻⁹, OR = 4.53). 21 out of the 131 GIGYF1 pLOF carriers had a diagnosis of unspecified hypothyroidism and 7 of these also had a diagnosis of T2D. We also saw a significant association with increased risk of syncope and collapse (p = 1.92 × 10⁻⁶, OR = 3.75), possibly reflecting complications of diabetes or thyroid disorders (Table 5).
Other phenome-wide significant associations with quantitative traits included waist circumference, total protein and mean corpuscular hemoglobin as well increased time to complete a cognitive test (Table 4). To ensure that the association of GIGYF1 pLOF with HbA1c was independent of effects on hemoglobin we adjusted for mean corpuscular hemoglobin level and verified that the association remained highly significant (p = 4.10 × 10⁻¹²). GIGYF1 pLOF also associated with increased diagnosis of emphysema and anemia (Table 5).
We also performed PheWAS on TNRC6B pLOF and PFAS damaging missense variants. PheWAS of TNRC6B pLOF revealed associations with decreased grip strength, increased blood urea levels as well as decreased measures of lung function, forced vital capacity and forced expiratory volume (Supplementary Table 12). We also saw associations with increased time to complete a cognitive test and increased speech recognition threshold (SRT) suggesting hearing impairment in carriers. This was further supported by an association with increased diagnosis of hearing loss in TNRC6B pLOF carriers (p = 1.63 x10⁻⁴, OR = 5.18). PFAS damaging missense variants did not have any significant associations beyond those with HbA1c levels and T2D.
Common variants at GIGYF1 associate with glucose, T2D and GIGYF1 expression
As GIGYF1 pLOF variants are very rare it is extremely challenging to replicate the associations seen in UKBB. Therefore, we looked for more common variants that could further shed light on the role of the locus and gene in diabetes. We tested array genotyped and imputed variants at the GIGYF1 locus for association with glucose levels in 294,042 unrelated White individuals with measurements available. We found a cluster of variants in a linkage disequilibrium block covering GIGYF1 and EPO significantly associating with glucose levels (Figure 4). This signal is represented by rs221783, an intergenic variant whose minor T allele associated with decreased glucose (p = 1.8 × 10⁻¹¹, effect = -0.03 SD,) and HbA1c (p = 3.6 × 10⁻⁷, effect = -0.02 SD,) levels as well as increased cholesterol (p = 7.0 × 10⁻¹², effect = 0.03 SD,). This variant also associated with a decreased risk of T2D (p = 0.005, OR = 0.96) and hypothyroidism (p = 6.95 × 10⁻⁷, OR=0.92) (Table 6). rs221783 is the best eQTL (R2 > 0.8) for GIGYF1 in several tissues including pancreas, adipose and thyroid [19] (Supplementary Table 13). In all tissues, the T allele associating with decreased glucose and decreased T2D risk associated with increased GIGYF1 expression. Conditional analysis showed that the glucose and HbA1c associations of GIGYF1 pLOF and rs221783 are independent of each other (Supplementary Table 14).
The association of rs221783 with glucose levels replicated in Biobank Japan (p = 1.7 × 10⁻⁴, effect = -0.05 SD for T allele) [20] whilst in FinnGen, rs221783 showed a nominal association with T2D risk (p = 0.02, OR = 0.96 for T allele) (Supplementary Table 15). The association with thyroid disease has been replicated elsewhere [21].
The independent glucose and T2D associations at the GIGYF1 locus and their replication in other datasets further support the hypothesis that decreasing GIGYF1 predisposes to diabetes while increasing GIGYF1 levels may protect from diabetes.
Discussion
Our results highlight the power of whole exome sequencing to make novel discoveries relevant to human disease and to detect known associations of Mendelian disease genes. Gene-level aggregation and burden testing of rare pLOF and predicted damaging missense variants identified genes associating with diabetes and biomarkers of glycemic control. These included several genes not previously implicated in diabetes, GIGYF1, TNRC6B and PFAS, as well as GCK, HNF1A and PDX1, known MODY genes [14, 22-24]. We also identified PAM and G6PC2, genes identified by other rare-variant studies of T2D and glucose levels [5, 15]. Gene-level tests were needed to detect the majority of these associations owing to the rarity of damaging variants. For example, out of 363,977 individuals, just 40 carried a pLOF variant in GCK and 131 carried a pLOF variant in GIGYF1. In general, singleton variants contributed a large part of the signal arguing strongly, as others have done [4], for including such variants in gene-based collapsing tests.
Test statistic inflation can be a challenge when testing rare variants as statistical assumptions break down when the number of carriers expected to have the disease of interest is low [4, 25]. To avoid false positives in our analysis of diabetes, we initially examined associations with glucose and HbA1c because quantitative traits are less susceptible to inflation. All of the variant sets that associated with T2D also affected HbA1c and/or glucose levels giving us confidence in these associations. In addition, T2D associations for all genes, apart from TNRC6B, were significant (p ≤ 1.46 × 10⁻⁶) using the linear mixed model implemented by SAIGE-Gene which can be more robust when dealing with low numbers of variant carriers [16]. Additional confidence in our results comes from the fact that we identified genes known to be involved in Mendelian forms of diabetes and previously reported genes.
We uncovered novel associations with T2D and biomarkers of glycemic control for aggregated variants in GIGYF1, TNRC6B and PFAS. TNRC6B encodes trinucleotide repeat-containing gene 6B protein which is involved siRNA- and miRNA-mediated gene silencing [26-28]. As TNRC6B is highly constrained, one must view pLOF variants in this gene with suspicion as they may be sequencing errors or not result in a true loss of function. Additional data will be needed to verify the association of TNRC6B pLOF with T2D. Interestingly, heterozygous protein-truncating variants in TNRC6B have been implicated in developmental delay and autism spectrum disorders [29]. Consistent with this, we see an association of TNRC6B pLOF with worse performance in a cognitive test as well as with hearing impairment. Damaging missense variants in PFAS associate with decreased HbA1c levels and decreased incidence of T2D diagnosis with a large part of the signal driven by two missense variants Glu434Lys and Ala466Thr. PFAS encodes phosphoribosylformylglycinamidine synthase which is involved in de novo synthesis of the purine inosine monophosphate (IMP), a process which is required by growing and proliferating cells [30]. A mechanistic link to glucose homeostasis or diabetes is not apparent but PFAS may have roles beyond purine biosynthesis as it interacts with and deamidates other proteins [31]. PFAS is ubiquitously expressed [19, 32].
We focused our analysis on understanding the consequences of GIGYF1 pLOF as it strongly associated with glucose, HbA1c and T2D. GIGYF1 encodes a protein that was initially identified for its binding to the adapter protein GRB10 which negatively regulates both the insulin and IGF-1 receptors [33]. Transfection of cells with GRB10-binding fragments of GIGYF1 lead to greater activation of both the insulin and IGF-1 receptors [34]. This supports a hypothesis whereby GIGYF1 enhances insulin signaling by reducing the negative regulation of the insulin receptor by GRB10. When GIGYF1 is reduced, as is the case in individuals carrying pLOF variants, GRB10 presumably inhibits insulin signaling to a greater degree thereby reducing the action of insulin in its target tissues and leading to increased risk of T2D. However, the exact mechanistic details of these interactions remain to be determined. GRB10 variants have also been reported to associate with glycemic traits although interpretation of these results is complicated by imprinting [35]. GIGYF1 is broadly expressed with high levels observed in endocrine tissues, pancreas and brain [19, 32]. GIGYF1 and the related protein GIGYF2 have also been implicated in translational repression [36] and translation-coupled mRNA decay [37] suggesting biological roles beyond regulation of insulin and IGF-1 receptor signaling.
PheWAS of GIGYF1 pLOF revealed a strong association with decreased cholesterol levels reflecting altered energy homeostasis in carriers. An inverse relationship between glucose and cholesterol levels has been observed for variants in other genes [38]. We also observed several associations that could reflect complications of diabetes in GIGYF1 pLOF carriers including increased cystatin c levels and increased diagnosis of urinary disorders suggesting renal complications as well as syncope and collapse which may be a side-effect of hyperglycemia and/or hypoglycemia in diabetics. Other associations may reflect poor health in carriers including decreased grip strength and decreased peak expiratory flow. GIGYF1 pLOF also associated with decreased mean corpuscular hemoglobin levels and increased diagnosis of anemia as well as increased emphysema diagnosis. The biological basis for these associations is not clear. GIGYF1 is highly expressed in lung [19, 32] although the emphysema association is driven by small numbers of individuals, so replication is required.
GIGYF1 pLOF associated with a 4.5-fold increased risk of hypothyroidism and GIGYF1 is highly expressed in thyroid [19, 32] consistent with a biological function in this tissue. IGF-1 and insulin have been implicated in the proliferation of thyroid cells which may, in part, explain the association with thyroid dysfunction [39-41]. An alternative explanation is that GIGYF1 contributes to thyroid function by affecting secretion of thyroid stimulating hormone in the anterior pituitary gland. Damaging variants in GIGYF1 have recently been implicated in conferring risk for developmental delay and autism spectrum disorders [42]. Consistent with this, we see an association of GIGYF1 pLOF with increased time to complete a cognitive test. It may be that metabolic aberrations in carriers affect cognitive performance, that brain development is altered due to perturbation of IGF-1 signaling, or that other functions of GIGYF1 such as regulation of mRNA expression and decay are responsible for cognitive phenotypes.
Replication of associations is a challenge in rare variant analysis. The UKBB dataset used consists of exomes and baseline biomarker measurements for 363,977 individuals which is, to our knowledge, the largest dataset of its kind available. We replicated the majority of our associations with glucose and HbA1c levels, including those for GIGYF1 pLOF, using independent measurements from primary care data. Additionally, we turned to common genetic variants to further investigate the role of the GIGYF1 locus in diabetes. Non-coding variants at the GIGYF1 locus associated with glucose levels and T2D, and we replicated these findings in independent datasets. These variants associated with increased GIGYF1 expression but a lower risk of T2D. This direction of effect is consistent with what we see for the pLOF variants – reduced levels of GIGYF1 increases diabetes risk but increased levels of GIGYF1 are protective.
We assessed the impact of pLOF and damaging missense variants in approximately 17,000 genes on glycemic traits and uncovered a hitherto unappreciated role for GIGYF1 in regulating blood sugar and protecting from T2D. By highlighting the importance of GIGYF1 and GRB adapter proteins in modulating insulin signaling this finding may lead to new therapeutic approaches for the treatment of diabetes. Discoveries such as this are only possible by combining health-related data with the sequencing of rare variants on a biobank scale.
Methods
The UK Biobank resource and data access
The UK Biobank (UKBB) recruited ∼500,000 participants in England, Wales, and Scotland between 2006 and 2010 [43]. Written informed consent was obtained from all participants. Phenotypic data available includes age, sex, biomarker data and self-reported diseases collected at the time of baseline assessment as well as disease diagnoses from inpatient hospital stays, the cancer registry and death records obtained through the NHS. Approximately half of the participants also have diagnoses from primary care available. Array genotypes are available for nearly all participants and exome sequencing data is available for 454,787 participants. The data used in this study were obtained from the UKBB through application 26041. All phenotypic data and array genotypes are accessible through application to UKBB. Currently, exome sequencing data for ∼200,000 participants is available [44]; the remainder of the exome data is scheduled for public release in 2021.
Population definition and PC calculation for subjects with exome data
Subject quality control was performed by Regeneron Genetics Center (RGC) and removed subjects with evidence of contamination, unresolved duplications, sex discrepancies and discordance between exome sequencing and genotyping data. Genetic relationships between participants were determined by RGC using the PRIMUS program [45]. For the unrelated subset all first- and second-degrees relatives and some third-degree relatives were excluded.
Populations were defined through a combination of self-reported ethnicity and genetic principal components. We selected the unrelated individuals who identify as White (Field 21000) and ran an initial principal component analysis (PCA) on high quality common variants using eigenstrat [46]. SNPs were filtered for missingness across individuals < 2%, MAF > 1%, regions of known long range LD [47], and pruned to independent markers with pairwise LD < 0.1. We then projected the principal components (PCs) onto related individuals and removed all individuals +/- 3 standard deviations from the mean of PCs 1-6. A final PC estimation was performed in eigenstrat [46] using unrelated subjects. We then projected related individuals onto the PCs.
Exome sequencing and variant calling
DNA was extracted from whole blood and was sequenced by the RGC as described elsewhere [48]. Briefly, the xGen exome capture was used and reads were sequenced using the Illumina NovaSeq 6000 platform. Reads were aligned to the GRCh38 reference genome using BWA-mem [49]. Duplicate reads were identified and excluded using the Picard MarkDuplicates tool (Broad Institute). Variant calling of SNVs and indels was done using the WeCall variant caller (Genomics Plc.) to produce a GVCF for each subject. GVCFs were combined to using the GLnexus joint calling tool [50]. Post-variant calling filtering was applied using the Goldilocks pipeline [48]. Variants were annotated using the Ensembl Variant Effect Predictor v95 [51] which includes a LOFTEE plug-in to identify high confidence (HC) pLOF variants [13].
Combined Annotation Dependent Depletion (CADD) scores were generated using the Whole Genome Sequence Annotator (WGSA) AMI version 0.8.
Phenotype definitions
Blood biochemistry values were obtained for glucose (Field 30740) and HbA1c (Field 30750) and inverse rank normalized using the RNOmni R package [52], resulting in an approximately normal distribution.
For disease diagnoses, ICD10 codes were obtained from inpatient hospital diagnoses (Field 41270), causes of death (Field 40001 and 40002) and the cancer registry (Field 40006). Diagnoses also included additional hospital episode statistics (HESIN) and death registry data made available by UKBB in July 2020. T2D was defined as ICD10 E11.
For phenome-wide analyses, a selection of quantitative traits was obtained from other fields, encompassing anthropometric measurements, blood counts, as well as blood and urine biochemistry. Beyond these measurements, we selected additional quantitative traits found to be heritable (h2 significance flagged as at least “nominal” with a confidence level flagged as “medium” or “high”) by the Neale lab [25], using PHESANT to transform values to quantitative traits when necessary as they describe. These included the results of cognitive tests. All quantitative traits were inverse rank normalized using the RNOmni R package. [52]. For burden testing, we required at least 10 carriers to have measurements. We also tested associations with ICD10-coded diagnoses (using 3 character codes) that had more than 500 cases in the White subset of participants with exome data and at least one expected case carrier based on variant frequency and disease prevalence.
Glucose and HbA1c values were also extracted from primary care data available for about half of the cohort using the following read codes. Glucose: read 2 codes 44U..,44g.., 44g1.,44TJ.,44f..,44TK.,44f1.,44g0.,44f0. and read 3 codes XM0ly, X772z, XE2mq; HbA1c: read 2 codes 42W5., 44TB., 66Ae0, 44TC., 42W4. and read 3 codes XaPbt, X772q, XaWP9, XaBLm, XaERp.
Values were converted to IFCC units where necessary. Aberrantly high (> 50 mmol/L for glucose, > 200 mmol/mol for HbA1c) and values of zero were excluded. The mean measurement per individual was then taken and inverse rank normalized prior to association testing.
Gene-based association testing
For gene-based tests, autosomal rare pLOF variants were identified as follows; LOFTEE high confidence LOFs, MAF ≤ 1%, missingness across individuals ≤ 2%, HWE p-value ≥ 10−10. Predicted damaging missense variants were defined as missense variants with a CADD PHRED-scaled score ≥ 25, MAF ≤ 1%, missingness across individuals ≤ 2%, HWE p-value ≥ 10−10. Only genes with more than one pLOF variant or damaging missense variant were tested.
Burden testing was performed unrelated White subset using glm in R, using a gaussian model for quantitative traits and a binomial model for case-control analyses. Genotype was coded as 0 (no variant) or 1 (any number of variants). We adjusted for age, sex and the first 12 PCs of genetic ancestry in the regression. Additionally, when testing for association with disease diagnoses, we included country of recruitment as a covariate as the time of available follow-up differs between England, Scotland and Wales. Recruitment country was defined using the location of the relevant UKBB recruitment center (Field 54). Associations were later confirmed using just participants recruited in England. For case-control analyses we only ran tests where there was at least one expected case carrier based on variant frequency and disease prevalence. For quantitative traits we required at least 10 carriers to have measurements.
For glucose and HbA1c, to convert effect sizes from normalized values back to measured units, the estimates from the regression were multiplied by the standard deviation of these traits in the entire cohort.
SAIGE-Gene was run using the SAIGE R package (v0.36.5) [53] using settings recommend by the developers and related individuals were included.
Manhattan plots were created using the R Package CMplot (https://github.com/YinLiLin/R-CMplot).
Array association testing
Genotypes were obtained through array typing and imputation as described previously [54]. Population definition and PC estimation for individuals with array data was performed as previously described [55]. We tested all variants with imputation quality score (info) ≥ 0.8 and minor allele frequency (MAF) ≥ 0.1% in a 200Mb region around GIGYF1 for association with glucose, HbA1c, T2D and hypothyroidism. Association analyses were performed using an additive model in PLINK adjusting for age at recruitment to UKBB, sex and the first 12 PCs of genetic ancestry. We also adjusted for country of recruitment where appropriate. The most significant variant with info > 0.95 was selected as the lead variant at the locus.
We replicated the association of rs221783 with glucose using available summary statistics for Biobank Japan for the trait “blood sugar” (http://jenger.riken.jp/en/result) [20]. We replicated the association of this variant with T2D diagnosis using summary statistics from FinnGen release 3 for the phenotype “E4_DM2” (https://www.finngen.fi/en/access_results). The effect allele in these datasets was the alternate allele “C”. For consistency with the UKBB associations we have shown the effect for the “T” allele.
Meta-analysis of the UKBB and replication dataset association results was performed with the METAL software package using the classical method [56].
Region plots were created using LocusZoom [57]. LD calculations were performed in the White population for array variants in a 500kb sliding window as follows; we extracted genotypes with info > 0.9, rounded them to whole numbers, mean-imputed missing genotypes and used the R “cor” function to compute R which was then squared to get an R2 value.
Gene expression and eQTL analysis
The expression of GIGYF1 in various tissues was assessed using the GTEx portal (accessed 08/04/2020) [19] and Human Protein Atlas (http://www.proteinatlas.org) [32]. eQTL data for rs221783 was obtained from GTEx v8. For each tissue of interest, the best eQTL for GIGYF1 was identified (GTEx v8 “eGene”). R2 for rs221783 and the best GIGYF1 eQTL was calculated as described above.
Data Availability
The data used in this study were obtained from the UKBB through application 26041. All phenotypic data and array genotypes are accessible through application to UK Biobank. Currently, exome sequencing data for ∼200,000 participants is available; the remainder of the exome data is scheduled for public release in 2021.
Author Contributions
A.D, L.W., M.P., A.F.C. and P.N. performed computational analyses; A.D. wrote the manuscript; all authors interpreted results and edited the manuscript.
Competing Interests
The authors are all employees of Alnylam Pharmaceuticals.
Acknowledgements
We would like to thank the participants and researchers of UK Biobank for creating an open-access resource. We thank Regeneron Genetics Center, the UK Biobank Exome Sequencing Consortium and UK Biobank for facilitating exome sequencing of participants. We also thank the participants and investigators of the FinnGen study and Biobank Japan. Data management and analytics were performed using the REVEAL/SciDB translational analytics platform from Paradigm4.
References


