
Abstract
Introduction Contact patterns are an important determinant of infection transmission. CONQUEST (COroNavirus QUESTionnaire) is an online survey of contacts for University of Bristol (UoB) staff and students. Results from 23/06/2020-24/11/2020 are used to investigate contact patterns among staff/students throughout various UK COVID-19 guidance periods.
Methods Responses captured self-reported contacts on the previous day, with COVID-19 guidance periods split: post-first lockdown (23/06/2020-03/07/2020), relaxed guidance period (04/07/2020-13/09/2020), “rule-of-six” period (14/09/2020-04/11/2020), and the second lockdown (05/11/2020-25/11/2020).
Results 722 staff (4199 responses) (mean household size: 2.6) and 738 students (1906 responses) (mean household size: 4.5) were included in the study. For staff, median contacts on the previous day were higher in the relaxed guidance and “rule-of-six” periods (3) than the post-lockdown and second lockdown periods (2). Mean contacts were higher during these two middle periods (4-6 per week) than the post-lockdown and second lockdown periods (~3). Mean contacts dropped between the last two periods (5.4 to 3.3), driven by a mean reduction in contacts in non-home/university locations (2.9 to 1.2).
Few students responded until October. After 05/10/2020, the median was 2 and the mean was around 6-7 each week, until the second lockdown when it dropped to ∼4. Mean number of contacts dropped between the last two periods (6.3 to 4.0) driven by a reduction in all contact types, including UoB contacts (3.5 to 2.5).
Discussion The mean and median number of contacts for UoB staff and students were low compared to pre-COVID-19 studies throughout the survey period and lowest during the second lockdown.
Background
Due to the COVID-19 pandemic, different countries implemented different laws in 2020 to limit people’s contacts and therefore COVID-19 transmission1. In the UK, the first lockdown implemented on the 23rd March 2020, legally restricted movement of people from their place of residence, with movement only being permittable when seeking healthcare, to exercise (alone/with household members), to purchase necessities, or to assist vulnerable persons. Subsequently the laws were eased from the 1st June 20202. However, on September 14th the guidance was again tightened and then England entered a second lockdown on November 5th, which involved shutting down non-essential shops, working from home where possible, restricting gatherings to two people meeting outside in a public place, but with schools and universities remaining open3. Before the second lockdown, some UK areas had restrictions tightened above the national guidance due to higher transmission rates through the implementation of tiers or legislation in devolved nations, but Bristol and the Southwest of England remained in the lowest tier throughout this period due to the low overall COVID-19 transmission rate4.
The first lockdown forced universities to move teaching online5, including the University of Bristol (UoB). Universities began the 2020/21 term in the autumn, when reported daily COVID-19 cases were rising nationally6. Students migrated from around the UK and abroad to attend the new term. Although, university students are mostly young and are therefore less likely to be severely affected by COVID-19 morbidity and mortality than other groups, some may still be medically vulnerable7. Meanwhile, university staff are more representative of the working-age general population and tend to be older and are therefore more likely to be affected by COVID-19 morbidity and mortality.
For UoB’s 2020/21 term, students returned towards the end of September. The UoB adopted a “blended” teaching approach, including a mixture of face-to-face and online teaching. Students living in university halls of residence were divided into households (“living circles”) and were instructed not to host non-residents in their flat but government social distancing guidelines applied outside the flat8. Students that test positive are required to isolate along with their household8.
Despite COVID-19 restrictions, outbreaks of COVID-19 occurred across many UK universities during autumn 20209. For UoB, there were outbreaks among students but few cases amongst staff: UoB reported 1722 positive tests among students from 14th October - 1st November, roughly 7% of students, compared with 48 positive tests among staff (<1%)8. Hundreds of students (mostly undergraduates) in university-owned halls of residence were told to self-isolate during the beginning of term.
There is little evidence to quantify the effect that the various COVID-19 restrictions in the UK have had on the number of contacts of individuals: a key driver of COVID-19 transmission. On the 23rd June, we launched an online survey detailing the contacts and behaviours of staff and students at the UoB, with the survey continuing into the autumn term. We aimed to investigate whether there were differences in contact patterns for UoB staff and students between the periods before and during the autumn 2020 COVID-19 lockdown, and to quantify these differences.
Methods
CONQUEST (COroNavirus QUESTionnaire) is a survey that started on 23/06/2020 asking about contacts, behaviour, and potential SARS-Cov-2 symptoms for staff and students at UoB. Survey participants complete an initial questionnaire including questions on background demographics and then have the option to fill out a shorter, recurring version of the questionnaire on contacts, symptoms, and whether they have had COVID-19. The recurring questionnaire was initially every 14 days and then every 8 days as of 13/09/2020 (see supplement for more details). It was not possible to advertise the survey to students at the end of the 2019/2020 academic year via direct email and only light touch promotion was granted for social media. The survey was advertised to staff via email and newsletters during June and July 2020. The students were on summer vacation until the end of September when they returned to the university for the 2020/2021 academic year. At this point, approval was granted for a larger targeting campaign for students, which the University Communications team assisted with. Here, we present the data up to 25th November 2020.
Survey
Survey data were collected using UoB’s REDCap Electronic Data Capture tools10,11. The initial survey captured demographic information on participants, including data on age, gender, ethnicity, whether they were part of a high-risk group, whether they were a student, a member of staff, or both, whether they were an undergraduate or postgraduate, their study year, their UoB department, their residence, and the age of their household members. Additionally, participants were asked about symptoms in the last 7 days, whether they had sought medical attention for these symptoms, whether they had been self-isolating in the last 7 days, and their COVID-19 status.
Participants were asked about contacts they had had on the previous day, which were split into three types:
Individual contacts - those who they spoke to in person one-on-one, including those in their household and support bubble.
Other contacts - if they spoke in person to many people one-on-one in the same setting (but they did not have the opportunity to speak to each other), for example, as part of working in a customer service role in a shop.
Group contacts - large groups of individuals in the same setting (for example, sports teams, tutorials, lectures, religious services, large gatherings with friends and family).
Further information on the questions asked about each of these contact types is given in the supplementary materials along with the full questionnaire. On 13/09/2020 amendments were made to the questionnaire, which are described in the supplementary materials. Data are available from the corresponding author.
Inclusion criteria
We excluded responses where the survey was incomplete. We only include respondents that live in the Southwest of England as this region (including Bristol) remained in the UK government COVID-19 tier-1 throughout the existence of these tiers for the study period presented here.
COVID-19 guidance periods
Table 1 presents key COVID-19 guidance implementation dates and dates relating to the CON-QUEST survey. The periods of COVID-19 restrictions were stratified as follows:
Post lockdown: Survey start (23/06/2020) to the day before the 2nd, more lenient set of COVID-19 regulations were implemented (03/07/2020).
Relaxed period: 2nd COVID-19 regulations implementation (04/07/2020) to the day before the 4th set of COVID-19 laws were implemented (13/09/2020).
“Rule-of-six” period: 4th COVID-19 regulations (14/09/2020) to the day before the 2nd lockdown (04/11/2020).
2nd Lockdown: 2nd lockdown start (05/11/2020) to data cut-off (25/11/2020).
Regression analyses
We investigated the associations between the overall number of contacts on the previous day with demographics and behaviours using univariable and multivariable negative binomial regression modelling, stratified for staff and students. For staff, these models included variables on: COVID-19 guidance period, age group (17-24, 25-44, 45-64, 65-79, 80+ years), gender (male, female/other - the “other” category had too few individuals and so were grouped with the largest category), symptoms during the previous week, cardinal symptoms (loss of taste or smell, fever, persistent cough13) during the previous week, self-isolating in the prior week, self-reporting being in a high-risk group, household size (1, 2-3, 4-5, 6-9, 10+, missing), and COVID-19 status (never had, previously thought they had it, previously tested positive for it, thought they had it in the last 2 weeks, tested positive for it in the last 2 weeks). For students we additionally adjusted for under/postgraduate status, current study year (1, 2, 3, 4+), and residence type (catered halls, self-catered halls, shared house/flat, living with family, living alone, other). Note that all postgraduates were assigned to the 4+ year group to differentiate them from undergraduates in their first year of study.
Weighting
For students, initial analyses suggested males and undergraduates were underrepresented in the survey responses when compared to the overall UoB student population. Student weights were based on UoB data on student demographics, to make the dataset more representative of the university’s student population in terms of gender and under/postgraduate status. After initial analyses looking at representation of the sample, staff data were weighted by gender using University gender - data. The supplementary materials describe the weighting in further detail.
Ethical approval
Ethical approval was granted on the 14th May 2020 by the Health Sciences University Research Ethics Committee at the University of Bristol (ID 104903), with four amendment requests approved on the 22nd May 2020, 9th June 2020, 27th August 2020 and 7th September 2020. The purpose of the amendments were either to update the relevance of the questions or to make the survey faster and easier to complete. All research was performed in accordance with the University of Bristol Ethics of Research Policy and Procedure (http://www.bristol.ac.uk/media-library/sites/red/documents/research-governance/Ethics_Policy_v8_03-07-19.pdf). Participants were aged 18 or older, voluntarily opted-in to the study and were required to give their informed consent before starting the survey.
Results
Included over the entire survey period were 722 staff, with repeat questionnaires leading to 4199 responses, whilst for students there were 738 participants and 1906 questionnaire responses. The median ages of the staff and students were 42 (interquartile range [IQR]: 34-51) and 22 (IQR: 19-25), respectively. The median household size for staff was 2 (IQR: 1-3; mean: 2.6) and 3 for students (IQR: 2-5; mean: 4.5). Most staff participants were recruited between 23rd June - 13th September (95.3%), whilst 20.7% of students were recruited between these dates (table 2). Due to the communications campaign, most students (78.0%) were recruited between the 14th September and 4th November, whilst 4.3% of staff were recruited during this period. In the weighted analyses there were 1623 staff responses between 14th September and 4th November and 628 from the 5th November to the 24th November. For the students, these numbers were 1314 and 333, respectively.
Contacts over time
Figure 1 shows the mean, median, and IQR of the number of contacts reported on the previous day, stratified by week. For staff, among whom there were high response numbers throughout the entire analysis period, the median number of contacts rose from 2 between 23rd June and 12th July, to 3 between the 13th July and 8th November and reduced to 2 after this. This rise and fall in the median number of contacts correlates with the different guidance periods, with median contacts higher in the relaxed guidance period and the “rule-of-six” period than the post-lockdown period and the second lockdown period. Similarly, the mean number of contacts appeared to be higher during these two middle periods, usually varying between 4 and 6 but was around 3 in the post-lockdown and second lockdown periods.

Weighted mean and median (with interquartile ranges) number of contacts for the previous day, stratified by week for a) staff; and b) students. For students the blue line indicates the start of the mass communications campaign*.
For students, after the 5th of October, when there were high numbers of responses leading to clearer interpretation, the median was 2. After October 5th, the mean was around 6-7 each week, until the introduction of the second lockdown when it dropped to around 3.
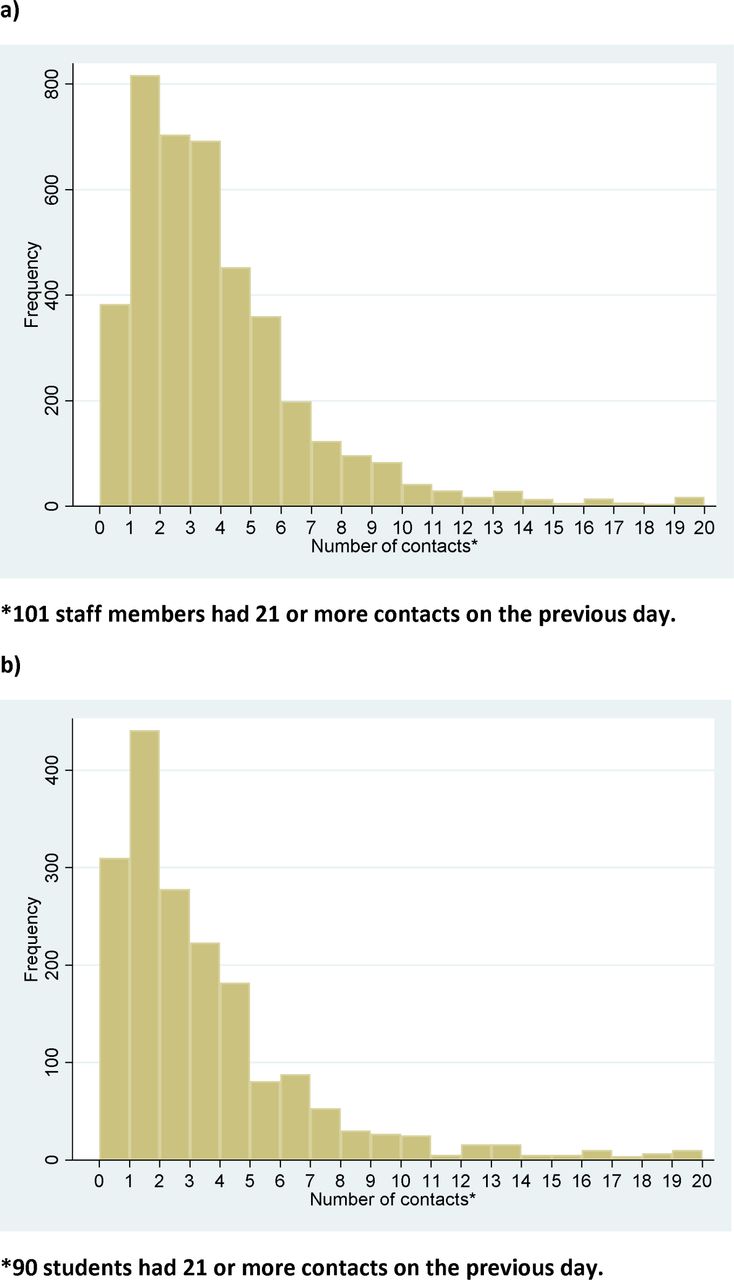
For both staff and students there was a large difference in the mean and median contacts, as some individuals had large numbers of contacts (see figure 2). Supplementary table 2 shows that there were lower numbers of survey responses at the weekend, but the reported number of contacts was similar for each day. Supplementary figure 1 shows a histogram of contacts, stratified by staff and students.
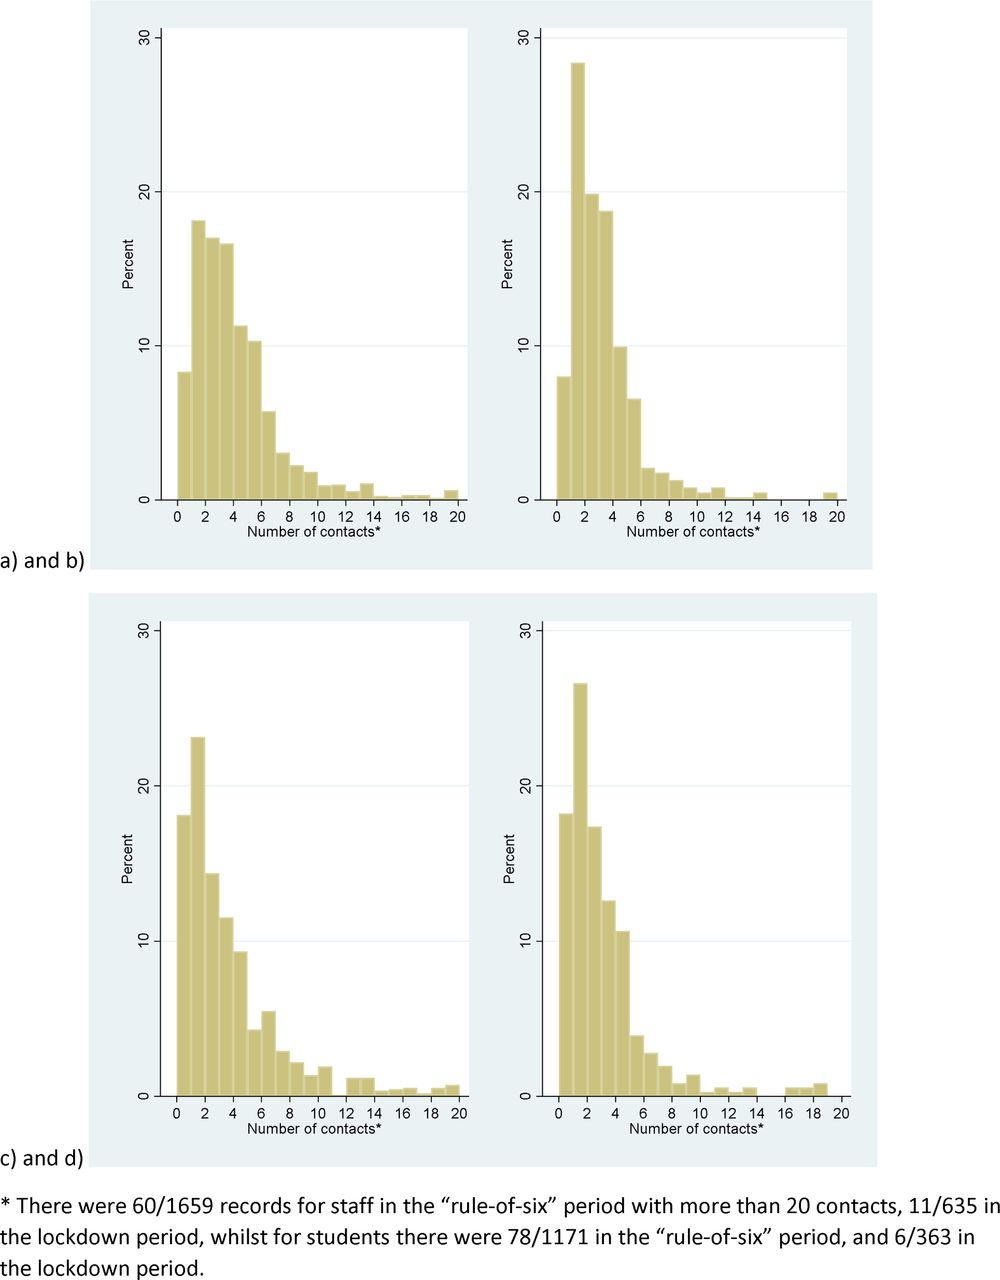
Weighted histograms of the number of contacts on the previous day for staff in a) the “rule-of-six” period (14th Sept-4th Nov) before lockdown; and b) for the Autumn lockdown period (5th Nov – 25th Nov); and the same graphs, respectively for students: c) and d).
“Rule-of-six” period versus second lockdown
Figure 2 shows that there was a shift towards higher proportions of both staff and students having lower contacts in the second lockdown period than in the “rule-of-six” period. Table 3 compares the number of contacts and types of these contacts for staff and students during the “rule-of-six” and second lockdown periods. For staff, the mean overall contacts dropped from 5.4 to 3.3, with a large part of this drop being driven by group contacts falling from a mean of 2.1 to 0.7 (this includes those with 0 group contacts). The mean individual contacts of staff dropped from 2.8 to 2.3, but there was a similar number of these contacts involving touch in both periods (1.4 and 1.3), similar mean numbers of household member contacts (1.4 and 1.4), frequent contacts (1.5 and 1.5), and contacts made at home (1.6 and 1.7). Staff had similar numbers of contacts made at the university over both periods (means 0.5 and 0.5) and similar numbers of UoB contacts (0.8 and 0.7). The mean number of contacts made at locations other than home and university dropped for staff between the two periods, from 2.9 to 1.2.
*”Individual” contacts were the people that the participant spoke to in person one-on-one, including those in the participant’s household and support bubble. “Group” contacts were the contacts that the participant had with large groups of individuals in the same setting (for example, sports teams, tutorials, lectures, religious services, large gatherings with friends and family). “Other” contacts were the many people participants spoke to one-on-one in the same setting where the contacts did not have the opportunity to speak to each other (for example, as part of a customer service role in a shop). Not all of the contact types were asked for each category of contacts, so are only comparable to the associated categories indicated here.
For students, the mean overall number of contacts dropped from 6.3 during the “rule-of-six” period to 4.0 during the second lockdown. Between these two periods, mean individual contacts dropped slightly from 2.3 to 2.0, group contacts dropped from 2.6 to 1.3, and other contacts dropped from 1.3 to 0.6. The mean number of student contacts involving touch was lower than for staff but was consistent across both periods (0.8 and 0.8). Students reported a similar mean number of household member contacts over both periods (1.5 and 1.4) as staff, as well as similar numbers of frequent contacts (1.5 and 1.4), and contacts made at home (1.7 and 1.6). Students had higher mean numbers of contacts made at the university across the two periods than staff (1.1 and 1.0). Students also had higher mean numbers of UoB contacts than staff, however, these dropped between the two periods from 3.5 to 2.5, whilst contacts at locations other than home or university were lower than for staff and dropped between the two periods from 2.2 to 0.9.
Groups larger than 6
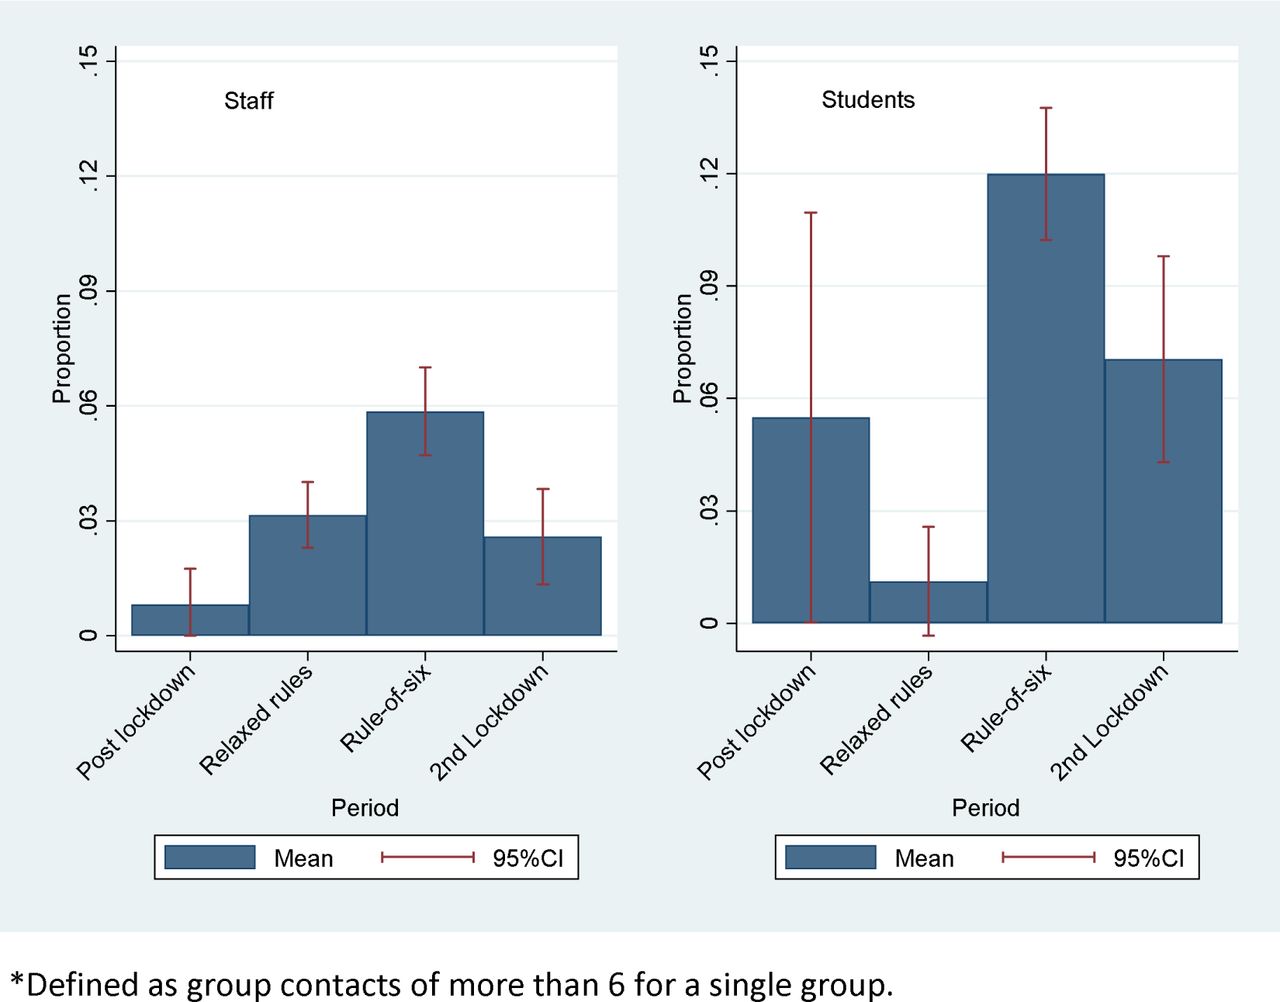
Figure 3 shows the proportion of respondents that met with groups larger than 6 on the previous day for each guidance period. For staff the proportion was lowest in the post-lockdown period (0.01; 95% confidence interval [95%CI]: 0.00-0.02) and then rose in the relaxed guidance period (0.03; 95%CI: 0.02-0.04) and again in the “rule-of-six” period (0.06; 95%CI: 0.05-0.07), before falling during the second lockdown (0.03; 95%CI: 0.01-0.04). For students, there is large uncertainty in the first two periods due to a lack of responses, but the proportion reporting meeting with groups larger than 6 dropped between the “rule-of-six” period (0.12; 95%CI: 0.10-0.14) and the second lockdown period (0.07; 95%CI: 0.04-0.10), although this was higher than for staff.

Weighted proportion of respondents that met with groups larger than 6 on the previous day, stratified by staff and students, and by COVID-19 guidance period
Regression
Table 4 contains the results of the multivariable regression analyses on the number of contacts on the previous day for staff and table 5 for students. For staff and students, the number of contacts was higher in the “rule-of-six” period than in the other periods and was lower in weeks they had been isolating. A detailed description of the regression analysis results is given in the supplementary materials.
Discussion
For both staff and students at UoB, multivariable regression indicated that the number of contacts on the previous day was higher in the “rule-of-six” period (14/09/2020-04/11/2020) than in the post-lockdown period (23/06/2020-03/07/2020), the relaxed guidance period (04/07/2020-13/09/2020), and the second lockdown (05/11/2020-25/11/2020). For staff, median contacts remained low throughout the analysis period but were higher in the relaxed guidance and the “rule-of-six” periods (3) than the post-lockdown and second lockdown periods (2) when guidance was stricter. Mean contacts were higher during these two middle periods, usually varying between 4-6 each week but were around 3 in the weeks during the post-lockdown and second lockdown periods, with the difference between the median and means due to some individuals reporting many contacts. The drop in mean contacts between the last two periods (5.4 to 3.3) for staff was mostly driven by a mean reduction in contacts in locations other than home or university (from 2.9 to 1.2), including group contacts (from 2.1 to 0.7), whilst there was a similar number of household member contacts between both periods (1.4 and 1.4) and those made at the university (0.5 and 0.5). For students, there were few responses until October when a mass communications campaign was launched. After 05/10/2020, when response numbers were high, the number of contacts on the previous day remained low, the median was 2 and the mean was around 6 or 7 each week, until the second lockdown when it dropped to around 3. The lower median of contacts during the early weeks of term for students than staff was perhaps due to a high percentage of students having to isolate: both students and staff that were isolating had lower numbers of contacts than those not isolating. The drop in mean number of contacts for students between the last two periods (6.3 to 4.0) was driven by a reduction in all contact types except for those made at home (1.7 to 1.6). Students also had higher mean numbers of UoB contacts than staff, however, for students these dropped between the two last periods from 3.5 to 2.5. For both staff and students, the proportion meeting with groups larger than 6 dropped between the “rule-of-six” period and the second lockdown period, although was much higher for students than for staff, possibly as many students live in households of more than 6 people.
Comparison with other literature
Unsurprisingly given the COVID-19 restrictions in place at the time of our survey, we found for each guidance period studied a lower mean number of daily contacts among our staff (3.1, 4.4, 5.4, and 3.3, respectively) and student (4.5, 3.8, 6.2, and 4.0, respectively) populations than was found in the Warwick social contacts survey from 200914,15, either among their entire sample (26.8) or among the students in that sample (29.9).
The students in the Warwick social contacts survey data had more home contacts (3.5) than other participants (2.3), whilst the majority of contacts for students (82%, 95% confidence interval: 79%-86%) were either at home or related to the university, with students reporting 20 (95% confidence interval: 14.1-28.8) university-related contacts. Similarly, we found that a high percentage of the contacts of students were either at home or university (∼72%) and that our staff (comparing with the Warwick survey’s “other participants”) had 1.6 home contacts. However, we found that students had a mean of 1.7 contacts at home and that the mean was only 2.5 university contacts for students, possibly indicating that the national and university guidance was successful in reducing contacts. Meanwhile, the POLYMOD social contacts survey16 found a lower mean than Warwick social contacts survey (11.7 contacts per day per person) in their Great Britain sample (average age ∼30), but still much higher than the mean values we recorded for either staff or students.
Strengths and limitations
The strengths of this survey include the sample size, longitudinal format, and anonymous nature that enabled us to capture self-reported contact patterns of a large number of staff and students during a key period in the UK’s COVID-19 pandemic. It provides a unique data source on student and staff behaviour during the pandemic for informing public health action and mathematical models. Results for students are likely generalisable to other UK city-based universities in areas that were not put in higher tiers, as well as to some city-based universities in other countries. Meanwhile, the staff results are likely generalisable to a working cohort of the general population, due to their age profile. Many survey questions were designed to be comparable to existing contact surveys14-16.
However, this study has some limitations. The survey started after the first lockdown period, so we are unable to compare whether contacts during the second lockdown were higher than in the first. Also, we cannot ascertain what caused the changes in numbers of contacts. The major limitation of the study is that we do not have many students for the early period of the survey, as data collection could not be scaled up until October, therefore, we only have robust data on students from October onwards. Additionally, those with lots of contacts or with little available time may have been deterred from completing it, which may mean it is not representative. We include clear instructions defining “contacts” in the survey; however, people may interpret the instructions differently and so there could be variation in what people considered a contact to be.
Selection bias for those who particularly engaged in health-seeking behaviours may have occurred, as those that are less likely to abide to the guidelines may also be less likely to fill out the survey. However, we did capture individuals reporting large numbers of contacts. There will inevitably be issues regarding recall bias, and there will also likely be issues with response bias, leading to inaccurate or false responses.
Implications
This study is important for several reasons. Firstly, it comes at a unique time when a lockdown has been implemented to reduce contacts between individuals. However, the number of reported daily cases of COVID-19 is still high6. Bristol went into the second lockdown covered by this study in the lowest tier of COVID-19 restrictions and came out in (as with much of the country) in the highest tier, with a third lockdown then implemented in 20214. UoB, as with many other UK universities, is preparing for to manage a possible mass migration events of its students back to university when the current lockdown is relaxed, with the potential for COVID-19 transmission to escalate due to enhanced population mixing17. Secondly, the setting is important due to its uniqueness, as universities were allowed to carry on teaching throughout the lockdown, meaning that some mixing between households still occurred3. As well as its uniqueness, the setting is also important for its generalizability, as university staff are likely relatively representative of many working age populations in age structure. It is important to be able to understand the effect of the COVID-19 guidance changes, particularly lockdowns, on people’s behaviour, for any future pandemics that could occur. We show that on average there was high adherence to the guidance throughout the survey period for both staff and students, despite students receiving negative media coverage during the pandemic, possibly driven by a small minority of students flouting the regulations18. The average number of contacts remained low throughout the study and few people were meeting groups larger than 6, despite many students living in large households. There was a reduction in the number of contacts during the second lockdown, returning them to the levels in the period after the first UK lockdown.
Data Availability
Data are available from the corresponding author.
Supplementary materials
Further survey information
Participants who had signed up to repeat questionnaires were sent an email every 14 days (changing to every 8 days from 13/09/2020 onwards to capture more information ahead of the return to campus of the students) with a unique link that allowed their responses to be anonymously connected to those from previous CON-QUEST questionnaires that they had responded to. The reminder emails with the survey links were sent regardless of whether participants have filled in surveys from previous reminder emails or when they responded to them.
For “individual” contacts (contact type 1), participants were asked about where this contact was made, whether this contact was indoors, outdoors or both, the duration of this contact, whether this contact involved touch, whether this contact studied/worked at the university (and if so which faculty and school they were associated with), their age, whether they were part of their household, and how often they would usually have contact with this person.
For “other” contacts (contact type 2), no additional questions were asked, as it was expected that there often would be a large number of “other” contacts and participants would not be motivated to answer additional questions on them.
For “group” contacts (contact type 3), participants were asked how many individuals this involved, their ages, whether the majority were from UoB (and if so the main faculty and school this group was associated with), where the group met, whether this was indoors, outdoors or both, whether the members of the group talked to each other and how long the contact with this group was for.
Additionally, participants were asked about symptoms in the last 7 days, whether they had sought medical attention for these symptoms, whether they had been self-isolating in the last 7 days, and their COVID-19 status. For some analyses, the variable on whether people have had COVID-19 (no, yes confirmed by a test, yes a doctor suspected so, yes my own suspicions) was combined with the date that they had been tested or were suspected to have COVID-19. This was to create new variables on whether they had COVID-19 in the two weeks prior to survey completion, or before this.
Survey amendments on 13/09/2020
Rewritten and shortened the introduction with the purpose of making it more accessible and easier to read.
Updated question on those at higher risk of severe illness to be in line with the names used for
at risk groups now used by the NHS
Added in a further question on job type for staff and expanded the staff faculty and school question to include directorates and institutions. This is to be more inclusive and to distinguish those who could be at higher risk of COVID-19 due to their job type e.g. Staff who work in Operational services can work across multiple buildings and have more contacts with others
New question on whether working from home is feasible
Adapted the questions on where students live to make it more relevant and up to date
Moved the question on which country you are living in and optional postcode question to the repeat questionnaire, since when people complete the repeat questionnaire they might be in different locations and we do not want the new data they are entering on contacts and symptoms to be related to an incorrect location.
Changed the wording on halls of residence, since there are now going to be official “living
circles” which are like households within halls
Removed question “Is your household made up of different people as a result of the COVID-19 pandemic?” and the follow up question, as well as the questions on “Due to COVID-19 have you, or would you consider taking the following action when the University is open?” since this data is no longer important to collect.
New question on support bubbles – these were not in practice at the time of releasing the
survey, however, this is important contact data to collect.
Deleted question on willingness to use symptom tracker apps or contact tracing apps as this is being collected in other surveys
Added in finger prick option for testing question
Added in question on transport used yesterday
Clarified time asked about for “Do you think you have had COIVD-19?”
Clarified time period for question on contact with COVID-19 case in last two weeks
Some clarifications in the symptoms question
Clarifications in the instructions for the contacts questions
Clarification in instructions after survey is submitted
Some additions of extra words to clarify questions throughout the survey
Channels for mass communication about the CON-QUEST survey to students
1st October-Halls inductions email
4th October 2020-Find your Bristol -Twitter
8th October-Find Your Bristol-Twitter and Facebook
14th October-October Student Newsletter
Other communications ongoing in October:
Find your Bristol-post to portal, email to all students on safety
Elizabeth Blackwell Institute social media
Student Union Comms Champions
Student administration shared in regular newsletters
Shared with Faculty Marketing group
Link added to the end of the Students Union welcome survey
Weighting
For students, initial analyses suggested males and undergraduates were underrepresented in the survey responses compared to the overall UoB student population. We applied weights during analyses on students, with weights based on publicly available UoB data on student demographics, to make the dataset more representative of the university’s student population – supplementary table 1.
We had separate data available for staff ages and staff gender breakdown so had to choose one. Initial investigations revealed the age breakdown in CONQUEST was more similar to that in the university than the gender breakdown (23.8% male in the survey; 45.0% male in the university data) so weighting by gender was used.
Number of contacts by day of the week

Results of regression analyses
Table 4 contains the results of the regression analyses on the number of contacts on the previous day for staff. In multivariable analysis, the number of contacts was higher in the “rule-of-six” period than in the other periods. Being aged over 65 was associated with a lower number of contacts in comparison with the 25-44 age group, whilst there was some evidence that males had lower numbers of contacts than females (adjusted incidence rate ratio [aIRR] 0.92; 95% confidence interval [95%CI]: 0.85-1.00). Staff reporting symptoms during the previous week had a higher number of contacts on the previous day than those without symptoms, aIRR 1.19 (95%CI: 1.10-1.29), whilst those with cardinal symptoms had fewer contacts, aIRR 0.71 (95%CI: 0.52-0.97). Staff that had been isolating during the previous week had lower contacts on the previous day, aIRR 0.49 (95%CI: 0.38-0.62), whilst staff that were in high-risk groups had higher contacts, aIRR 1.28 (95%CI: 1.11-1.48). Compared with staff living in a household of 2-3 people, staff with a household size of 1 had fewer contacts, aIRR 0.67 (95%CI: 0.62-0.73), whilst staff with a household of 4-5 people had more contacts, aIRR 1.31 (95%CI: 1.20-1.43). Compared with staff that had never tested positive or thought they had never been positive, staff that had previously tested positive more than 2 weeks before the survey had lower numbers of contacts on the previous day, aIRR 0.43 (95%CI: 0.21-0.88), whilst those suspecting they were positive more than 2 weeks before the survey had higher numbers of contacts, aIRR 1.16 (95%CI: 1.05-1.29).
For students, the regression analysis results are shown in Table 5. Similarly to staff, the “rule-of-six” period was associated with a higher number of contacts on the previous day than the other periods in the multivariable analysis. Higher age was associated with a lower number of contacts on the previous day. Unlike for staff, males had a higher number of contacts on the previous day than females, aIRR 1.16 (95%CI: 1.03-1.31). Postgraduates reported a lower number of contacts than undergrads, aIRR 0.54 (95%CI: 0.43-0.67), whilst students in study years 2 and 4+ had higher numbers of contacts on the previous day than students in study year 1, aIRR 1.37 (95%CI: 1.07-1.75) and 1.65 (95%CI: 1.28-2.12), respectively. Similarly to staff, students reporting symptoms during the last week had higher numbers of contacts on the previous day than those not reporting symptoms, aIRR 1.17 (95%CI: 1.04-1.33), and those isolating during the last week had fewer contacts than those that had not been isolating, aIRR 0.59 (95%CI: 0.48-0.73). As with the staff, students in high-risk groups reported higher numbers of contacts than those not in these groups, aIRR 1.21 (95%CI: 1.02-1.43). Students in households of 4-5 people had higher numbers of contacts on the previous day than those in households of 2-3 people, aIRR 1.25 (95%CI: 1.08-1.44). Students living in catered halls reported fewer contacts on the previous day than those living in a shared house/flat, aIRR 0.46 (95%CI: 0.29-0.74), whilst those living with their family had higher contacts than those in shared houses/flats, aIRR 1.47 (95%CI: 1.23-1.76). Students living alone had lower numbers of contacts than those living in a shared house/flat, aIRR 0.59 (0.47-0.76). Students that previously suspected themselves to be positive more than 2 weeks before taking the survey reported higher numbers of contacts on the previous day than those that had never tested positive nor suspected themselves of having COVID-19, aIRR 1.38 (95%CI: 1.18-1.60).
Description of Tiers in England
Following the easing of regulations after the first national lockdown, there were various local regulations introduced between July and September 2020, which were replaced on the 14th October 2020 by the tier system. This allocated regions in England into one of three tiers: Tier 1 (medium), Tier 2 (high) and Tier 3 (very high). The regulations in each tier are outlined in full the in the Statutory Instruments (https://www.legislation.gov.uk/uksi/2020/1103/made, https://www.legislation.gov.uk/uksi/2020/1104/made, https://www.legislation.gov.uk/uksi/2020/1105/made) and are summarized here in Supplementary table 3. Bristol remained in Tier 1 from the 14th October until the national lockdown on the 5th November. However, Bristol City Council implemented extra measures implemented in Bristol from 28th October including the appointment of eight “COVID-19 marshalls” to patrol the city’s streets and the council taking on some local responsibility for test and trace. Bristol City Council called this “Tier 1 plus”, however, this name was not officially recognised by the government (Reference: https://www.bbc.co.uk/news/uk-england-bristol-54721829)
Acknowledgements
We would like to thank the Elizabeth Blackwell Institute for funding this research, our RedCap data manager Alison Horne and our PPI group for their feedback during the development of the survey. We would also like to thank all the participants who have taken part in this study.
Footnotes
↵* Joint first authors
Competing interests: HC has received research funding from Sanofi Pasteur, IMS Health, AstraZeneca, and GSK unrelated to this research. JGW has received research funding from Gilead Sciences unrelated to this research. All other authors declare no competing interests.
Funding: This study was funded and supported by the Elizabeth Blackwell Institute, HC, AF, KT, and EBP would like to acknowledge support from the National Institute for Health Research (NIHR) Health Protection Research Unit (HPRU) in Behavioural Science and Evaluation at the University of Bristol. HC is additionally funded through an NIHR Career Development Fellowship [CDF-2018-11-ST2-015]. The views expressed are those of the author(s) and not necessarily those of the NIHR or the Department of Health and Social Care. CR is a member of the MRC Integrative Epidemiology Unit and receives support from the MRC (MC_UU_00011/5) and the University of Bristol. EN and EBP are supported by the MRC (MR/V038613/1). ATh is supported by Wellcome (217509/Z/19/Z).


