
Abstract
Cancer vaccines are an important component of the cancer immunotherapy toolkit, enhancing the immune response to malignant cells by activating CD4+ and CD8+ T-cells. Multiple successful clinical applications of cancer vaccines have shown good safety and efficacy. Despite the notable progress, significant challenges remain in obtaining consistent immune responses across heterogeneous patient populations, as well as various cancers. We present a mechanistic mathematical model describing key interactions of a personalized neoantigen cancer vaccine with the immune system of an individual patient. The model specifically considers the vaccine concentration of tumor-specific antigen peptides and adjuvant, patient’s major histocompatibility complexes I and II copy numbers, tumor size, T-cells, and antigen presenting cells. We calibrated the model using patient-specific data from a recent clinical study where individualized cancer vaccines were used to treat six melanoma patients. Model simulations predict both immune responses to the vaccine as well as clinical outcome. Our model has the potential to lay the foundation for generating in silico clinical trial data and aid the development and efficacy assessment of personalized cancer vaccines.
Introduction
Cancer vaccines, alone or in conjunction with other immune modulators (e.g. checkpoint inhibitors) are among the most promising therapeutic options for many human cancers [1, 2]. This therapy employs either dendritic cells, T-cells, DNA, RNA, viral vectors, proteins, peptide or tumor cell lysate with the goal of exploiting the patient’s immune system to target antigens expressed only on tumor cells to selectively eliminate cancer cells [1, 3–5]. Therapeutic strategies that incorporate personalized cancer vaccines have gained attention due to successes in targeting multiple tumor-specific mutations [6]. However, there is an immense diversity in tumor gene expression and mutations; how these affect outcomes for individual patients is poorly understood [7]. Tumor-specific antigens (TSAs), or neoantigens, carry the amino acid substitutions derived from random somatic mutations that are expressed only on tumor cell surface. These mutations are highly patient- and tumor-specific [2, 6, 8, 9]. With the advent of accurate and inexpensive Next Generation Sequencing techniques, it has become possible to routinely sequence the DNA and RNA from cancer cells. Subsequent workflows using bioinformatic tools allow the identification of neo-sequences. These neo-sequences carry somatic mutations exhibiting sequences that are different from the wild type, and hence can be recognized as non-self by the host immune system having a high probability of eliciting a cancer specific immune response. From the large number of neo-sequences identified, the selection of the few neo-sequences (to be used as neoantigens in cancer vaccines) is largely based on the affinity of the neoantigens peptides to the patient’s major histocompatibility complex-I (MHC-I) and MHC-II proteins [7]. The individualized immunotherapies designed based on these principles have the potential to be specific, efficacious, and safe [9–11]. Eliciting immune responses to protein targets not found on normal cells reduces the probability of immune toxicities [9].
Despite some successes with the strategy of designing personalized neoantigen cancer vaccines described above, significant challenges remain. The selection of the candidate neoantigen based on peptide-MHC binding affinity focuses on just one step of a complex immunological cascade. The peptide-MHC engagement is a necessary, but not sufficient, step for the immune response to occur. More comprehensive models are required to effectively evaluate the potential neo-sequences to select those that will be the most efficacious as peptide vaccines. These strategies must have a rapid turn-around time as the window of opportunity to treat an advanced cancer patient is limited. There is also the lack of qualified predictive biomarkers for determining whether the therapy has been effective. Quantitative modeling approaches provide a useful tool-kit to study the interplay between tumor cells and the immune system [12]. These approaches enable a quantitative understanding of the kinetics of the immune response following neoantigen based peptide vaccine treatment. These insights can be used to design better vaccines and evaluate the potential candidate-vaccine in silico. The models can also guide clinical parameters such as dosing and infusion frequencies [13].
Mathematical modeling in biology and medicine, especially in oncology [14, 15], can be a powerful tool for the generation of experimental and clinical hypotheses to help study design [16, 17]. A mathematical model simplifies complex biological systems, provides insights into known mechanisms of the systems, and can aid researchers and clinicians better understand the disease [13, 17]. Models can facilitate in the development of testable hypotheses by providing quantitative estimates for numerous outcomes produced by dynamic interactions between various biological mechanisms. Several mathematical models have been developed to predict the effect of mono- or combination of immunotherapies against cancer [13, 18–25]. Although these studies provide insights into the interactions between treatments and immune response by modeling cell- and/or tissue-level immune dynamics; components of immune dynamics at the molecular level are lacking. The addition of this level of granularity to a mathematical model describing the immune and clinical response to a cancer vaccine is critical. Key molecular events that may impact the immune response and clinical outcome includes, antigen processing and presentation, and MHC-T-cell binding. Thus, a model that successfully describes the immune response elicited by a cancer vaccine (and the subsequent effect on tumors) will necessarily need to include the molecular parameters and events that drive the immunological cascade. The model presented here addresses this critical unmet need.
Results
Model parametrization for individual patients based on their T-cell response
Our mathematical model is designed to quantify the effect of a personalized peptide cancer vaccine, which is a mixture of peptide neoantigens with an adjuvant, on (i) CD4+ and CD8+ T-cell response and (ii) tumor size and/or growth. To calibrate and evaluate our model, we fitted the individual patient longitudinal T-cell response data extracted from a published study [26] as described in the Supplementary Appendix. Based on the clinical observations, our results are categorized into two groups: patients who had disease recurrence and patients who did not. We obtained parameter estimates that are patient-specific, i.e., unique to an individual patient’s T-cell response to peptides, initial tumor cell count, HLA alleles, and the peptide amino acid sequences of the personalized vaccine.
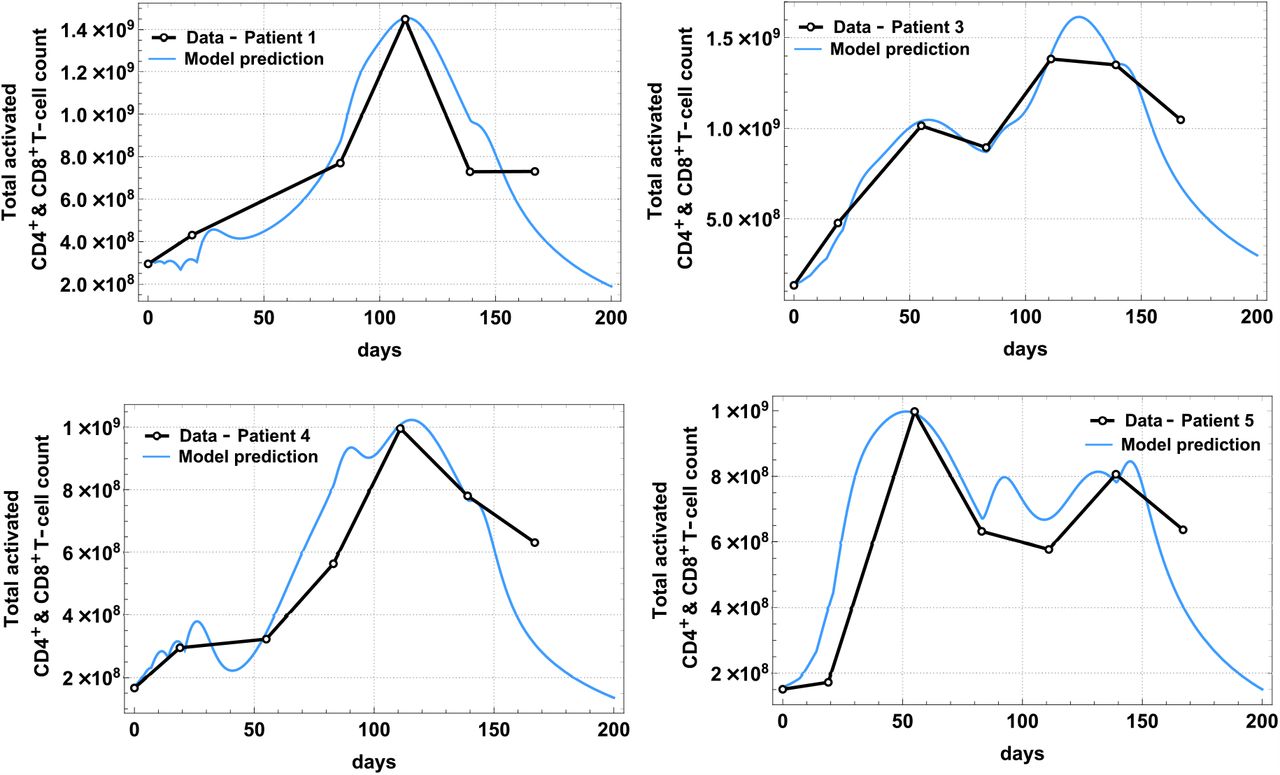
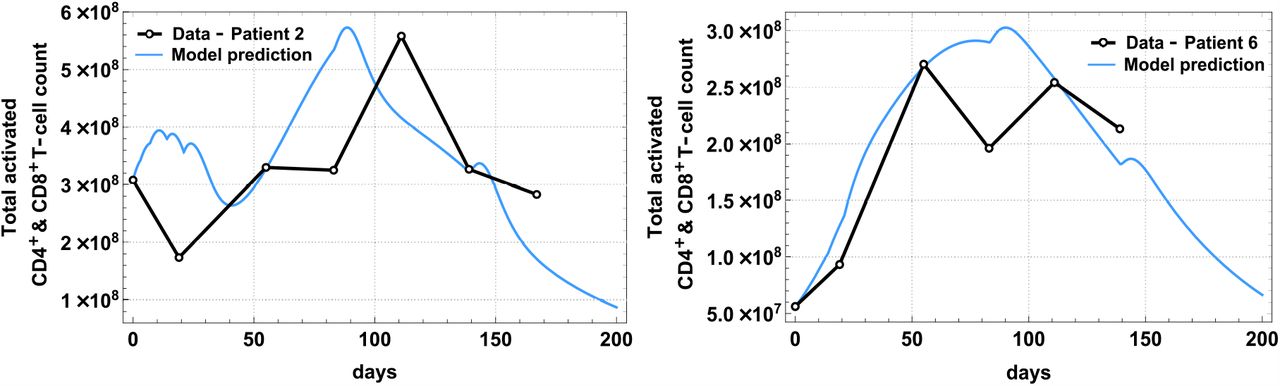
Patient-specific parameters in Table 1 were estimated by fitting the analytical solutions of the total activated T-cells: ACD4(t) + ACD8(t) to the extracted and scaled clinical data in [26]. Patients’ activated T-cell count (sum of ACD4(t) and ACD8(t)) over time and model fit are shown separately in Fig 1 (patients without disease recurrence) and Fig 2 (patients with disease recurrence), and the best-fit parameter values are tabulated in Table 1. Detailed description of these parameters is found on Table A7 in the Supplementary Appendix labeled with ★. The fits were obtained using a combination of nonlinear least-squares and the ‘NonlinearModelFit’ function in Mathematica Version 12.0 [27].
Detailed explanations of each model parameter can be found on Table A7 in the Supplementary Appendix

The best model fit of ACD4(t) + ACD8(t) (solid line) plotted together with clinical data (dots) from a phase 1 study [26] for Patient 1, 3, 4, 5, who were diagnosed with Stage 3 melanoma and had no disease recurrence.

The best model fit of ACD4(t) + ACD8(t) (solid line) plotted together with clinical data (dots) from a phase 1 study [26] for Patient 2 and Patient 6 who were diagnosed with Stage 4 melanoma and had recurrence after vaccine treatment.

Model simulations are plotted in log-scale with respect to tumor cell count. Tumor diameter (in red) was estimated in millimeters from tumor cell count. Dotted vertical line marks day 200 (t = 199).

Model simulations are plotted in log-scale with respect to tumor cell count. Tumor diameter size estimated in centimeters from tumor cell count shown on each plot. Dotted vertical line marks day 196 (t = 195) for Patient 2 and day 148 (t = 147) for Patient 6.
Model validation using longitudinal forecasts of tumor burden in clinical trial patients
To further explore the utility of our model, we used the best-fit parameter values in Table 1 to predict the tumor burden of individual patients in the clinical trial [26]. For patients in the ‘no recurrence’ group (Fig 3), we computationally estimated the tumor cell size (diameter) 200 days after treatment initiation since no tumor size information was provided in the study [26]. For patients in the ‘recurrence’ group (Fig 4), we compared model predicted tumor size with CT scans images and sizes provided from the study [26].
Four patients (1, 3, 4, and 5), initially diagnosed with Stage 3 melanoma, exhibited no recurrence of the disease following the treatment regimen with the cancer vaccine [26], but specific tumor size information (pre- and post-treatment) was not provided. However, using each patient’s best-fit parameter values, our mathematical model quantitatively captured the response of tumor cells to the vaccine. Predictions of both the immune response and the resulting effect on tumor cells are consistent with experimental and clinical data. We provide an estimation of tumor diameter (in red) and tumor cell count (highlighted in yellow) for a more complete understanding of the response to the vaccine. Tumor diameter was estimated using the inverse function of Eq. (2) in the Supplementary Appendix.
Two patients (2 and 6), initially diagnosed with Stage 4 melanoma, showed disease recurrence after vaccine treatment and information of CT scans for each patient were provided in the study [26]. The CT scans for Patient 2 were obtained 8 weeks after last booster vaccine (day 196) showing a tumor measuring approximately 2.1 cm, and our model predicted a tumor diameter size of approximately 1.52 cm. For Patient 6, CT scans were obtained one week after last booster vaccine, that is on day 148 (assuming vaccine was administered on day 140 corresponding to week 20 of vaccination protocol). The CT scans showed multiple soft-tissue nodules; one of them measuring 2.1 × 1.8 cm. Our model predicted a tumor diameter size of approximately 2.04 cm for this patient.
Sensitivity analysis
To explore the behavior of our mathematical model, which complex structure, input data and parameter values bring a high degree of uncertainty, we performed a global sensitivity analysis. Uncertainty of model predictions is often a result of errors in the model structure compared to the real biological system, estimations of parameters using different data sets, parameter values obtained from different sources, unknown errors in the input data, and errors in model solution algorithms. Using sensitivity analysis, we can quantify how a change in the value of an input parameter changes the value of the outcome variable. The sensitivity analysis thus allows the identification of parameters that contribute to the uncertainty of the outcomes [28].
We have seen in Fig 1 and Fig 2 the increase of both activated CD4+ and CD8+ T-cells over time as a result of the two signals provided by APCs resulting in the tumor antigenic peptide-MHC interacting with the TCR and co-stimulatory signal between APCs and T-cells. Interestingly, together with global parameters selected from the literature and patient-specific parameters gathered from the study [26], our model was able to capture two different sensitivity output scenarios categorized for patients who showed no disease recurrence (Patient 1, 3, 4, and 5) and patients who had disease recurrence (Patient 2 and 6). Sensitivity analysis revealed that sensitivity of parameters varies as both activated CD4+ and CD8+ T-cells increase (Fig 5, 6). For example, patients in the ‘no recurrence’ group (Fig 5-Patient 1), since | PRCC (ACD4, a1)| ≈ 1 (magnitude of the PRCC value of parameter a1 with respect to the output of interest ACD4 is close to 1), the outcome variable ACD4 is highly sensitive to the parameter a1, which represents the number of tumor cells necessary for half-maximal activated CD4+ T-cell proliferation on days 25 and 112. However, ACD4 becomes less and less sensitive to the parameter a1 as ACD4 decreases (day 147). For patients in the ‘recurrence’ group, we can see that the outcome variable ACD4, is highly sensitive not only to parameter a1 (as in the case of ‘no recurrence’ patients), but also to the parameter c1, which represents the proliferation rate of activated CD4+ T-cells due to presence of tumor cells, since |PRCC (ACD4, c1) | ≈ 1 (Fig 5-Patient 2, day 25). Over time, ACD4 becomes less sensitive to both parameters. PRCC values for the remaining patients for each output of interest can be found in the Supplementary Appendix.

PRCC values for the estimated parameters using the activated CD4+ T cell population as the output of interest and patient-specific input parameters (vaccine peptides, HLA alleles, binding affinities).*, **, *** indicate statistical significance at 0.05, 0.01, and 0.001 level, respectively.

PRCC values for the estimated parameters using the activated CD8+ T cell population as the output of interest and patient-specific input parameters (vaccine peptides, HLA alleles, binding affinities). *, **, *** indicate statistical significance at 0.05, 0.01, and 0.001 level, respectively.
Estimates for the number of activated CD8+ T-cells, ACD8, for ‘no recurrence’ patients is highly sensitive to parameters a2 and ρ2, representing the number of tumor cells needed for half-maximum proliferation and proliferation/differentiation rate of activated CD8+ T-cells, respectively, since | PRCC (ACD8, a2) | ≈ 1 and |PRCC (ACD8, ρ2)| ≈ 1 on day 25, 112, and 147 (Fig 6-Patient 3). Similarly, as before, we see differences for patients in the ‘recurrence’ group. Initially on day 25, ACD8, is highly sensitive to parameters ρ2 and c2. However, as time progress and activated CD8+ T-cells increase by day 112, this output variable is now only sensitive to c2, and by day 147 when ACD8 decreases, the sensitivity to these parameters disappears (Fig 6-Patient 6).
Lastly, PRCC values for parameters using tumor cells, T, as the dependent variable shows that d (maximum tumor killing rate by activated T-cells) is consistently the most influential parameter for ‘no recurrence’ patients (Fig 7-Patient 4) but becomes less influential for ‘recurrence’ patients by ‘end of treatment’ (Fig 7-Patient 2). Parameters such as s1, and s2, (half-maximal effect of tumor cell lysis by activated CD4+ and CD8+ T-cells, respectively) are most influential at the ‘initial phase’ (day 25) for all patients, whereas a1 and c1 are also influential in the ‘initial phase’ for ‘no recurrence’ and ‘recurrence’ patients, respectively.

PRCC values for the estimated parameters using the activated CD8+ T cell population as the output of interest and patient-specific input parameters (vaccine peptides, HLA alleles, binding affinities). *, **, *** indicate statistical significance at 0.05, 0.01, and 0.001 level, respectively.
Application: impact of vaccine administration on tumor progression
To explore the impact of vaccine administration at different initial tumor sizes, we predicted tumor diameter size (or cell count) 20 days after the last vaccination is administered (day 168 or t = 167 in our simulations) as a surrogate marker for clinical outcome. We selected four critical tumor diameters based on total cell counts at time of vaccination and made predictions using individual patient data and settings.. Methodological details for generating Fig 8 can be found in the Supplementary Appendix.

(a) Initial tumor diameter is less than or equal to 2.4 mm; (b) Initial tumor diameter is larger than 2.4 mm but smaller or equal to 6.4 mm; (c) Initial tumor diameter is larger than 6.4 mm but smaller or equal to 23.45 mm. (d) Initial tumor diameter is larger than 23.45 mm but smaller or equal to 80.2 mm.
In Fig 8, we can observe different outcomes for patients based on their profiles (i.e., HLA alleles, peptide-vaccine concentration, ‘strength of immune response’ defined by the estimated patient-specific parameters). Fig 8(a), for example, shows that all patients are able to achieve optimal tumor size of less than 1 mm after vaccination if they start treatment when the tumor has a diameter of less than 2.4 mm. If patients start treatment when the tumor has a diameter larger than 2.4 mm but smaller than 6.4 mm, we observe (Fig 8(b)) that patients in the ‘no recurrence’ group (Patient 1, 3, 4, and 5) are able to achieve smaller tumor size after treatment compared to patients in the ‘recurrence’ group (Patient 2 and 6). In Fig 8(c), patients starting treatment when tumor diameter is between 6.4 and 23.45 mm, are shown to have a similar response as in a previous scenario where ‘no recurrence’ patients performed better than ‘recurrence’ patients. Finally, Fig 8(d), shows that patients who start vaccine treatment with a much larger tumor size (>23.6 mm) are not able to reach an optimal tumor size at the end of treatment.
Discussion
Cancer vaccines have the potential to enhance the immune response to target and eliminate cancer cells via activated CD4+ and CD8+ T-cells. In this work, we focus on understanding and analyzing important mechanisms involved in the activity of personalized cancer vaccines using a mechanistic mathematical model. Our model simulations can capture immune response behavior to a vaccine and patient specific factors (e.g. different initial tumor burdens). Validation of our model using the results from a clinical trial of six melanoma patients provided the opportunity to identify patient-specific parameters that may impact the outcome of the vaccine therapy. These parameters include the initial tumor cell count, peptide dose, HLA allele types and antigen binding affinities.
The model currently includes a phenomenological response as means to simulate elimination of tumor cells by activated T-cells. This modeling approach has its limitations since neoantigen peptide vaccine’s secondary objective, after successfully activating tumor-specific T-cells [29], is for antigen-specific T-cells to bind to tumor cells and induce cytotoxicity [30]. Nonetheless, our assumption has been previously used and validated with experimental data in several modeling studies [13, 22, 31–33]. Therefore, given that we have limited information about how cancer progresses over time in different patients at different disease stages, we consider the dePillis-Radunskaya Law as a reasonable modeling approach to model the killing of tumor cells. Also, we assumed the logistic functional form to represent tumor growth. Usually the choice of a tumor growth function is generally determined by clinical data which can vary depending on the type of tumor, location, disease stage, among others [34]. Several studies [13, 22, 31–34] have suggested that the logistic and Gompertz functions are the most suitable to model tumor growth. Both functions have exhibited good predictions when calibrated with experimental data, usually of animal models of breast, lung, and melanoma cancers [13, 22, 31–34]. Our choice was based on the simplicity of the logistic function as it only requires the estimation of two parameters as opposed to three parameters in the Gompertz function and the lack of longitudinal clinical data.
The model was calibrated through model fitting using population level data from a clinical trial study [26]. Model fitting was done on identified patient-specific parameters (Table 1). Most of the estimated patient-specific parameters (except FP 1 and FP 2, representing the frequency of antigen-specific CD4+ and CD8+ T-cells) are model parameters that describe the killing and proliferation interactions between activated T-cells and tumor cells which were modeled based on phenomenological assumptions. The parametrization of our model was limited by the small number of patients from the clinical study used for model calibration and their finite follow-up times. A larger sample size may give us the opportunity to identify further patient-specific model parameters that can be tumor-stage specific. However, we observed significant differences in parameters a1 and a2 which determine the efficiency of the immune system to recognize tumor cells and elicit an immune response. For example, the parameter values of a1 and a2 obtained by fitting the ‘no recurrence’ patients’ data to our model were substantially smaller compared to the values of a1 and a2 obtained through the fitting of the ‘recurrence’ patients’ data.
Using the available information of individual patient’s tumor (melanoma) stage and their clinical history, we predicted the tumor size (diameter) 200 days after the first vaccination for patients who had no disease recurrence. Their predicted tumor size on day 200 fell under 1 mm, which is clinically declared as ‘thin’ melanoma and is considered as a favorable lesion with low risk of spreading [35]. For patients who had recurrence, we forecasted their tumor size on specific days when CT scans were taken. Our model was able to capture the decreasing trend of tumor size in all patients observed in the clinical trial. Moreover, we used our model to explore the impact of vaccine treatment initiation after resection surgery on tumor progression. Our results showed that the best case scenario for treatment initiation is when patients start vaccination with a tumor of diameter less than or equal to 6.4 mm (Fig 8(a-b)). In Fig 8(b), we observed that 90% of the patients achieved a tumor diameter of less than 1 mm at the end of treatment (favorable lesion), whereas in Fig 8(a), 100% of patients fell under 1 mm. Therefore, the ‘best’ clinical outcome of a personalized neoantigen peptide vaccine is when a patient starts treatment with a tumor diameter size less than 6.4 mm (1 × 10⁷ cells).
Sensitivity analysis of our model using estimated patient-specific parameters revealed which parameters contribute most significantly to determining total activated T-cell count at important time points during vaccine treatment and final tumor size. Model variable outcomes such as activated CD4+ and CD8+ T-cells were found to be highly sensitive throughout treatment period for patients who had no disease recurrence and only during ‘initial phase’ for patients who had recurrence, to the number of tumor cells needed to elicit T-cell proliferation. Also, the activated T-cell proliferation rate were found the be significant for the sensitivity of these variables outcomes (ACD4 and ACD8) as well. Proliferation (or recruitment) of immune cells to tumor site has been shown to be a favorable prognostic sign [36]. Therefore, these parameters involved in the recruitment of immune cells show importance in determining the efficiency of the immunotherapy to elicit an immune response. Another interesting finding was the high sensitivity of activated CD8+ T-cells throughout treatment for patients with no recurrence and only during ‘initial phase’ for patients with recurrence to the proliferation rate of activated CD8+ T-cells. Interestingly, this outcome was not observed for activated CD4+T-cells. A recent study [37], found that the proliferation of CD8+ T-cells was suppressed in patients with small cell lung cancer (compared with healthy patients). However, no equivalent suppression of CD4+ T-cells was observed. Thus, our model is able to identify the proliferation rate of CD8+ T-cells as an important and possibly prognostic parameter; consistent with a previous clinical report [37]. Lastly, tumor cell population was found to be significantly sensitive to the maximum tumor killing rate by activated T-cells, which again underlies the importance of activating the immune response.
The model we have developed has many limitations. We have not considered the tumor antigen escape phenomenon and thus we cannot model the potential outcomes if cancer cells stop expressing the neoantigens used to formulate the vaccines. The current version of our model also does not feature, concomitant therapies used against malignancies, as is usually the case in real life scenarios. Additionally, we have not incorporated T-cell sub-types (e.g. memory, regulatory) or antibody-mediated tumor eradication explicitly. We recognize that these are all important considerations for our future work. Another important potential addition to our model will be the incorporation of a post-vaccine therapy, such as a checkpoint inhibitor, to continue tracking the patient’s disease progression and determine possible safety and efficacy outcomes of individual or combined treatments. Lastly, our model is not readily applicable in studying efficacy of personalized neoantigen vaccines indicated in malignancies of the brain due to disease specific constraints and the existence of the blood brain barrier.
Despite the limitations described above, our model lays out a framework for developing in silico clinical trials and aid in the efficacy assessment of personalized vaccines. The model is flexible and allows exploration and quantification of the impact of therapy initiation times on trial outcomes. This model has potential utility in aiding the development and efficacy assessment of personalized cancer vaccines.
Materials and Methods
Mathematical model
We developed a mechanistic model to study the interactive dynamics of a personalized neoantigen peptide cancer vaccine, the human immune system, and tumor cells. The proposed model consists of a system of coupled non-linear ordinary differential equations (ODEs) representing important molecular and cellular populations which depict biological mechanisms that embody essential aspects of a neoantigen vaccine and target patient cohorts. The model is composed of a single immune system compartment encompassing the implicit connection of the innate and adaptive immunity. We consider two modeling levels, the cellular and subcellular (or molecular). At the cellular level, we considered cell populations such as, antigen presenting cells (APCs), naïve and activated CD4+ and CD8+ T-cells (helper and cytotoxic T-cells, respectively), and tumor cells in the patient. One of the critical steps in vaccination is the efficient presentation of the tumor-specific antigen (TSA) to the T-cells. Dendritic cells (DCs) are the most efficient APCs and we parametrized our APC model based on DCs. APCs capture, process and present the antigens to the T-cells using cell surface proteins, i.e., MHC class I and II molecules. Engagement of the MHC-antigen complex with the T-cell receptors (TCRs), initiates the differentiation of antigen-specific T-cells into effector T-cells [38]. We model these mechanisms and interactions at the cellular and subcellular levels.
Below, we describe in detail the assumptions considered for each equation with the end goal of constructing the full model. A schematic diagram of the mechanisms and interactions considered are shown in Fig 9 (cellular level) and Fig 10 (subcellular level). A list of model state variables with their respective definitions and units is presented in Table 2.
Subscript s = j for HLA-I allele and s = k for HLA-II allele

Immature dendritic cells differentiate into mature dendritic cells due to the maturation signal provided by the adjuvant (dotted arrow). Upon antigen uptake, processing and presentation by the mature dendritic cells, naïve T-cells recognize these (dotted lines with double-ended arrow-head) and differentiate into activated T-cells that proliferate. Activated T-cells are now capable of killing tumor cells. Tumor lysis increase activated T-cell counts through proliferation(dotted curved arrows).

Mature DCs uptake peptides, which are then processed through the interaction with major histocompatibility complex (MHC) class I and II to produce peptide-MHC complexes (p-MHC). These p-MHCs are then presented in the DC membrane for further recognition by naïve T-cells. Peptides, MHC and p-MHC complexes can suffer degradation. Peptide-MHC complexes have the potential to dissociate back into their constituents. MHC molecules on the DC membrane can be recycled back into the endosome. Double line arrows connecting to double head arrows represent the interaction of peptide with MHC-I or MHC-II molecules to create p-MHCI or p-MHCII complexes. Short dotted arrows represent degradation for peptides, MHC-I/II, and p-MHCI/II in the endosome and on the cell membrane. Dashed arrows represent dissociation of peptide-MHCs into peptide and MHCs molecules. Dash-dotted arrows represent the recycle of MHC complexes into the endosome after dissociation of p-MHCs on the cell membrane.
The vaccine
The vaccine dosage in the model is composed of a certain concentration of an adjuvant and a load of peptides previously identified and selected for a specific individual patient. Adjuvant is necessary to prime or ‘activate’ immature dendritic cells to respond to endogenous and exogenous antigens and elicit an immune response through the activation of T-cells.
Let p(t) represent the peptide concentration in a vaccine and Ad(t) the adjuvant concentration in a vaccine deposited in the subcutaneous (sc) connective tissue (injection site) at time t. We assume the vaccine concentration entering the tissue is instantaneously mixed and is homogeneously distributed for all t. Also, it is assumed that the vaccine is instantaneously absorbed by the body at time t, i.e., the vaccine’s concentration is updated before its content continues to be processed by dendritic cells. Since we consider that a vaccine dosage is administered at different scheduled time points, the Dirac delta function δ allows the description of bolus repeated administration of the same vaccine dose at times τi, i = 1, …, n:
 where Dosex, x = p, a is constant (specific to adjuvant or peptide concentration) and τi = 0, 3, 7, 14, 21, 83, 139 specifies the day when a vaccine is administered, with index i = 1, 2, …, 7 representing the number of vaccine doses administered throughout treatment. Note that the selection of these time points, ti, are based on the clinical study [26]. Thus, an equation representing the vaccine disposition process is:
 where αp and αd is the absorption rate of peptides and adjuvant by both immature and mature dendritic cells, respectively.
Antigen-presenting cells: dendritic cells (DCs)
We assumed that immature dendritic cells, DI(t), located at the subcutaneous connective tissue grow logistically with a maximum rate Λ and carrying capacity KDC. Mature dendritic cells are assumed to die naturally with a rate δM.
Immature dendritic cells, DI(t), can differentiate into mature dendritic cells, DM (t), with a maximum differentiation rate of rD in the absence of peptides and adjuvant. However, the maturation of DCs increases as a result of the contents of the vaccine. It is known that adjuvant increases the maturation of dendritic cells [39]. Thus, we consider an external maturation signal given by the effects of the adjuvant in the vaccine. In this case, the maturation signal is given by the release/absorption of adjuvant concentration, Ad(t), in a vaccine, meaning, higher Ad(t) concentration causes higher cell maturation, hence, larger mature dendritic cell, DM (t), population size. When the concentration Ad(t) is equal to Ka, a half-maximum effect constant, the maturation rate becomes  . Given these biological assumptions, the equations describing the rate of change of immature dendritic cells, DI(t), and mature dendritic cells, DM (t), are as follows:
Antigen processing and presentation by mature DCs
The following modeling approach follows a similar modeling framework of [40, 41]. The antigen processing and presenting by mature dendritic cells take place at the subcellular level (see Fig 10), in the endosomes of mature DCs. The vaccine peptides, p(t), are endocytosed into endosomes at a rate  , where
  is a re-scaling factor of the volume of endosomes in a single DC, VE, and the volume of the injection site Vsc. Therefore, peptides in DC’s endosomes are represented by a single molecular specie pE(t).
Inside the endosomes and other specialized vesicular compartments, peptides interact with MHC molecules of class I and/or class II. The strength of interaction of pE(t) and MHC molecule allele s is dictated by the effective disassociation constant  which gives the relationship between koff,s,the off-rate, and kon,s, the bio-molecular on-rate. The dissociation constant is defined as KD,s = koff,s/kon,s.
Endosomal peptides, pE(t) bind to either MHC-I or MHC-II molecules in the endosomes, with allele s = j or k, at a rate kon,s, to form endosomal peptide-MHC-I (p-MHCI) or p-MHCII complexes, represented with
  . Note that binding occurs with available
  in the endosomes; thus, we consider a re-scaling factor of
  The p-MHCs may dissociate back into their respective components, peptide and MHC molecule, at a rate koff,s/VE. Also, the peptide fragments that cannot bind with an MHC molecule are further processed into its amino acids at rate βp.
To calculate  , we follow a similar approach as in [40]. For each peptide-based vaccine sequence, we first obtain all N (15-30)-mer peptides and their individual MHC-I/II binding affinities KDm, m = 1, …, N, from NetMHCpan 4.0 [42] and NetMHCIIpan 4.0 [43], respectively. Then, those (15-30)-mers are pooled into a single representative molecule that binds to MHC-I allele type j and an MHC-II allele type k with an ‘effective disassociation constant’ such that
The molecular population dynamics of the endosomal free MHC-I/II molecules,  s = j, k, is given by Eq. (6), in which we assume: (1) homeostatic growth of endosomal free MHC-I/II molecules, with growth rate βM, and
  is the total number of MHC-I/II molecules at t = 0; (2) binding on and off between pE(t) and MHCI/II molecules in theendosomes,
  ; (3) recycling of free MHC-I/II from the cell membrane back into the DC’s endosomes with rate kin.
Equation (7) describes the molecular population dynamics of endosomal p-MHCI/II allele j or k,  s = j, k, starting with the formation of p-MHCI/II complex. These can dissociate back into peptides and MHC components, degrade at a rate βpM, or get trafficked out at a rate kextto form membranal p-MHCs, pMs(t) which will be recognized by T-cells.
Moreover, the p-MHCs on the DC membrane can dissociate into free MHCs on the cell membranes, Ms(t) at a rate koffas in Eq. (8) and (9).
Let pMn, with n = I, II representing the MHC class I or II, denote the number of p-MHC molecules recognizable by the neoantigen-specific (CD4+ or CD8+) T-cells, such that
 where NA. is Avogadro’s constant.
Helper and cytotoxic T-cells
Naïve CD4+ and CD8+ T-cells are assumed to grow logistically (death regulated by carrying capacity), with maximum growth rate b1 and b2, and carrying capacity KT C4 and KTC8, respectively. Activated T-cell population increases if there is a ‘successful’ activation process. Both naïve and activated T-cells are assumed to die naturally with a rate µ1 (for activated CD4+ T-cells), µ2 (for activated CD8+ T-cells), and µ3 (for both types of naïve T-cells).
The total number of naïve CD4+ T-cells at time t is denoted with NCD4(t). These can recognize neoantigen fragments presented on mature DCs’ membrane (pMII) at any time t, represented with the product FP1NCD4(t), where FP1 is the frequency of neoantigen-specific CD4+ T-cells. Naïve CD4+ T-cells can be activated with a maximum activation rate of σNh. The rate of change of naïve CD4+ T-cell population is modeled with the following equation:
 where Ψ1 = Ψ1 (DM, NCD4, ACD4) denotes the activation of neoantigen-specific precursor T-cells dependent on the relative quantity of the mature dendritic cells to naïve and activated CD4+ T-cells and the number of p-MHCII complexes,
 where pMII represents the number of p-MHCII molecules recognizable by the neoantigen-specific CD4+ T-cells as described in Eq. (10). The strength of mature DCs, DM (t), to activate a neoantigen-specific CD4+ T-cell is 50% when pMII(t) is equal to KpM2 and increases as pMII(t) increases.
Activated CD4+ T-cell population is denoted as ACD4(t), which increases with the activation of naïve CD4+ T-cells that had a ‘successful’ interaction with a mature DC. We also model whether activated CD4+ T-cells undergo proliferation or differentiation, depending on the proportion between DM(t), cell types involved in the activation (FP1NCD4(t), DM (t) and the number of T-epitope-MHC on DM(t)’s pMII(t). To understand this interaction better, when the quantity pMII(t) at any time t is much larger than kpM2, then the ratio  , i.e., most cells proliferate. In a similar way, when pMII(t)is much smaller than kpM2, then the ratio
  , which implies most cells differentiate (i.e. cells are removed from this species compartment). The rate of change of activated CD4+ T-cell population is modeled with the following equation:
 where Ψ2 is a function describing the interaction of mature dendritic cells and activated CD4+ T-cells:
Moreover, it is known that activated T-cells, also know as effector cells, are primed to initiate tumor cell killing [30]. In equation (12) (third term), activated CD4+ T-cells are assumed to grow based on proliferation due to the presence of the tumor. This immune system’s response is described mathematically with a Michaelis-Menten interaction term, where the parameter c1 models the antigenicity of the tumor. Antigenicity can be thought of as a measure of how different the tumor is from ‘self’. This functional (or phenomenological) response to model this interaction has been used in other mathematical models such as [31, 44, 45].
Naïve CD8+ T-cells are denoted with NCD8(t) and are modeled in a similar fashion as described above for naïve CD4+ T-cells. The rate of change of naïve CD8+ T-cell populations is then represented by
 where FP2 is the frequency of neoantigen-specific CD8+ T-cells that can recognize presented neoantigen fragments, and σNc is the maximum activation rate. Also, Ψ3 = Ψ3 (DM, NCD8, ACD8) denotes the activation of neoantigen-specific precursor CD8+T-cells dependent on the relative quantity of the mature dendritic cells to cytotoxic T-cells and the number of p-MHCI complexes,
 where pMI represents the number of p-MHCI molecules recognizable by the neoantigen-specific T-cells (see Eq. (10)). The strength of an DM (t) to activate a neoantigen-specific CD8+ T-cell is 50% when pMI(t) is equal to KpM1 and increases as pMI(t) increases.
The derivation of the equation describing the dynamics of the activated CD8+ T-cell population, denoted as ACD8(t), follows a similar approach as described above for ACD4(t).
 where Ψ4 is a function describing the interaction of mature dendritic cells and activated CD8+ T-cells:
Tumor cells
The total number of tumor cells at time t, T (t), is assumed to increase in a logistic fashion in the absence of immune intervention, where r is the maximum tumor growth rate and KT is the tumor’s carrying capacity (maximal tumor cell burden). Activated CD4+ and CD8+ T-cells kill tumor cells by a product of a maximum lysis rate di, i = 1, 2, and a rational expression that models tumor cell lysis as a function of the ratio of activated CD4+ and CD8+ T-cells to tumor cells.
Where  such that when i = 1 then x = CD8, and when i = 2 then x = CD4. In the expressions D1 and D2, λ represents how the lysis rate depends on the effector/target ratio, and s1, s2 affects the steepness of the curve, or how fast maximal killing rate is achieved. This expression is known as dePillis-Radunskaya Law (see [15, 31] for more details), which has been used extensively in the literature.
Model initial conditions and parameter values
Our mathematical model requires 18 initial conditions. We categorized these initial conditions as ‘global’ and ‘patient-specific’. The global initial conditions (14 total) are values that were found in the literature or that were estimated from available population level data of several clinical or experimental studies. Patient-specific initial conditions (4 total) were estimated from patient-specific data from a personalized neoantigen anti-melanoma vaccine clinical trial (ClinicalTrials.gov: NCT01970358) [26]. The patient-specific initial values considered are the peptide concentration in a vaccine, initial activated CD4+ and CD8+ T-cell counts and estimated initial tumor cell counts. Detailed derivation of these estimates is provided in the Supplementary Appendix.
Additionally, the model requires values for 46 parameters. Some of these parameters such as peptide concentration, (Dosep) and patient-specific HLA alleles, were predetermined based on information provided in [26]. Other parameters (12), were estimated by fitting solutions from our model to longitudinal data of individual patients extracted from [26]. The detailed description of model parameters, parameter values/ranges found in the literature, and parameter values chosen to run our simulations were organized by cell and molecule species on Table A7 in the Supplementary Appendix and marked accordingly: parameters that were estimated from the literature were labeled with ♣, patient-specific parameter values and initial conditions estimated from data (clinical trial or experiment) were labeled with ♦, and patient-specific parameters fitted to trial data were labeled with ⋆.
Sensitivity analysis
We use a global sensitivity analysis using Latin Hypercube Sampling (LHS) along with Partial Rank Correlation Coefficient (PRCC) to assess the sensitivity of the outputs of interest (activated CD4+ T-cells, ACD4, activated CD8+ T-cell response, ACD8, and tumor cells, T). In general, the magnitude of the PRCC indicates the importance of the uncertainty in estimating the value of the input parameter in contributing to the inaccuracy in predicting the outcome variable, and the sign indicates the correlation between each input parameter and each output variable [28, 46].
PRCC values were calculated between each of the 12 estimated input parameters and three outputs of interest at specific time-points (days 25, 112, and 147). These time-points of interest were chosen according to specific vaccine treatment events as observed in the clinical trial [26], which we define as ‘initial phase’, ‘peak T-cell response’, and ‘end of treatment’. Vaccine administration for all patients in the clinical trial [26] included a priming and a booster phase. We selected day 25 (t = 24 in our simulation), to define the ‘initial phase’, since the last priming vaccination in [26] occurred on day 22. Similarly, day 112 (t = 111) was selected to define the ‘peak T-cell response’ of activated T-cells (as observed in [26]). Lastly, the last booster vaccination occurred on week 20; thus day 147 (t = 146) was defined as the ‘end of treatment’. Through uncertainty quantification and sensitivity analysis, we determined which input parameters (see Table 1 for list of estimated parameter values and Table 2 and Table A7 in the Supplementary Appendix for definitions of the model variables and list of baseline parameters) are most influential on the outcome variables of interest. We used the mean of the best-fit parameter values of all six patients in Table 1 as the baseline to calculate LHS/PRCC values and the minimum and maximum of the best-fit parameter values as the range. Lastly, using a
T-test, we determined whether PRCC values were statistically significantly different from zero.
Data Availability
NA
Supplementary Information
Appendix. Mathematical details, parameter estimation, table of model parameter values and definitions, and additional results.
Code. Mathematical model. Mathematica notebook containing the code to reproduce time series simulations of activated T-cell and tumor cell populations of our mathematical model.
Author Contributions
Conceptualization: MRM, ONY, ZES, HY
Data curation: MRM
Formal analysis: MRM
Funding acquisition: HY
Investigation: MRM, ONY
Methodology: MRN, ONY
Project administration: MRM, ONY, HY
Resources: HY
Supervision: HY, ZES
Visualization: MRM
Writing – Original draft: MRM, ONY, ZES, UN, JRM, HY
Writing – Review & Editing: MRM, ONY ZES, UN, JRM, HY
Disclaimer
This article reflects the views of the authors and should not be construed to represent FDA’s views or policies.
Acknowledgments
This project was supported in part by an appointment to the Research Participation Program at OBE/CBER, U.S. Food and Drug Administration, administered by the Oak Ridge Institute for Science and Education through an interagency agreement between the U.S. Department of Energy and FDA. The authors received no financial support from any source, and there is no conflict of interest. We would like to extend our gratitude to Dr. Angela M. Jimenez Valencia (FDA/CVM) for the discussions that helped improve this manuscript.
References


