
Abstract
Less than one year into the COVID-19 pandemic, over 70 million individuals worldwide have been infected and case counts continue to accelerate, yet the long-term sequelae of COVID-19 are unknown. We leverage ‘augmented curation’ to extract symptoms and signs occurring post – COVID as noted in follow up physician’s notes of COVID-19 patients at the Mayo Clinic who were diagnosed with SARS-CoV-2 infection between March and September 2020, or influenza between 2014 and 2019. We compare the chart prevalence of signs/symptoms and diseases in the 3-to-6 month post-diagnosis vs. 1-to-6 month pre-diagnosis period for each disease, and subsequently compare the observed effect size of each symptom across the two diseases. Relative to post-influenza, we observe a significant increase in the chart prevalence of terms including “depression”, “anxiety”, “obesity”, and “bleeding” in COVID-19 patients under the age of 55. Across all age groups, “nodules” and “cysts” were also significantly increased. These findings compel targeted investigations into what may be persistent neuropsychiatric, pulmonary, metabolic, and coagulopathic phenotypes following SARS-CoV2 infection.
Since its emergence in December 2019, severe acute respiratory syndrome coronavirus 2 (SARS-CoV2) and its clinical syndrome coronavirus disease 2019 (COVID-19) have elicited clinical presentations ranging from asymptomatic disease to severe respiratory failure and death, as well as a number of extra-pulmonary manifestations. Despite extensive characterization of its acute presentation, relatively little is known about the long-term effects of both mild and severe COVID-191,2. Telephone interviews of outpatient SARS-CoV2 infected patients 14-21 days after positive RT-PCR test identified persistence of fatigue, cough, dyspnea, and headache most commonly3. A study of 143 recovered COVID-19 patients 60 days after symptom onset found that 87.4% still had at least one symptom, most commonly fatigue or dyspnea4. Another study of 55 recovered COVID-19 patients 3 months after discharge found 71% had radiologic abnormalities and 25% had abnormal pulmonary function tests5.
A better understanding of the convalescent phase and long-term consequences of COVID-19 (“long COVID”) is crucial as the number of patients who have been infected with SARS-CoV2 and recover from COVID-19 continues to rise. Several efforts are ongoing to monitor self-reported symptoms following COVID-19 recovery6, but results from these studies will be limited by the pace at which patients are recruited. Current attempts to assess the long-term sequelae of COVID-19 using structured data such as International Classification of Disease (ICD) codes are limited by a finite set of possible variables and are biased by a priori selection of variables of interest.
Here, we leverage augmented curation7 to retrospectively curate the complete electronic health records (EHRs) of COVID-19 and influenza patients in order to identify symptoms and phenotypes that persist several months after diagnosis of the viral infection. In the previously published augmented curation approach, BERT-based neural networks are used to identify diseases and symptoms that have been positively attributed to patients in unstructured clinical documentation; millions of notes can be curated in short periods of time7. Here, we extracted positively-attributed signs, symptoms, and diseases from Mayo Clinic electronic health records (EHRs) of COVID-19-positive patients (COVIDpos, n = 9,989) and influenza-positive patients (FLUpos, n = 9,583 from the past 5 seasons, July 1 2014 - June 30 2019). COVIDpos patients were identified via a positive PCR test result while FLUpos patients were identified by either positive rapid influenza diagnostic test (RIDT) or the presence of an ICD code indicating a clinical diagnosis of influenza or an acute influenza-related illness (Supplementary methods). The choice of exact start date and end date for the influenza diagnoses was guided by the number of influenza diagnoses per month between 2010 and 2019 (Supplementary Figure 1). For both COVID-19 and influenza, patients were stratified into four subsets: patients less than or equal to 54 years of age, patients greater than or equal to 55 years of age, all non-deceased patients, and patients requiring hospitalization. For each subset, the number of patients with records in each of the time windows relative to positive diagnosis are shown in Supplementary Figure 2.
For each patient, we computed the “chart prevalence” of over 27,000 disease and symptom terms in two time periods: 30-180 days prior to diagnosis date (the “pre” period) and 91-180 days after the diagnosis date (the “post” period). The chart prevalence of a disease/symptom is defined as the total number of days on which that disease/symptom is positively attributed to the patient divided by the total number of days on which any disease/symptom is attributed to the patient. For example, if a patient sees a physician on three separate days during a 90 day period and depression is positively attributed to the patient on each of those three days, the chart prevalence of depression is 1. The goal of using chart prevalence as a metric was two-fold: firstly, the prevalence metric may help to alleviate complications due to varying cadence of care. Secondly, we anticipate that this metric would provide an indication of how pertinent each symptom is to a patient’s health status within a given period of time. The inherent, unverified assumption with this method is that the greater the proportion of a patient’s notes that include mention of a positively-attributed symptom, the more relevant that symptom may be to the patient’s visits within that time frame.
In the statistical analysis of chart prevalence within the COVIDpos and FLUpos patient groups (supplementary methods), we use a Mann-Whitney U test to determine which diseases/symptoms have significantly different prevalence in the charts of patients in the post vs. pre periods. The resulting p values are corrected for multiple hypothesis testing using the Benjamini-Hochberg (BH) method (⍰ = 0.05). In order to compare COVID-19 to influenza, we start with the null hypothesis that there would be no difference between the Mann-Whitney effect size for COVIDpos and FLUpos for each symptom. We compare the observed effect size difference to the outcome of repeated null hypothesis simulations in order to establish a p-value for the observed difference (Supplementary Methods).
Amongst all analyzed strata, the terms “nodule” and “infection” are significantly increased (p < 0.05) in long-term COVID-19 sequelae vs. influenza (Figure 1 a-d), and “cyst” is significantly increased in all but the age 55+ group. Amongst all non-deceased patients, we also identify “dizziness”, “bleeding”, “edema”, hypertension (“htn”), and “cyst” to be significantly increased (Figure 1a). In the Age ≤ 54 group, “depression”, “anxiety”, “cyst”, and “obesity” to be significantly increased (Figure 1c). The largest effect size differences are seen for “nodule” and “cyst.” Table 1 summarizes the statistics observed for each term found to be significantly increased in COVID-19 vs. influenza, including p values, patient counts, and medians and interquartile ranges of chart prevalence.
Detailed statistics, chart prevalence, and patient counts for symptoms found to have significantly increased chart prevalence in COVID-19 (post-diagnosis vs. pre-diagnosis) vs. influenza (post-diagnosis vs. pre-diagnosis).
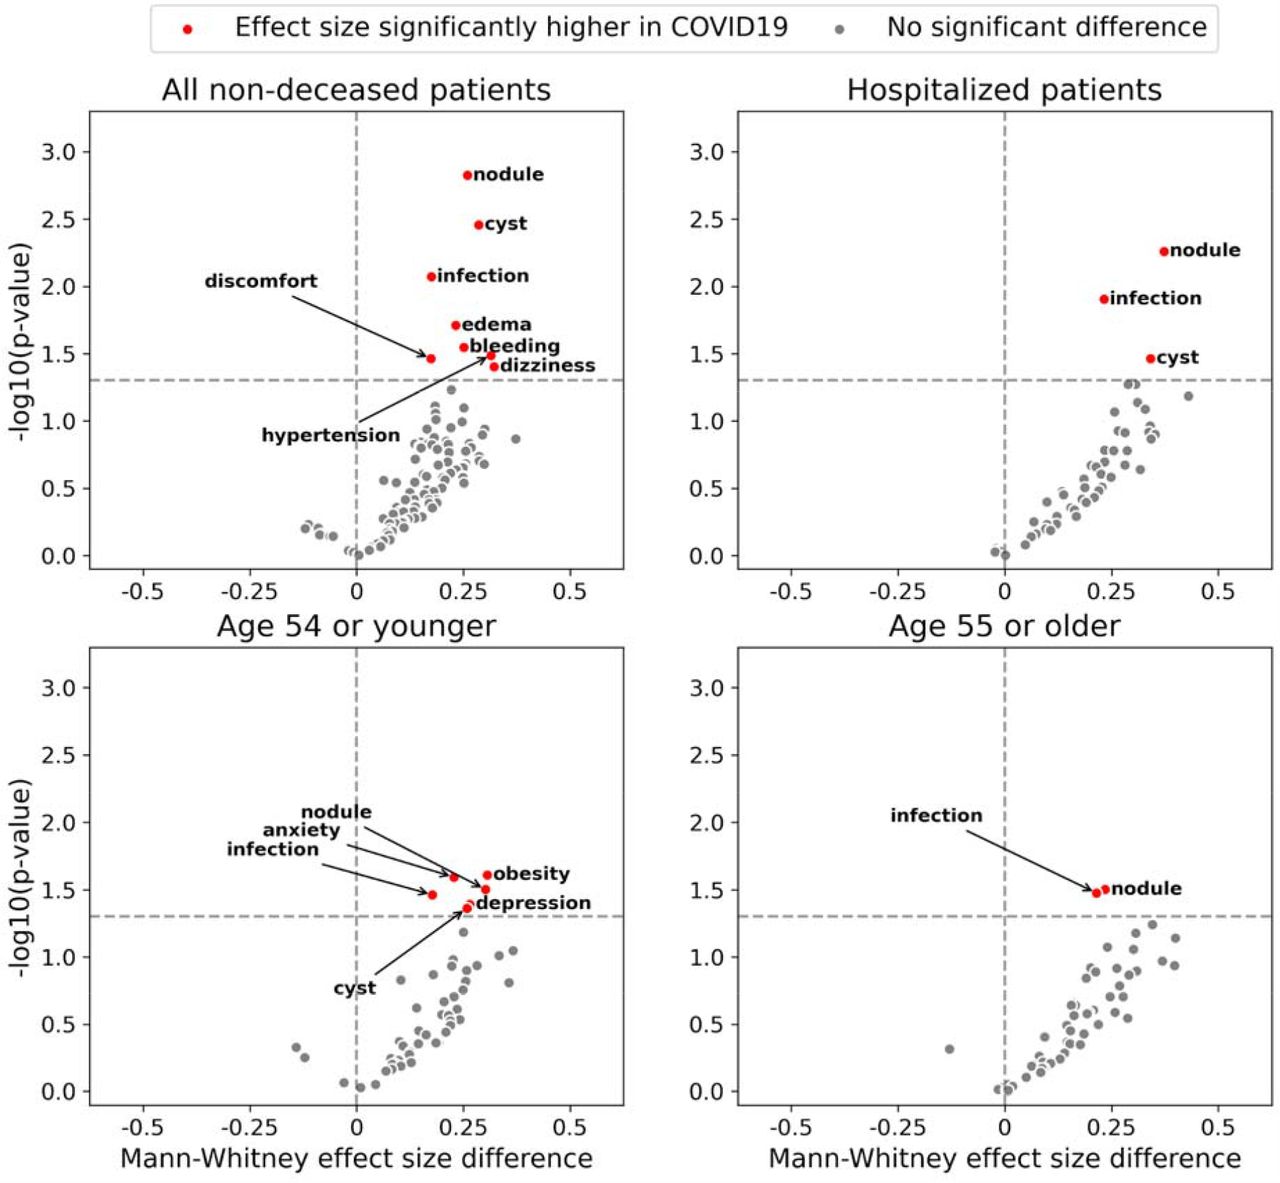
Scatter plots demonstrating BH-corrected p-values and differential effect sizes of symptoms found to be increased in the 91-180 day post-COVID-19 timeframe, when compared to influenza. In generating the above plots, a chart prevalence of each symptom is first computed for each patient in the 91-180 days post-(virus) and 31-180 day pre-(virus) time frames. A Mann-Whitney U test is used to determine if there is a significant difference in the post vs. pre timeframes. For symptoms for which the null hypothesis is rejected, we compare effect sizes between COVID-19 and influenza and, as described in the supplement, generate corrected p-values for the comparison. The differential effect sizes and p-values resulting from this process are displayed above for all non-deceased patients (a), all patients who required hospitalization (b), patients aged 54 or younger (c), and patients aged 55 or older (d).
Nodules and cysts as signs of long COVID-19 have precedence in the context of the lungs. One previous study of 55 recovered COVID-19 patients 3 months after discharge found that 71% had a range of radiologic abnormalities5. That study also found that 25% had abnormal pulmonary function tests and that chest X-ray severity correlated with diffusing capacity for carbon monoxide (DLCO), suggesting that radiological abnormalities may relate to functional impairments. In our study, 67.3% of sentences (69.4% of patients) in the 91-180 day post-COVID timeframe in which “nodule” was positively attributed to a patient also included a reference to a pulmonary localization term (“lung”, “pulm”, “pleur”, “RLL”,”RML”, “RUL”, “LLL”, “LUL”, “apex”, “apical”, “base”, “hilar”, “bronch”, or “lobe” excluding “hepatic”). In the pre-COVID timeframe, these numbers were 57.8% (sentence-wise) and 58.9% (patient-wise). In contrast, cyst occurred in the context of pulmonary locations in 10.3% of sentences (11.1% of patients) post-COVID and 4.4% of sentences (6.2% of patients) pre-COVID (Supplementary Table 1).
The finding that physician-documented anxiety and depression are increased 3-6 months post-COVID-19 in a younger population is striking. Each of these terms increased from a median chart prevalence of 50% pre-diagnosis (among 544 and 367 patients, respectively) to 100% post-diagnosis (27 and 34 patients, respectively) for anxiety or depression. Of the patients with “depression” or “anxiety”, respectively, attributed to them in the 3-6 month post-COVID timeframe, 10 and 12 did not have “depression” or “anxiety” attributed to them in the pre-COVID period (Supplementary Table 2). Albeit from an earlier post-diagnosis time window, research has demonstrated that patients in China endured symptoms of anxiety, depression, and stress via surveys in the early phases of the pandemic8. Additionally, an analysis of structured data has demonstrated an increase in the probability of numerous psychiatric diagnoses9 post-COVID-19 vs. post-influenza (and other respiratory illnesses). In these studies, elevated anxiety and depression were present across all age groups analyzed. However, in the former study the prevalence of patient-endorsed symptoms was higher in a younger population, whereas in the latter study, risk ratios for a diagnosis of anxiety or depression were higher in older populations. The present analysis of physician-documented diseases/signs/symptoms in unstructured EHR data corroborates the trend observed in the former study and highlights the need for a deeper understanding of the differences between information captured in unstructured vs. structured health data. Finally, our finding that other extrapulmonary diseases/signs/symptoms - such as bleeding (possibly attributable to gastrointenstinal, genitourinary, and oral/nasal sources, as shown in Supplementary Table 3), dizziness, edema, and hypertension - are also enriched in long COVID-19 compel further investigation given the reported coagulopathic10, cardiovascular11, and neurological12 impacts of the disease.
Although COVID-19 and influenza are both respiratory illnesses, direct comparison of these two patient populations is notably confounded by factors unrelated to the disease itself. Our influenza patient cohort and their signs/symptoms were identified prior to 2020, therefore signs/symptoms enriched in our COVID-19 cohort relative to influenza patient cohort might be related to the societal turmoil and stresses of 2020 rather than COVID-19 itself. Most influenza diagnoses are made in the Winter, whereas our long-term COVID-19 patient cohort was necessarily identified in the Spring, which makes seasonality another possible confounding variable. Finally, COVID-19 patients likely undergo unique treatments, procedures, healthcare engagement, and societal interactions following diagnosis compared to influenza patients, which might also contribute to a unique phenotype profile unrelated to the disease itself.
The present work provides an early look into long-term phenotypes and signs/symptoms attributed by physicians to COVID-19 patients relative to those attributed to influenza patients. The study is limited in several ways. First, relatively few COVID-19 patients have substantial unstructured clinical documentation extending to 6 months post-infection, due predominantly to the early timing of the present work. Second, although we classify whether or not a symptom or phenotype is documented as present or absent, we do not disambiguate further (e.g. whether the “nodule” is occurring in a paragraph describing pulmonary findings). Third, we do not analyze structured data sources such as laboratory measurements, billing codes, or clinical scales such as the PHQ-9 and GAD-7. Fourth, we have not compared COVIDpos to COVIDneg; this comparison would allow us to determine if certain observations, such as increases in chart prevalence of depression and anxiety, are attributable to COVID-19 itself or associated societal turmoil. Ongoing work is aimed at resolving these limitations, allowing for a comprehensive EHR-based triangulation of long-term COVID-19 effects.
As the number of SARS-CoV-2 infections increase, there is mounting concern over its long-term consequences. Although our understanding of the acute manifestations of COVID-19 has improved in the recent months, disease presentation and long-term effects remain relatively uncharacterized due to the paucity of long-term patient data. Augmented curation allows us to begin to address this shortcoming by unbiasedly extracting key word associations from tens of thousands of patient charts. Here we have identified a range of phenotypes, including nodules, cysts, depression, anxiety, bleeding, edema, and hypertension, as possible long-term associations with COVID-19 diagnosis. These findings compel targeted investigations into what may be persistent neuropsychiatric, cardiac, pulmonary, and coagulopathic phenotypes following SARS-CoV2 infection.
Data Availability
After publication, the data will be made available to others upon reasonable requests to the corresponding author. A proposal with detailed description of study objectives and statistical analysis plan will be needed for evaluation of the reasonability of requests. Deidentified data will be provided after approval from the corresponding author and the Mayo Clinic standard IRB process for such requests.
SUPPLEMENTARY INFORMATION
Natural Language Processing (NLP) / augmented curation of electronic health records (EHRs)
We used previously developed and detailed state-of-the-art BERT-based neural networks13 to rapidly curate clinical notes that were authored within 6 months of influenza and COVID-19 diagnoses. Specifically, the model extracts sentences containing clinical phenotypes and classifies their sentiment into the following categories: Yes (confirmed clinical manifestation or diagnosis), No (ruled out clinical manifestation or diagnosis), Maybe (possibility of clinical manifestation or diagnosis), and Other (alternate context, e.g. family history of disease). The neural networks are pre-trained on 3.17 billion tokens from the biomedical and computer science domains (SciBERT)14 and subsequently trained using 18,490 sentences and approximately 250 phenotypes with an emphasis on cardiovascular, pulmonary, and metabolic phenotypes. It achieves 93.6% overall accuracy and over 95% precision and recall for both “Yes” and “No” sentiment classification.
Analysis of chart prevalence of diseases and symptoms
In the analysis of chart prevalence, for each patient and time period, we count a symptom or disease by an estimate of how much of the patient’s medical chart during that time period is populated by that symptom or disease. In particular, we count a symptom or disease by its “chart prevalence” equal to the number of days the patient is recorded as having the symptom or disease divided by the number of days the patient is recorded as having any symptom or disease.
Computing symptoms and diseases that are significantly more or less prevalent within the records of patients who have them, post-infection vs pre-exposure
In this analysis, we restrict to patients who report a symptom or disease, and compute the proportion of days each patient reported a specific symptom or disease compared to the number of days that patient reported any symptom or disease (i.e. we do not take into account how many patients had the disease).
We will describe the analysis for COVIDpos patients; the analysis for FLUpos patients is equivalent. For each post-infection time period, we restrict to symptoms & diseases which occur at least once in the pre-exposure period and at least once in the post-infection period. For the two time periods and for each symptom or disease, we have a list of 1+ patients along with their record prevalence values. We then simply perform a Mann-Whitney U test to compare whether one time period has generally larger record prevalence values than the other. The common language effect size associated with the Mann-Whitney test -- which is just the proportion of all pairs of (post-infection, pre-exposure) record prevalence values in which the post-infection period’s record prevalence is larger than the pre-exposure period’s. The p-values are again adjusted using the Benjamini-Hochberg procedure.
Computing symptoms which are more or less prevalent post-infection compared to pre-exposure for COVIDpos relative to FLUpos patients
Given a post-infection time period, to compare symptoms and diseases by how much more (or less) amplified they are among COVIDpos patients relative to FLUpos patients, we simply subtract the respective common language effect size values obtained for that time period. If the COVIDpos symptom/disease effect size is much larger than the FLUpos effect size, then the specific symptom or disease is more amplified post-infection in COVIDpos compared to FLUpos patients.
P-values against the null hypothesis that the effect size difference is 0 were computed to accompany this metric, by simulation. In detail, let x1 denote the vector of COVIDpos pre-exposure record prevalence values; let x2 denote the vector of COVIDpos post-infection record prevalence values; let y1 and y2 be the analogous for FLUpos patients. In place of x1 and y1, the null x1’ and y1’ are simulated the same way as follows: (i) a coin is flipped for each entry of the vector and if the coin is (ii) heads -- a random value from x1 is chosen as that entry of the vector or (iii) tails -- a random value from y1 is chosen for that entry of the vector. In place of x2 and y2, the null x2’ and y2’ are simulated analogously, as follows: (i) a coin is flipped for each entry of the vector and if the coin is (ii) heads -- a random value from x2 is chosen as that entry of the vector or (iii) tails -- a random value from y2 is chosen for that entry of the vector. This is repeated 2000 times to get 2000 simulated values x1’, x2’, y1’, and y2’, and 2000 corresponding simulated effect size differences. The observed effect size difference is ranked among these 2000 to get a two-sided p-value.
Study details
This retrospective study was comprised of patients who presented to the Mayo Clinic Health System (including tertiary medical centers in Minnesota, Arizona, and Florida) and received at least one positive SARS-CoV-2 PCR test between the start of the COVID-19 pandemic and September 11, 2020. This retrospective research study was conducted with approval from the Mayo Clinic Institutional Review Board (IRB 20–003278).
Institutional Review Board (IRB)
This study was reviewed and approved by the Mayo Clinic Institutional Review Board as a minimal risk study (IRB 20-003278, ‘Study of COVID-19 patient characteristics with augmented curation of Electronic Health Records (EHR) to inform strategic and operational decisions’). Subjects were excluded if they did not have a research authorization on file. For further information regarding the Mayo Clinic Institutional Review Board (IRB) policy, and its institutional commitment, membership requirements, review of research, informed consent, recruitment, vulnerable population protection, biologics, and confidentiality policy, please refer to www.mayo.edu/research/institutional-review-board/overview.
Study design
In this study, we consider all hospitalized COVID-19 positive patients (positive PCR for SARS-CoV2) in the Mayo Clinic electronic health record (EHR) database from March 12, 2020 to September 11, 2020. We also consider all influenza patients diagnosed between July 1, 2014 and June 30, 2019 that were part of a cohort of approximately 700,000 patients that visit the Mayo Clinic Health System on a recurring basis.
Patient and Public Involvement
The development of the research question and outcome measures was informed by prior literature and information from the Centers for Disease Control and Prevention (CDC) on risk factors for severe COVID-19 illness. No patients were involved in the design of the study, but physicians from the Mayo Clinic who are involved with the COVID-19 research taskforce and the clinical care for COVID-19 patients were involved with the study design and execution.
Data Availability
After publication, the data will be made available to others upon reasonable requests to the corresponding author. A proposal with detailed description of study objectives and statistical analysis plan will be needed for evaluation of the reasonability of requests. Deidentified data will be provided after approval from the corresponding author and the Mayo Clinic standard IRB process for such requests.
Conflict of Interest Statement
ADB is a consultant for Abbvie, is on scientific advisory boards for nference and Zentalis, and is founder and President of Splissen therapeutics. One or more of the investigators associated with this project and Mayo Clinic have a Financial Conflict of Interest in technology used in the research and that the investigator(s) and Mayo Clinic may stand to gain financially from the successful outcome of the research. This research has been reviewed by the Mayo Clinic Conflict of Interest Review Board and is being conducted in compliance with Mayo Clinic Conflict of Interest policies. The authors from nference have financial interests in nference.

Total number of patients with Influenza ICD codes for each month between 2010 and 2019. Red = max, green = min.

Number of patients of each stratification that are included in each time window for each season.
For the terms “nodule” and “cyst”, we examined the sentences that were classified to determine if additional context was present that could support the association of the term with the lungs. To do so, we searched sentences for substrings associated with pulmonary localization (“lung”, “pulm”, “pleur”, “RLL”,”RML”, “RUL”, “LLL”, “LUL”, “apex”, “apical”, “base”, “hilar”, “bronch”, or “lobe” excluding “hepatic”). Importantly, co-occurrence of “nodule”/”cyst” and lung-related term, as quantified here, does not necessarily imply localization of nodule/cyst to the lungs.
Shown here the total numbers of patients with “depression” and “anxiety” positively attributed to them in their medical records, alongside the numbers of patients who had a new attribution of “depression” or “anxiety” in the 91-180d post-COVID period, defined as the presence of “depression”/”anxiety” in the 91-180d timeframe coupled to the absence of “depression”/”anxiety” in the 31-180d pre-COVID period. Notably, these patient counts are for those patients with a COVID diagnosis date 3+ months prior to the 9/11/2020 (in the main text, numbers are shown for all COVIDpos patients at the Mayo Clinic as of 9/11/2020).
For the term “bleeding”, we examined the sentences that were classified to determine if additional context was present that could support the association of “bleeding” with a pathological site. To do so, we searched sentences for substrings associated with the following sites: Genitourinary (“menor”, “vagin”, “menstru”, “cervix”, “cervical”, “uterine”, “uterus”, “urine”, “penis”, “penile”), Gastrointenstinal (“GI “, “gastrointest”, “rectal”, “rectum”, “gastro”, “esoph”, “instestin”, “gastric”, “duod”, “diverticul”, “colon”), Oral/Nasal (“gums”, “oral”, “nasal”, “pharyng”, “septum”, “tongue”, “lingual”, “dental”), Surgical/Invasive (“surg”, “incision”, “wound”, “tube”, “drain”, “site”, “port”, “catheter”), Brain/CNS (“brain”, “neuro”, “dural”, “arachnoid”, “spinal”). Importantly, co-occurrence of “bleeding” and a site-related term, as quantified here, does not necessarily imply a link between site and “bleeding.”
Footnotes
↵+ Joint first authors


