
ABSTRACT
The need to identify and effectively treat COVID-19 cases at highest risk for severe disease is critical. We identified seven common genetic variants (three novel) that modulate COVID-19 susceptibility and severity, implicating IFNAR2, CCHCR1, TCF19, SLC6A20 and the hyaluronan pathway as potential therapeutic targets. A high genetic burden was strongly associated with increased risk of hospitalization and severe disease among COVID-19 cases, especially among individuals with few known risk factors.
MAIN TEXT
Severe acute respiratory syndrome coronavirus 2 (SARS-CoV-2)[1] causes coronavirus disease 2019 (COVID-19)[2], which has lead to >1.5 million recorded deaths worldwide since December 2019 [3]. Reported risk factors for severe COVID-19, defined here as death or hospitalization combined with respiratory failure [4], include male sex, older age, race, obesity, kidney, cardiovascular and respiratory diseases [5-8]. Corticosteroids, repurposed anti-viral medicines, and antibody therapies have been authorized to treat COVID-19 [9-12]. Presently, excess mortality due to COVID-19 is high and the urgent need for therapies that treat or prevent severe disease remains. Further, identifying individuals at highest risk of adverse outcomes may help prioritize individuals for vaccines [13, 14] or monoclonal antibody treatments[15, 16], which are currently in short supply. In this study, we used human genetics to identify potential therapeutic targets for severe COVID-19 and developed genetic risk scores to identify individuals at highest risk of severe disease with greater precision than can be attained with clinical and demographic variables alone.
We performed genetic association studies of COVID-19 outcomes across 11,356 individuals with COVID-19 and 651,047 individuals with no record of SARS-CoV-2 infection aggregated from four studies (Supplementary Table 1) and four ancestries (Admixed American, African, European and South Asian). Of the COVID-19 cases, 2,175 (19%) were hospitalized and 847 (7%) had severe disease; hospitalized patients were more likely to be older, of non-European ancestry and to have pre-existing cardiovascular and lung disease (Supplementary Table 2). Using these data, we defined two groups of COVID-19 outcomes: five phenotypes related to disease risk and two phenotypes related to disease severity among COVID-19 cases (Supplementary Table 3). For each phenotype, when >30 cases were available, we performed ancestry-specific genetic analyses in each study (Supplementary Table 4) and then combined results across studies and ancestries using a fixed-effects meta-analysis.
To identify genetic variants that modulate disease severity following SARS-CoV-2 infection, we first focused on replicating eight independent associations (r2<0.05) with disease risk reported in recent GWAS that included >1,000 cases [17-20] (Supplementary Table 5); we hypothesized that some of these published risk variants could also modulate disease severity. After accounting for multiple testing, six variants had a significant (P<0.0012) and directionally consistent association with at least one of our five disease risk phenotypes (Supplementary Table 6): rs73064425 in LZTFL1 (strongest in contrast between COVID-19 hospitalized cases vs. COVID-19 negative or unknown controls; MAF=7%, OR=1.42, P=7×10⁻¹¹); rs2531743 near SLC6A20 (COVID-19 positive vs. COVID-19 negative; MAF=42%, OR=1.06, P=9×10⁻⁴); rs143334143 in the MHC (COVID-19 severe vs. COVID-19 negative or unknown; MAF=7%, OR=1.36, P=6×10− 4); rs9411378 in ABO (COVID-19 positive vs. COVID-19 negative or unknown; MAF=23%, OR=1.12, P=6×10⁻¹⁰); rs2109069 in DPP9 (COVID-19 positive vs. COVID-19 negative or unknown; MAF=31%, OR=1.06, P=10−4); and rs2236757 in IFNAR2 (COVID-19 hospitalized vs. COVID-19 negative or unknown; MAF=29%, OR=1.13, P=2×10⁻⁴). Effect sizes were comparable across ancestries (Supplementary Table 7). Having established these variants as bona fide risk factors for COVID-19, we then asked which (if any) were also associated with severity amongst COVID-19 cases. We found that four of the six variants were significantly (P<0.05) associated with worse outcomes among infected individuals (Figure 1A). The exceptions were rs9411378 in ABO and rs2531743 near SLC6A20, which did not associate with COVID-19 severity (Figure 1B). Collectively, these results pinpoint four variants associated with worse disease outcomes, including respiratory failure and death. These variants can be used to identify individuals at risk of severe COVID-19 and suggest that nearby genes may represent targets for therapeutic intervention.

(A, B) Six variants that were reported to associated with COVID-19 susceptibility in previous studies and replicated in our analysis. Of these, four variants also associated with disease severity among COVID-19 cases (in/near LZTFL1, CCHCR1, DPP9 and IFNAR2; panel A), whereas two variants did not (in ABO and SLC6A20, panel B).
(C) Three novel risk variants for COVID-19 discovered in the trans-ancestry meta-analysis of risk of COVID-19 hospitalization across six studies (AncestryDNA, GHS, UKB, PMBB, Ellinghaus[19] et al. and Pairo-Castineira et al.[18]).
We next looked for novel genetic associations with severe COVID-19. Across our two severity phenotypes (hospitalized vs. non-hospitalized cases; severe vs. non-hospitalized cases), we found no new associations at P<5×10⁻⁸ (Supplementary Figure 1), indicating that these analyses were underpowered for genome-wide discovery. To increase power, we combined results from our COVID-19 hospitalization phenotype (2,175 cases vs. 651,047 controls) with those from two published GWAS[19, 21], for a combined sample size of 5,461 hospitalized cases and 661,632 controls with no record of SARS-CoV-2 infection. In this larger analysis of disease risk, seven loci reached genome-wide significance (Figure 2), including the four highlighted by the replication analysis above (LZTFL1, MHC, DPP9 and IFNAR2) and three novel associations (Table 1): rs79833209 near CCNG1 (5q34; MAF=2%, OR=1.54, P=2×10⁻⁸); rs4782327 in ACSF3 (16q24.3; MAF=22%, OR=1.17, P=8×10⁻⁹); and rs12461764 in FPR1 (19q13.41; MAF=35%, OR=1.18, P=10−8). Consistent associations were observed across studies and ancestries for the three novel variants (Supplementary Figure 2). We then assessed the association between each novel variant and disease severity and found that for all three, the risk allele was overrepresented (P<0.05) amongst hospitalized and severe COVID-19 cases, relative to non-hospitalized cases (Figure 1C). To further study the association between the three variants and worse disease outcomes, we constructed a continuous score that combined nine different measures of severity self-reported by 4,448 COVID-19 cases from the AncestryDNA study. Lower severity scores were enriched for asymptomatic cases and lower symptom severity, while higher scores were associated with increased symptom severity and elevated hospitalization rates (Supplementary Figure 3). The mean severity score was elevated for carriers of each of the three novel risk alleles (Supplementary Table 8). Therefore, the three putative novel susceptibility loci we identified for COVID-19 risk are also associated with increased risk of severe disease.

The meta-analysis included results from six studies (AncestryDNA, GHS, UKB, PMBB, Ellinghaus et al. [19] and Pairo-Castineira et al.[18] and four ancestries (AFR, AMR, EUR and SAS), totaling 5,461 hospitalized cases and 661,632 controls with no record of SARS-CoV-2 infection.
The meta-analysis included results from six studies (AncestryDNA, GHS, UKB, PMBB, Pairo-Castineira et al.[18] and Ellinghaus et al. [19]) and four ancestries (AFR, AMR, EUR and SAS), totaling 5,461 hospitalized cases and 661,632 controls with no record of SARS-CoV-2 infection.
Collectively, our association analyses highlighted seven common variants (four known, three novel) associated with COVID-19 susceptibility (P<5×10⁻⁸), as well as disease severity among cases (P<0.05). As all seven variants are either intronic or intergenic, it is not immediately clear how these variants influence gene function. To help identify gene targets and thus potential therapeutic targets for severe COVID-19, we searched for functional protein-coding variants (missense or predicted loss-of-function) in high LD (r2>0.95) with each variant. We found six functional variants in three genes: two missense variants in IFNAR2, a component of the heterodimeric type-1 interferon receptor; three missense and a stop-gain variant in CCHCR1, a P-body protein associated with cytoskeletal remodeling and mRNA turnover [22, 23], which can interact with human papillomavirus-16 [24, 25]; and a missense variant in TCF19, a transcription factor associated with hepatitis B [26, 27] (Supplementary Table 9). These data indicate that the risk variants identified in IFNAR2, CCHCR1 and TCF19 may have functional effects on these genes. Next, we asked if the sentinel risk variants co-localized (r2>0.95) with published sentinel expression quantitative trait loci (Supplementary Table 10), specifically focusing on 168 genes in cis (± 500 kb). We observed evidence for co-localization for IFNAR2, TCF19 and SLC6A20 (Supplementary Table 11). SLC6A20 encodes a proline transporter that binds the host SARS-CoV-2 receptor, angiotensin-converting enzyme 2 [28]. Our results suggest that higher SLC6A20 expression in the lung (and potentially increased viral uptake) is associated with higher risk of severe disease (Supplementary Table 11). In contrast, for IFNAR2, our analysis suggests that severe COVID-19 is associated with lower expression in immune cells and lung tissue (Supplementary Table 11), consistent with the deficient interferon response observed in severe COVID-19 patients [29]. Collectively, these analyses identified four specific putative effector genes in COVID-19 risk loci (IFNAR2, CCHCR1, TCF19 and SLC6A20), though functional studies are required to confirm these predictions.
Co-localization analyses did not identify any likely target genes for the three new risk variants. However, we note that two of these (rs12461764 and rs79833209) are near genes related to hyaluronan (HA), a major component of the lung extracellular matrix (Supplementary Figure 2): HAS1 (16 Kb away) and HMMR (160 Kb away), which respectively encode HA synthase 1 and a cell-surface receptor for HA. This observation is noteworthy because elevated HA (i) has been reported in the lungs of COVID-19 patients [30, 31]; and (ii) is associated with inflammation and other infections [31], including influenza [33]. Furthermore, Hmmr-deficient mice are protected in acute fibrotic lung injury models [34]. If confirmed, these findings would support the use of hyaluronidases in reducing accumulation of HA and preventing long-term lung damage in COVID-19 patients [35].
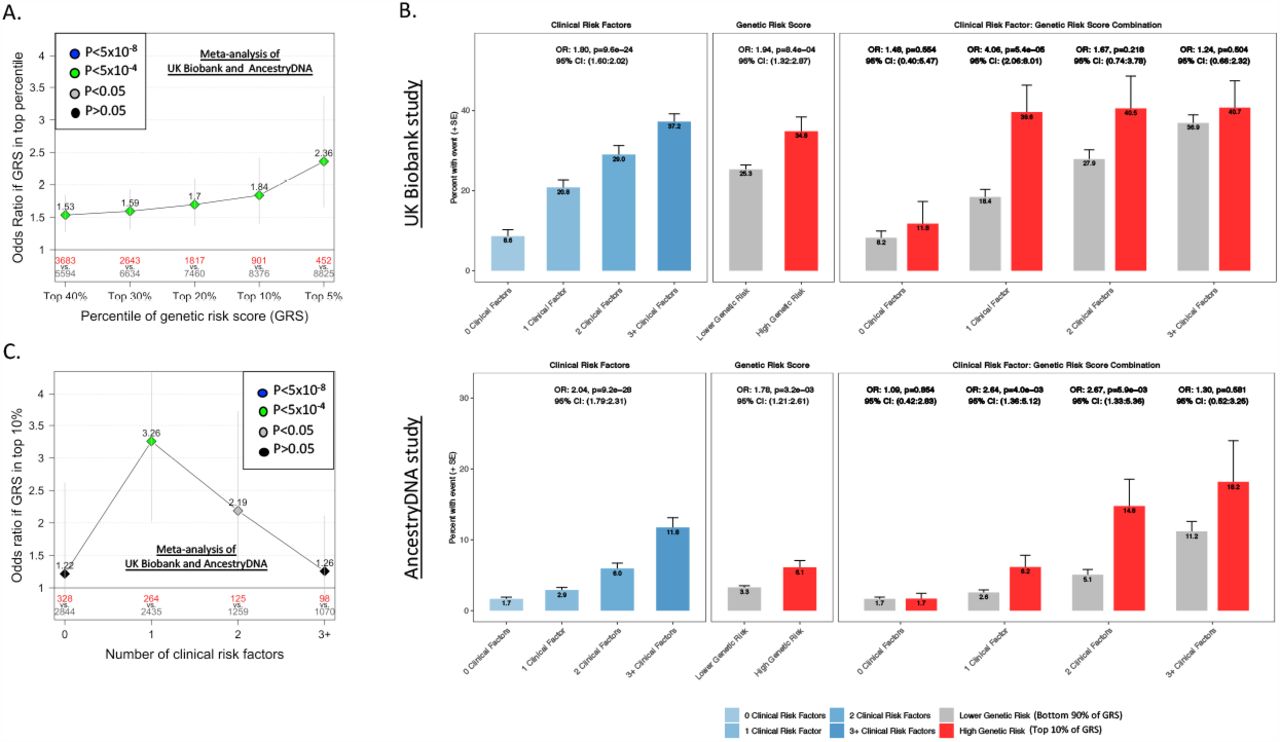
The second aim of this study was to determine if genetics can help identify individuals at high risk of severe disease, who may be prioritized for prophylactic or therapeutic interventions. Specifically, we focused on the four variants (in/near LZTFL1, MHC, DPP9 and IFNAR2) with confirmed association with COVID-19 susceptibility and that also modulate COVID-19 severity. Using these variants, we created a weighted genetic risk score (GRS) for individuals with COVID-19 and then compared the risk of hospitalization and severe disease between those with a high GRS and all other cases, after adjusting for established risk factors (e.g. age, sex, comorbidities). When considering COVID-19 cases of European ancestry (N=9,277), we found that having a high GRS (top 10%) was associated with a 2.0-fold increased risk of hospitalization (95% CI 1.66-2.55, P=3×10⁻¹¹; Supplementary Figure 4A) and 1.8-fold increased risk of severe disease (95% CI 1.40-2.41, P=10−5; Figure 3A). A consistent pattern was observed in other ancestries, though sample sizes were considerably smaller (Supplementary Tables 12 and 13). Lastly, we compared the effect of the GRS between individuals with and without established risk factors for severe COVID-19. We found that a high GRS (top 10%) was strongly associated with risk of severe disease among individuals with one (OR=3.26, 95% CI 2.03-5.23, P=10−6) or two (OR=2.19, 95% CI 1.29-3.72, P=0.004) established risk factors (Figure 3B and 3C; Supplementary Table 14). In contrast, there was a much weaker association between a high GRS and risk of severe disease among individuals with many (three or more) risk factors (OR=1.26, 95% CI 0.75-2.11, P=0.388), although evidence for heterogeneity of GRS effect with number of risk factors was not significant (P=0.16). Similar results were observed for risk of hospitalization (Supplementary Figure 4B and 4C; Supplementary Table 14). Collectively, these results demonstrate that a GRS calculated using variants associated with disease risk and severity can be used to identify COVID-19 cases at high risk of developing poor disease outcomes. This is important as many of these individuals might not be prioritized for prophylactic or therapeutic interventions according to current guidelines[35].
(A) Association between high genetic risk and severe disease. Overall risk of severe disease is shown for individuals in the top GRS percentile, agnostic to the number of clinical risk factors present. The association was tested in two studies separately (AncestryDNA and UKB studies) using logistic regression, with established risk factors for COVID-19 included as covariates (see Methods for details). Results were then meta-analyzed across studies, for a combined sample size of 8,423 COVID-19 cases, including 744 with severe disease. N in red: number of COVID-19 cases in the top GRS percentile. N in grey: number of COVID-19 cases in the rest of population.
(B) Rate of severe disease in UK Biobank and AncestryDNA study, after stratifying by the number of clinical risk factors and genetic risk score. High genetic risk: top 10% of the GRS. Low genetic risk: bottom 90% of the GRS (i.e. all other COVID-19 cases).
(C) Association between high genetic risk (top 10% of GRS vs. all other COVID-19 cases) and severe disease, after stratifying by the number of pre-existing clinical risk factors. The association was tested in the UK Biobank and AncestryDNA studies, with results combined using inverse-variance meta-analysis.
In summary, we confirmed four common variant associations with COVID-19 susceptibility and further show that they modulate disease severity and are likely to influence the function of IFNAR2, CCHCR1, TCF19 and SLC6A20. We also identified three novel associations with disease severity, which potentially provide genetic evidence for a role of hyaluronan in severe COVID-19. Lastly, we show that a genetic risk score based on the four common variants that we validated can be used to identify individuals at high risk of poor disease outcomes. Collectively, our analyses point to potential novel therapies and help identify patients at high risk of severe COVID-19.
ONLINE METHODS
Participating Studies
AncestryDNA COVID-19 Research Study
AncestryDNA customers over age 18, living in the United States, and who had consented to research, were invited to complete a survey assessing COVID-19 outcomes and other demographic information. These included SARS-CoV-2 swab and antibody test results, COVID-19 symptoms and severity, brief medical history, household and occupational exposure to SARS-CoV-2, and blood type. A total of 83,930 AncestryDNA survey respondents were selected for inclusion in this study [36, 37]. Respondents selected for this study included all individuals with a positive COVID-19 test together with age and sex matched controls. DNA samples were genotyped as described previously[36]. Genotype data for variants not included in the array were then inferred using imputation to the Haplotype Reference Consortium (HRC) reference panel. Briefly, samples were imputed to HRC version 1.1, which consists of 27,165 total individuals and 36 million variants. The HRC reference panel does not include indels; consequently, indels are not present in the imputed data. We determined best-guess haplotypes with Eagle version 2.4.1 and performed imputation with Minimac4 version 1.0.1. We used 1,117,080 unique variants as input and 8,049,082 imputed variants were retained in the final data set. Variants with a Minimac4 R2<0.30 were filtered from the analysis. For this study, an additional continuous severity phenotype was defined for a semi-overlapping set of in 4,448 survey-respondents that reported a positive COVID-19 test. The continuous severity score was derived by computing the first principal component across nine survey fields related to COVID-19 clinical outcomes. Six of the nine questions were binary: hospitalization, ICU admittance with oxygen, ICU admittance with ventilation, septic shock, respiratory failure, and organ failure due to COVID-19. Binary responses were encoded as 0 for “No” and 1 for “Yes”. Three symptom questions related to shortness of breath, fever, and nausea/vomiting symptoms were encoded as a unit-scaled variable based on the following mapping: 0=“None”, 0.2=“Very mild”, 0.4=“Mild”, 0.6=“Moderate”, 0.8=“Severe”, and 1.0=“Very Severe”. The three symptoms were chosen based on prior literature indicating their positive association with COVID-19 hospitalization[37]. The resulting score was standardized prior to association analysis.
Geisinger Health System (GHS)
The GHS MyCode Community Health Initiative is a health system-based cohort from central and eastern Pennsylvania (USA) with ongoing recruitment since 2006. A subset of 144,182 MyCode participants sequenced as part of the GHS-Regeneron Genetics Center DiscovEHR partnership were included in this study. Information on COVID-19 outcomes were obtained through GHS’s COVID-19 registry. Patients were identified as eligible for the registry based on relevant lab results and ICD-10 diagnosis codes; patient charts were then reviewed to confirm COVID-19 diagnoses. The registry contains data on outcomes, comorbidities, medications, supplemental oxygen use, and ICU admissions. DNA from participants was genotyped on either the Illumina OmniExpress Exome (OMNI) or Global Screening Array (GSA) and imputed to the TOPMed reference panel (stratified by array) using the TOPMed Imputation Server. Prior to imputation, we retained variants that had a MAF >= 0.1%, missingness < 1% and HWE p-value > 10−15. Following imputation, data from the OMNI and GSA datasets were merged for subsequent association analyses, which included an OMNI/GSA batch covariate, in addition to other covariates described below.
Penn Medicine BioBank (PMBB) study
PMBB study participants are recruited through the University of Pennsylvania Health System, which enrolls participants during hospital or clinic visits. Participants donate blood or tissue and allow access to EHR information[38]. The PMBB COVID-19 registry consists of patients who have positive qPCR testing for SARS-COV-2. We then used electronic health records to classify COVID-19 patients into hospitalized and severe (ventilation or death) categories. DNA genotyping was performed with the Illumina Global Screening Array, and imputation performed using the TOPMed reference panel as described for GHS above.
UK Biobank (UKB) study
We studied the host genetics of SARS-CoV-2 infection in participants of the UK Biobank study, which took place between 2006 and 2010 and includes approximately 500,000 adults aged 40-69 at recruitment. In collaboration with UK health authorities, the UK Biobank has made available regular updates on COVID-19 status for all participants, including results from four main data types: qPCR test for SARS-CoV-2, anonymized electronic health records, primary care and death registry data. We report results based on the 12 September 2020 data refresh and excluded from the analysis 28,547 individuals with a death registry event prior to 2020. DNA samples were genotyped as described previously [39] using the Applied Biosystems UK BiLEVE Axiom Array (N=49,950) or the closely related Applied Biosystems UK Biobank Axiom Array (N=438,427). Genotype data for variants not included in the arrays were inferred using three reference panels (Haplotype Reference Consortium, UK10K and 1000 Genomes Project phase 3) as described previously [39].
COVID-19 phenotypes used for genetic association analyses
We grouped participants from each study into three broad COVID-19 disease categories (Supplementary Table 1): (i) positive – those with a positive qPCR or serology test for SARS-CoV-2, or a COVID-19-related ICD10 code (U07), hospitalization or death; (ii) negative – those with only negative qPCR or serology test results for SARS-CoV-2 and no COVID-19-related ICD10 code (U07), hospitalization or death; and (iii) unknown – those with no qPCR or serology test results and no COVID-19-related ICD10 code (U07), hospitalization or death. We then used these broad COVID-19 disease categories, in addition to hospitalization and disease severity information, to create seven COVID-19-related phenotypes for genetic association analyses, as detailed in Supplementary Table 3. For association analysis in the AncestryDNA study, we excluded from the COVID-19 unknown group individuals who had (i) a first-degree relative who was COVID-19 positive; or (ii) flu-like symptoms.
Genetic association analyses
Association analyses in each study were performed using the genomewide Firth logistic regression test implemented in REGENIE [40]. In this implementation, Firth’s approach is applied when the p-value from standard logistic regression score test is below 0.05. We included in step 1 of REGENIE (i.e. prediction of individual trait values based on the genetic data) directly genotyped variants with a minor allele frequency (MAF) >1%, <10% missingness, Hardy-Weinberg equilibrium test P-value>10−15 and linkage-disequilibrium (LD) pruning (1000 variant windows, 100 variant sliding windows and r2<0.9). The association model used in step 2 of REGENIE included as covariates age, age2, sex, age-by-sex, and the first 10 ancestry-informative principal components (PCs) derived from the analysis of a stricter set of LD-pruned (50 variant windows, 5 variant sliding windows and r2<0.5) common variants from the array (imputed for the GHS study) data.
Within each study, association analyses were performed separately for four different ancestries defined based on the array data (African [AFR], admixed American [AMR], European [EUR] and South Asian [SAS]). We retained association results for variants with an imputation information score ≥0.3 and MAC ≥5, and either (i) MAF>0.5% or (ii) a protein-altering consequence (i.e. pLOF, missense or splice variants). Results were subsequently meta-analyzed across studies and ancestries using an inverse variance-weighed fixed-effects meta-analysis.
Identification of putative targets of GWAS variants based on colocalization with eQTL
We identified as a likely target of a sentinel GWAS variant any gene for which a sentinel expression quantitative trait locus (eQTL) co-localized (i.e. had LD r2 > 0.95) with the sentinel GWAS variant. That is, we only considered genes for which there was strong LD between a sentinel GWAS variant and a sentinel eQTL, which reduces the chance of spurious colocalization. Sentinel eQTL were defined across 174 published datasets (Supplementary Table 10), as described previously[41]. We did not use statistical approaches developed to distinguish colocalization from shared genetic effects because these have very limited resolution at high LD levels (r2 > 0.8)[42].
Genetic risk score (GRS) analysis of COVID-19 hospitalization and severity
First, in each study (AncestryDNA, GHS, UKB and PMBB), we created a GRS for each COVID-19 positive individual based on variants that were reported to associate with COVID-19 susceptibility in previous GWAS and that we (i) independently replicated; and (ii) found to be associated with COVID-19 severity. We used as weights the effect (beta) reported in previous GWAS (Supplementary Table 5). Second, we ranked COVID-19 individuals based on the GRS and created a new binary GRS predictor by assigning each individual to a high (top 5%) or low (rest of the population) percentile group. Third, for studies with >100 hospitalized cases, the we used logistic regression to test the association between the binary GRS predictor and risk of hospitalization (hospitalized cases vs. all other cases), including as covariates age, sex and ten ancestry-informative PCs. In addition to age and sex, we included as additional covariates established clinical risk factors for COVID-19 that were significantly associated in each respective study: BMI, smoking status, hypertension and chronic kidney disease for GHS; BMI, smoking status, hypertension and chronic obstructive pulmonary disease in Europeans of the UKB; hypertension, CKD, COPD, diabetes in AncestryDNA. We repeated the association analysis (i) using different percentile cut-offs for the GRS (5%, 10%, 20%, 30% and 40%); and (ii) to test the association with disease severity (severe cases vs. all other cases).
Results availability
All genotype-phenotype association results reported in this study are available for browsing using the RGC’s COVID-19 Results Browser (https://rgc-covid19.regeneron.com). Data access and use is limited to research purposes in accordance with the Terms of Use (https://rgc-covid19.regeneron.com/terms-of-use).
Competing interests
J.E.H., J.A.K., A.D., D.S., N.B, A.Y., A.M., R.L., E.M., X.B., H.G., D.S., F.S.P.K., J.D.B., C.O., A.J.M., D.A.T., A.H.L., J.M., K.W., L.G., S.E.M, M.J., S.B., W.J.S., A.R.S., A.E.L., J.M., J.O., L.H., M.N.C., J.G.R., A.B., G.R.A., and M.A.F. are current employees and/or stockholders of Regeneron Genetics Center or Regeneron Pharmaceuticals. G.H.L.R., M.V.C., D.S.P., S.C.K. A.Bal., A.R.G., S.R.M., R.P., M.Z., K.A.R., E.L.H., C.A.B. are current employees at AncestryDNA and may hold equity in AncestryDNA. The other authors declare no competing interests.
SUPPLEMENTARY FIGURES
Provided in a separate file.
Supplementary Figure 1. Summary of association results from the meta-analysis of two phenotypes related to disease severity among COVID-19 cases. (A) Phenotype COVID-19 positive hospitalized (N=2,052) vs COVID-19 positive and not hospitalized (N=9,098). (B) Phenotype COVID-19 positive severe (N=815) vs COVID-19 positive and not hospitalized (N=8,999).
Supplementary Figure 2. Three novel loci identified in the trans-ancestry meta-analysis of risk of COVID-19 hospitalization. (A) rs79833209 (5:163300447:C:T, effect allele C) in 5q34, near CCNG1. (B) rs4782327 (16:89117727:G:C, effect allele G) in 16q24.3 in ACSF3. (C) rs12461764 (19:51739497:G:T, effect allele G) in 19q13.41 near FPR1. RR: number of individuals homozygous for reference allele. RA: number of heterozygous individuals. RA: number of individuals homozygous for alternative (effect) allele. AAF: alternative allele frequency. OR: odds ratio.
Supplementary Figure 3. Association between the continuous severity score and key individual measures of severity in the AncestryDNA study. The continuous severity score was derived from the first principal component across nine survey fields related to COVID-19 clinical outcomes, including three symptoms, hospitalization, ICU admittance, and other severe complications due to COVID-19 illness (Methods). Plots reflect mean symptom severity (top three panels) or incident prevalence (bottom three panels) for several fields as a function of ascending severity decile. Symptom information was encoded as follows: 0=None, 0.2=Very Mild, 0.4=Mild, 0.6=Moderate, 0.8=Severe, and 1.0=Very Severe. A paucisymptomatic case corresponds to reporting symptoms of mild intensity or less for any of the symptom severity questions.
Supplementary Figure 4. Association between a four-SNP genetic risk score (GRS) and risk of hospitalization among COVID-19 cases of European ancestry.
(A) Association between high genetic risk and hospitalization. Overall risk of hospitalization is shown for individuals in the top GRS percentile, agnostic to the number of clinical risk factors present. The association was tested in three studies separately (AncestryDNA, GHS and UKB studies) using logistic regression, with established risk factors for COVID-19 included as covariates (see Methods for details). Results were then meta-analyzed across studies, for a combined sample size of 9,277 COVID-19 cases, including 1,832 who were hospitalized. N in red: number of COVID-19 cases in the top GRS percentile. N in grey: number of COVID-19 cases in the rest of population.
(B) Rate of hospitalization in UK Biobank and AncestryDNA study, after stratifying by the number of clinical risk factors and genetic risk score. High genetic risk: top 10% of the GRS. Low genetic risk: bottom 90% of the GRS (i.e. all other COVID-19 cases).
(C) Association between high genetic risk (top 10% of GRS vs. all other COVID-19 cases) and hospitalization, after stratifying by the number of pre-existing clinical risk factors. The association was tested in the UK Biobank and AncestryDNA studies, with results combined using inverse-variance meta-analysis.
SUPPLEMENTARY TABLES
Provided in a separate file.
Supplementary Table 1. Breakdown of COVID-19 status across the four studies included in the analysis.
Supplementary Table 2. Demographics and clinical characteristics of study participants.
Supplementary Table 3. Definitions used for the seven COVID-19 phenotypes analyzed.
Supplementary Table 4. Genomic inflation factor (lambda) across the seven COVID-19 phenotypes analyzed.
Supplementary Table 5. Eight variants associated with COVID-19 susceptibility in previous GWAS.
Supplementary Table 6. Association between eight published risk variants for COVID-19 and five disease susceptibility phenotypes in this study. P-values shown in red were significant after correcting for the 40 tests performed (P<0.00125).
Supplementary Table 7. Comparison of effect sizes between ancestries for the six published risk variants that were validated in this study.
Supplementary Table 8. Association between a COVID-19 severity score and seven variants (four known, three novel) associated with both disease risk and severity.
Supplementary Table 9. Missense or predicted loss-of-function variants in high linkage disequilibrium (LD, r2>0.95) with sentinel GWAS variants.
Supplementary Table 10. Published gene expression datasets used to identify sentinel expression quantitative trait loci (eQTL) that co-localized (LD r2>0.95) with sentinel GWAS variants.
Supplementary Table 11. Expression quantitative trait loci (eQTL) that co-localized (LD r2>0.95) with sentinel GWAS variants.
Supplementary Table 12. Association between a four-SNP genetic risk score (GRS) and risk of hospitalization among COVID-19 cases.
Supplementary Table 13. Association between a four-SNP genetic risk score (GRS) and risk of severe disease among COVID-19 cases.
Supplementary Table 14. Association between a four-SNP genetic risk score (GRS) and risk of hospitalization and severe disease, after stratifying COVID-19 cases by the number of pre-existing clinical risk factors for severe COVID-19.
Footnotes
References


