
Background
Humanitarian response actors evaluate crisis severity with the INFORM Severity Index, a publicly available metric. This index, however, has not undergone critical statistical review. If imprecise or incorrect, humanitarian response may be negatively impacted.
Methods The INFROM Severity Index is calculated from 35 publicly available indicators, which conceptually reflect the severity of each crisis We used 172 unique global crises from the INFORM SEVERITY Index database that occurred January 1 to November 30, 2019, or were ongoing by this date. We applied exploratory factor analysis (EFA) to determine common factors within the dataset. We then applied a second-order confirmatory factor analysis (CFA) to predict crisis severity as a latent construct. Model fit was assessed via chi-square goodness-of-fit statistic, Comparative Fit Index (CFI), Tucker-Lewis Index (TLI), and Root Mean Square Error of Approximation (RMSEA).
Results The EFA models suggested a 3- or 4-factor solution, with 46% and 53% variance explained in each model, respectively. The final CFA was parsimonious, containing three factors comprised of 11 indicators, with reasonable model fit (Chi-squared=107, with 40 degrees of freedom, CFI=0.94, TLI=0.92, RMSEA=0.10). In the second-order CFA, the magnitude of standardized factor-loading on the ‘societal governance’ latent construct had the strongest association with the latent construct of ‘crisis severity’ (0.73), followed by the ‘humanitarian access/safety’ construct (0.56). Conclusions: A metric of crisis-severity is a critical step towards improving humanitarian response, but only when it reflects real life conditions. Our work is a first step in refining an existing framework to quantify crisis severity.
Introduction
Humanitarian crises have substantial impact on those affected. Crisis-associated effects go beyond individual well-being to negatively influence communities, society, and the environment (1). Early and robust humanitarian assistance, therefore, can be key to mitigating these detrimental effects. However, the United Nations Office for the Coordination of Humanitarian Affairs (UNOCHA) increasingly highlights the gap between available funding for humanitarian response and needed funds. They also note an increased likelihood of the occurrence of the primary drivers of crisis - violent conflict, climate change, and slowed economic growth, which may lead to more crises in the future. For example, 2020 projections suggested a gap of $14 billion (USD) in needed funding, with an estimated 166.5 million people requiring humanitarian assistance (2). The crisis metric number of people in need of humanitarian assistance, which is available approximately annually and are based on data collected without standard approaches, is the current measure used to guide aid allocation in the United Nations (UN) system. Nevertheless, several calls have been made to improve the transparency of aid allocation (3,4) as humanitarian aid is also driven by media coverage (5) or based on political or economic relationships between nation-states (5,6). Given the potentially devastating and longstanding impact of a humanitarian crisis, it is critical to provide humanitarian assistance where it is needed most. Accordingly, a systematic metric of crisis severity is required to reflect needs in ongoing crises and predict severity if conditions change (7).
Developing a metric to quantify the severity of a crisis is challenging. First and foremost, humanitarian crises are diverse and evolving events, and many quantitative tools have been designed specifically for natural disasters at a static time point. Of the metrics that can be applied to a wide array of crises, most are designed for intra-country assessment of severity (e.g., the UNOCHA’s Humanitarian Needs Comparison Tool (8) or Kandeh et al.’s assessment of crisis-related vulnerability in Yemen (9)). While it is useful to assess geographic disparities, initial need for humanitarian assistance is often based on aggregate crisis estimates. For example, Bayram et al.’s 2012 Public Health Impact Severity Scale recommends using expert opinion to rank 12 indicators from the Sphere Project “Minimum Standards”, with the final severity score reflecting a weighted sum of the ranks (10). This framework, however, has yet to be implemented as the authors state limited availability of timely data. Eriksson et al. proposed a similar approach of ranking and summing key variables, but conceptualized severity as more holistic predictor of humanitarian need by drawing on psychological theory and ranked variable importance based on presence of the indicator in the literature (11). Like the Public Health Impact Severity Scale, use of their model has not been documented.
The current model used to quantify crises severity is the INFORM Severity Index, a publicly available metric (12). Developed via partnerships and through consensus building among experts, the index uses a conceptual framework that describes crisis severity as a complex, multi-factorial construct. However, the model has yet to undergo statistical review. We seek to critically evaluate the overall index model structure and assess the relationships between indicators. Our objective is to determine if the entire model or a subset of its components could be used to estimate crisis severity through a score. This review is an attempt to generate a more robust estimate of crisis severity.
Methods
Data
We analyzed data from the beta version of the INFORM Severity Index database, which was publicly available under the name ‘Global Crisis Severity Index (GCSI)’ at the time of the analysis (13). We extracted data from 172 unique global crises that were either ongoing as of November 30, 2019, or had occurred earlier in 2019. Appendix 1 describes how the INFORM Severity Index is calculated.
Measures
The GCSI uses a total of 35 ordinal indicators to represent three pillars (impact of the crisis, complexity of the crisis, conditions of the people), which we consider latent constructs (Table 1). Each ordinal indicator is scored based on continuous variables. The first construct, ‘the impact of the crisis’, is comprised of 11 indicators, all of which are ordinal versions of data collected from the specific crisis. The second construct, ‘the complexity of a crisis’, is comprised of 22 indicators. Of these indicators, 12 are publicly available indices; one is an ordinal version of data collected from the specific crisis; and the remaining nine indicators reflect qualitative information that is given a quantitative score. The final construct, ‘conditions of the people’, has two indicators, each of which uses estimates of the number of people in need of humanitarian assistance for the given crisis.
Global Crisis Severity Index (GCSI) latent constructs, presented alongside the indicators within each construct and their definition. All indicators, and their references, are further described within the GCSI spreadsheet under the sheet titled “Indicator Metadata”: https://data.humdata.org/dataset/inform-global-crisis-severity-index.
From these 35 indicators, we removed three indicators that had more than 25% of observations missing.
Analytical Approaches
We evaluated the relationships between 32 indicators in the GCSI conceptual framework through exploratory factor analysis (EFA). Based on an initial scree plot, we employed four maximum likelihood EFA models, ranging from 3- to 6 -factor solutions, each with an oblimin rotation, that is, correlation was permitted between factors (14). Missing values were imputed with the indicator median within all EFAs. We evaluated the models for the following characteristics: sums of squared loadings greater than 1.0 for each factor; factors that contribute to at least 10% to the overall variance; and collective contribution of at least 60% of the overall variance. Next, we reviewed the indicator factor loadings to identify latent constructs within the dataset.
Using the information learned from the EFA models, we removed indicators from the dataset if they did not provide unique information to identified factors as their inclusion in a final score could lead to either bias or imprecision. Indicators were removed if they had factor loadings less than 0.30 or cross-loaded onto more than one factor with a loading less than 0.20, or if cross-loadings had values in opposite directions (for example, 0.37 and −0.33).
With the reduced dataset and using standardized indicators, we applied a full information maximum likelihood (FIML) confirmatory factor analysis (CFA) to model crisis severity. First, we built first-order CFAs with relationships identified in the EFA. We removed indicators from the CFAs if they had residuals greater than 0.10 with indicators on different latent constructs. We also added covariances between indicators on the same latent construct if their residual correlation was greater than 0.10. Finally, we added a second-order latent construct to the model, which represented ‘crisis severity’. Model fit was assessed via chi-square goodness-of-fit statistic, Comparative Fit Index (CFI), Tucker-Lewis Index (TLI), and Root Mean Square Error of Approximation (RMSEA). Acceptable model fit was evaluated using recommended cut-offs characterized as CFI and TLI greater than 0.90 and RMSEA less than 0.08 (15).
We also estimated values for the latent crisis severity variable (i.e., factor scores) based on the factor loadings in the second-order CFA. Latent severity scores were normalized to range from zero to one.
Analyses were conducted using the R (version 3.6.2) packages psych, GPArotation, and lavvan; see Appendix 4 for primary analyses’ R code.
The Human Research Protection Office within the Center for Global Health at the Centers for Disease Control and Prevention reviewed the study and determined it to be non-research.
Results
Descriptive statistics for crisis indicators are presented in Table 2. Mean and median values of the ordinal scores did not differ greatly for most indicators, suggesting only slightly skewed distributions. Only four of the 32 indicators had an estimate for all 172 crises - all four indicators were under complexity of the crisis. The indicators related to people displaced from a crisis had the two lowest number of observations, as did the indicator for total number of people killed.
Descriptive statistics for Global Crisis Severity Index (GCSI) indicators: Mean, standard deviation, median, range, and total number of observations (n) are presented for each indicator. Indicators are highlighted to reflect GCSI latent constructs (GCSI dataset, 2019, N=172).
EFA
The EFA models suggested a 3- or 4-factor solution (Table 3). While the 5- and 6-factor solutions had greater cumulative variance explained. The proportion variance explained for each factor did not add substantive information to the model. This was also evident in the indicator factor loadings for these models, which showed more cross-loadings between indicators on factors with less than 10% proportion variance explained (see Appendix 2 for factor loadings for 5- and 6-factor solutions).
Exploratory Factor Analysis summary information for each factor solution identified: sums of squared loadings, proportion variance explained and cumulative variance (GCSI dataset, 2019, N=172).
Additional examination of the factor loadings in 3- and 4-factor models highlighted three primary findings (Table 4). First, several indicators had factor loadings less than 0.30, which implies that they do not contribute to any of the factors. Second, indicator cross-loadings onto multiple factors was common, and thus, these indicators did not provide unique information. Finally, the indicators grouped into a pattern similar to sections of the GCSI conceptual framework. In both solutions, factor 1 was comprised of indicators related to societal constructs (and originally conceptualized as part of the ‘complexity of the crisis’), while indicators within the ‘impact of the crisis’ construct grouped together in factor 2. Factor 3 was comprised of indicators related to humanitarian access and safety; while the fourth factor was a further disaggregation of factor 2. Of note, the EFA results did not show that indicators related to ‘conditions of the people’ had mathematical importance. Indicators excluded from subsequent CFA models are shown in Table 4.
Global Crisis Severity Index (GCSI) Indicators factor loadings for each Exploratory Factor Analysis (EFA) factor solution. Factor loadings are only presented if greater than the absolute value of 0.3 (GCSI dataset, 2019, N=172).
CFA
We initially built four different CFA models to reflect the relationships identified with the factor loadings in the EFAs; each of the four models had an increasing number of latent constructs (from three constructs to six constructs).
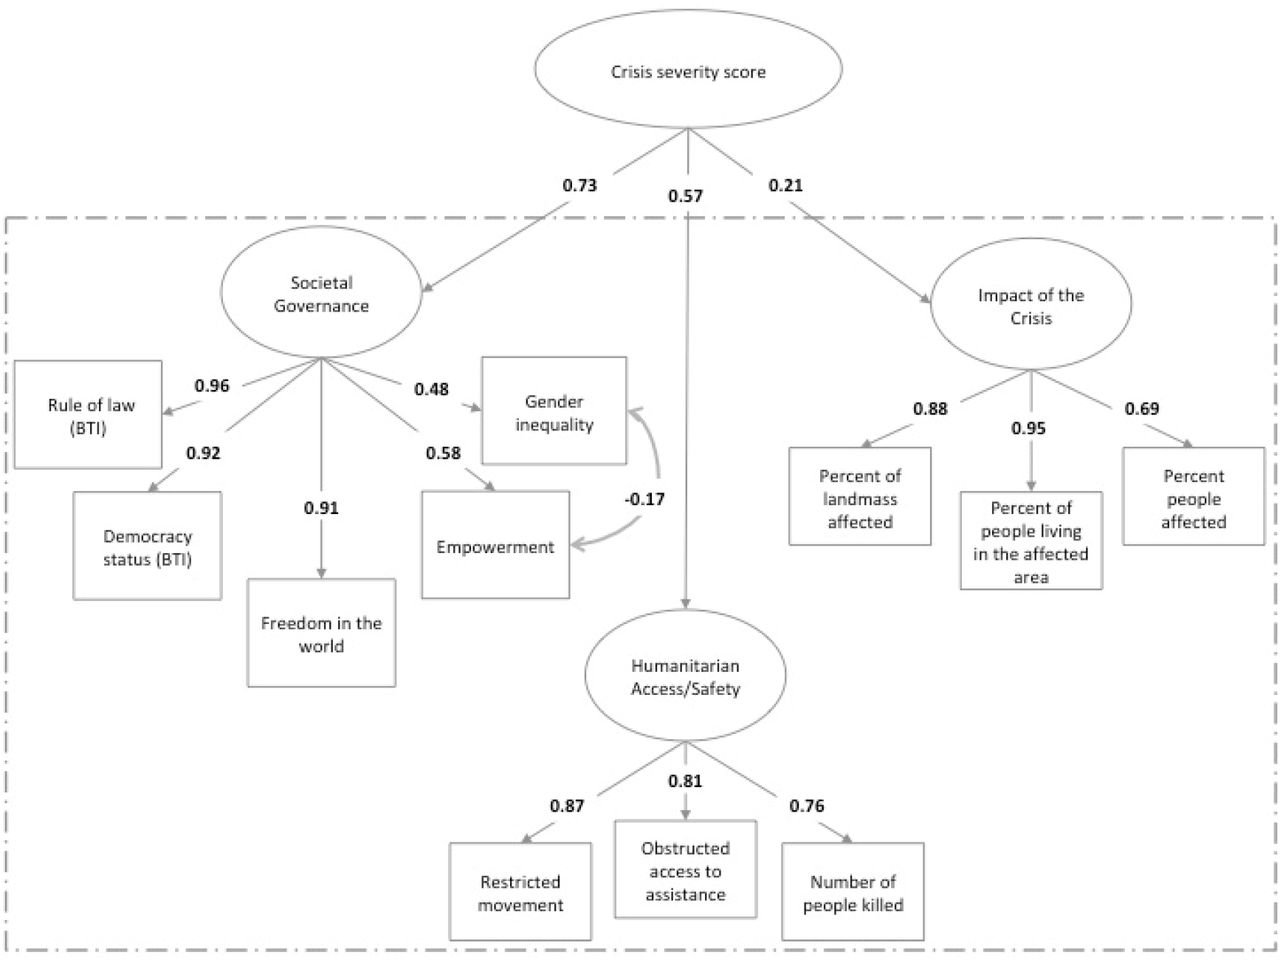
The CFA with three latent constructs (base model) was appropriately specified but showed poor fit (Table 5). Indicators were removed and covariances added to reflect the residual correlations of indicators across the dataset (see Appendix 3 for correlation matrix) until the best model fit was generated (final model in Table 5). The final CFA contained 11 indicators: rule of law, democracy, freedom, gender inequality, empowerment, number of people killed, restricted movement, obstructed access to assistance, percent of landmass affected, people living in the affected area, people affected. We used this model to create a second-order CFA (Figure 1). The model fit statistics of the second-order CFA were the same as the fit statistics of the final first-order CFA model (Table 5). In the second-order CFA, the magnitude of standardized factor-loading on the ‘societal governance’ latent construct had the strongest association with the latent construct of ‘crisis severity’ (0.73), followed by the ‘humanitarian access/safety’ construct (0.56).
Fit statistics for first-order Confirmatory Factor Analysis (CFA) models: Chi-squared goodness of fit test statistic, Comparative Fit Index (CFI), Tucker-Lewis Index (TLI), and Root Mean Square Error ofz Approximation (RMSEA) Index (GCSI dataset, 2019, N=172).

Second-order Confirmatory Factor Analysis (CFA), with factor loadings. The ovals reflect latent variables and the boxes reflect indicators. The dashed box contains the final first-order CFA.
The CFA with four latent constructs had a non-positive covariance matrix when a second order latent variable was added. No solutions were found for the 5 or 6 latent variable models.
Severity score
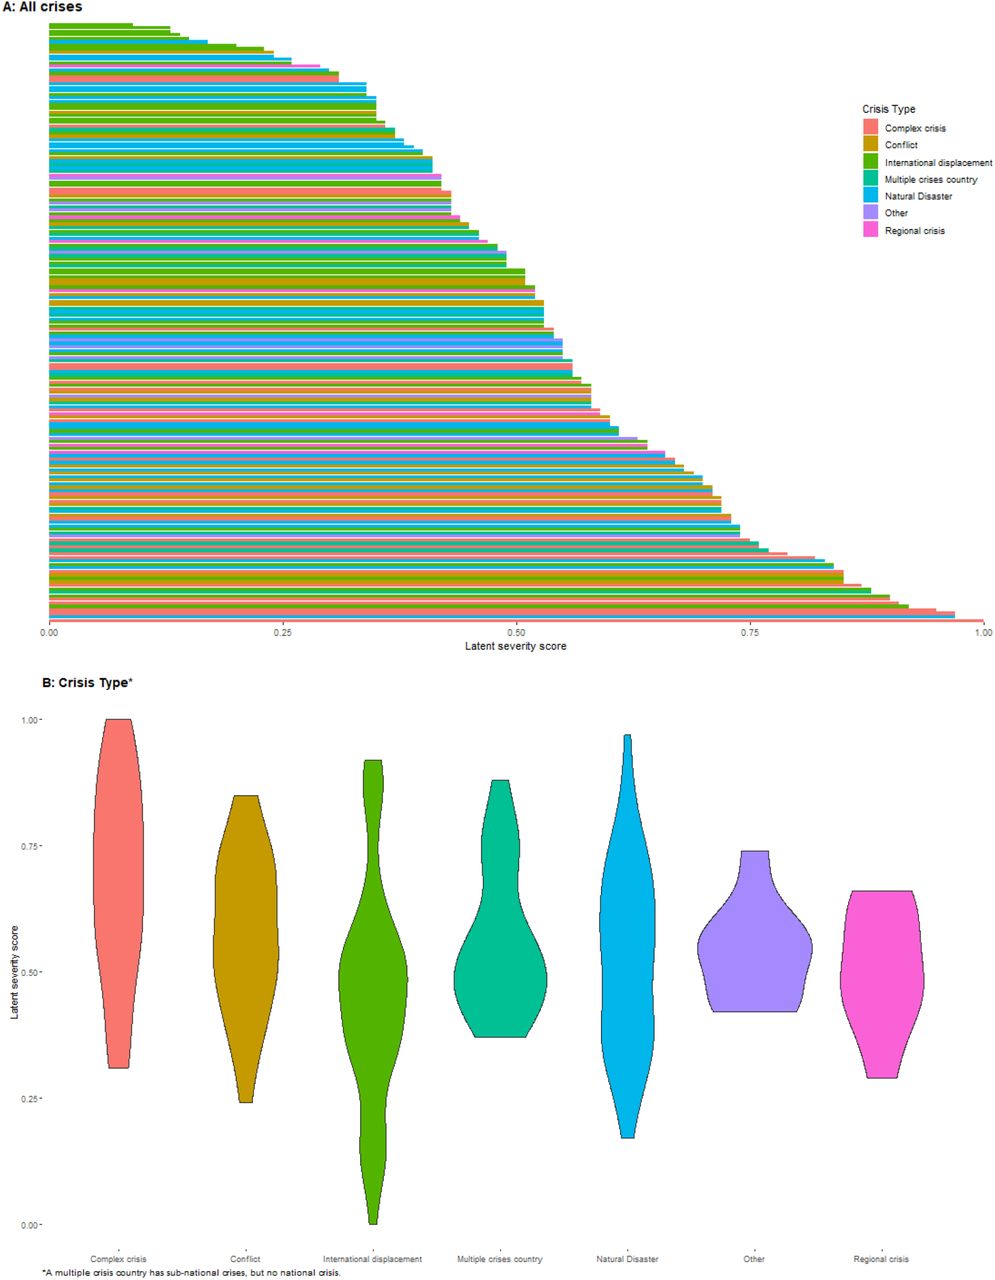
The mean and median latent severity score for all crises were similar, at 0.53 and 0.54, respectively. Severity scores were highest in complex crises and fell within the upper two-thirds of all scores (Figure 2). Regional crises, conversely, had a lower mean severity score. These types of crises fell into the bottom two-thirds of the range. Crises in countries that had a mean severity score of greater than 0.90 included Syria, Somalia, Yemen, and The Democratic People’s Republic of Korea, whereas countries with mean severity scores less than 0.10 included Costa Rica and Brazil.

Discussion
Our analyses showed that crisis severity among a wide array of events can be measured best through the optimal combination of 11 of the total 35 GCSI indicators. The model showed acceptable fit, but slightly higher error than the standard cut point; however, some debate exists on the usefulness of applying a single heuristic to assess model fit within factor analysis (16), and collectively, the model results are reasonable. The strongest predictors of severity were a suite of indicators related to social structure/governance of a given nation state (rule of law, freedom, gender inequality, and empowerment), followed by indicators that were proxy measurements of humanitarian access/safety (number of people killed, restricted movement, and obstructed access to assistance). The weakest, although still relevant, predictors were related to the crisis impact on people and the environment. Holistically, these indictors suggest that fragile states with limited accessibility for humanitarian actors have larger, negative consequences, which provides evidence that the final model aligns with humanitarian actors’ experiences.
Good governance is intrinsically related to avoiding or mitigating a humanitarian crisis (1). Broadly, economic and political stability are key components to this success, with inequality between social groups cited as a driver of crises and conflicts (17). It is unsurprising that humanitarian practitioners call for more robust inclusion of conflict early warning into preparedness systems for humanitarian crises (18). Indeed, considerable funding has been provided to post-conflict states for democracy development and peacebuilding, albeit with mixed success (19,20). Ample evidence supports these patterns, as data from the last 15 years show most humanitarian crises are re-occurring in the same countries, many of which are fragile states (2). Chad, the Central African Republic, the Democratic Republic of Congo, Somalia, and Sudan have all had 15 crises between 2005 and 2015.
Humanitarian access, the ability to reach the most vulnerable, can be limited through various mechanisms. Restricted movements, which are common in conflicts and complex humanitarian crises, inhibit connections between aid workers and communities (21). Access can also be reduced through violence and obstruction. Within armed conflicts, bureaucratic and security constraints, and violence against aid workers and facilities distributing aid, have been cited as rationale for greatly reduced humanitarian access (21,22). For example, in the Syrian crisis, which is considered one of the worst in the world by humanitarian experts, UNOCHA reported that 1.1 million people were in need of humanitarian assistance in hard-to-reach-places in 2018; during this same year, access was inhibited by 142 attacks on health facilities, with 102 people dead and 189 injured (23). Thus, it is not surprising that our model results give weight to indicators reflecting the quality of humanitarian access (e.g., restricted movements, obstructed access, and number of people killed) for a given crisis.
Importantly, our final model differs from the original GCSI in two fundamental ways. First, we presented a parsimonious model, which removed 24 GCSI indicators. The original GCSI was calculated using inconsistent approaches, and notably, does not account for basic statistical properties of correlated data. The high correlation in the dataset inhibits meaningful interpretation of combined values from the indicators. Second, we removed an entire GCSI pillar (‘conditions of the people’) as a result of insights from the EFA models, which has programmatic significance. Indeed, the data underlying the excluded indicators are routinely collected to estimate the number of people in need of humanitarian assistance. Given the strong value of these indicators to practitioners, we re-ran the final model and included these two indicators as standalone independent variables (Appendix 5). Of note, we did not include the two indicators as latent constructs, as our EFA analyses showed that they were not correlated. This sensitivity analysis suggested that a model including the number of people affected indicator has comparable model fit and yields similar severity scores to the second-order CFA model.
Our analysis, however, is limited by the data available for inclusion. First, the index includes a combination of static and dynamic variables. It is possible that static variables, such as those used to estimate social structure/governance are distal determinants of a crisis, rather than proximal measures. Additionally, we used population average data, which masks any disparities experienced within a population. Several population groups, namely, children, women, and the disabled, have worse crisis-related health outcomes than the rest of the population. Moreover, data from humanitarian crises are difficult to obtain, highly inaccurate, and highly correlated. While our sensitivity analyses assessing data quality suggest that our final model contained data that was no more or less reliable than the indicators excluded (Appendix 6), we cannot account for the lack of precision within the dataset. We included two indicators based on expert assessment of qualitative information (restricted movement, and obstructed access to assistance), which may be subject to imprecision or bias. Likewise, mortality estimates, which we also included in the final model, have been contested for accuracy in past crises (24,25). Additionally, the indicator for ‘relative people living in the affected area’ is highly correlated with many of the other variables in the final model. In an ideal scenario, this indicator would be removed from the model, however, when it was, the models did not converge. Thus, one limitation of retaining the variable is a slightly higher error than desired. And finally, a gold standard for crisis severity is unavailable to validate our model results. In lieu of traditional validation, we compared the latent severity scores to the original GCSI scores (Appendix 7). This sensitivity analysis suggested that the latent severity score may be a closer measure to true crisis severity than the original GCSI and s likely generalizable to future crises that may occur. Additionally, because the calculations are derived from a model that weights indicators based on their correlations, we do not provide guidance on how to calculate crisis severity with raw data. Replication of the score requires re-running the final CFA. Further research is needed to link this framework with a field friendly, non-model-based estimate for humanitarian actors.
UN-coordinated humanitarian responses are lasting longer (26), with the average 2005 response ongoing for about four years compared to the 2017 response of seven years. Meanwhile, human and financial resources for humanitarian response are limited. More complicated responses, coupled with calls for increased resources, emphasize the need for objective tools to guide resource allocation. A metric of crisis-severity would serve this purpose, but, only if the metric is scientifically robust. Our work is a first step in refining an existing framework to quantify crisis severity. As presented here, we recommend future iterations of modeling crisis-severity consider severity as a multi-faceted construct. In doing so, practitioners should strive to create a parsimonious model. Inherently, humanitarian data are subject to high levels of uncertainty, and nonparsimonious models may further limit clear interpretation of severity within this context. Additionally, we recommend that future work consider longitudinal metrics of severity, as crises change within a given location over time. With these recommendations in place, humanitarian actors can apply the humanitarian principle of impartiality when determining where need is the greatest and to best respond to crises.
Data Availability
Data are publicly available.
https://data.humdata.org/dataset/inform-global-crisis-severity-index
CDC disclaimer
The findings and conclusions in this report are those of the authors and do not necessarily represent the official position of the Centers for Disease Control and Prevention.
Acknowledgements
The following individuals provided value feedback on our methods and results: Mahlet Woldetsadik, Luca Vernaccini, Stefano Disperati, and Karmen Poljansek. We thank them for their insights, which helped to strengthen this analysis.


