
Abstract
In early 2020 COVID-19 turned into a global pandemic. Non-pharmaceutical interventions (NPIs), including the isolation of infected individuals, tracing and quarantine of exposed individuals are decisive tools to prevent onwards transmission and curb fatalities. Strategies that combine NPIs with SARS-CoV-2 testing may help to shorten quarantine durations while being non-inferior with respect to infection prevention. Thus, combined strategies can help reducing the socio-economic burden of SARS-CoV2 and generate greater public acceptance. We developed a software that enables policy makers to calculate the reduction in transmissibility through quarantine or isolation in combination with arbitrary testing strategies. The user chooses between three different modi [(i) isolation of infected individuals, (ii) management of potentially infected contacts and (iii) quarantine of incoming travelers], while having total flexibility in customizing testing strategies, as well as setting model parameters. The software enables decision makers to tailor calculations specifically to their questions and perform an assessment ‘on the fly’, based on current evidence on infection dynamics.
Underneath, we analytically solve a stochastic transit compartment model of the infection time course, which captures temporal changes in test sensitivities, incubation- and infectious periods, as well as times to symptom onset using its default parameters.
Using default parameters, we estimated that testing travelers at the point of entry reduces the risk about 4.69 (4.19,4.83) fold for PCR vs. 3.59 (3.22, 3.69) fold for based rapid diagnostic tests (RDT, 87% relative sensitivity) when combined with symptom screening. In comparison to 14 days of pure quarantine, 8 (PCR) vs. 10 (RDT) days of pre-test quarantine would be noninferior for incoming travelers as well as for contact person management. De-isolation of infected individuals 11 days after symptom onset reduces the risk by >99fold (7.68,>1012).
This tool is freely available from: https://github.com/CovidStrategyCalculator/CovidStrategyCalculator
Introduction
The SARS-CoV-2 outbreak began with a cluster of pneumonia cases of unknown origin in Wuhan City, China 1. In January 2020, Chinese authorities imposed a cordon sanitaire on Wuhan, but COVID-19 cases had already been exported to countries outside of China 2; the World Health Organization (WHO) declared a pandemic in March 2020 3. Since then, SARS-CoV-2 has continued to spread globally. At the time of writing, over 50 million cases of COVID-19 have been confirmed worldwide, including over a million deaths 4. Given the high fatality rate of COVID-19 5-7, emerging evidence of its mid- or even long term sequelae 8-12, and its capacity to overwhelm healthcare systems 13-16 and inflict economic damage 17,18, it is imperative to contain - or at least mitigate - the spread of SARS-CoV-2.
Although scientific progress has been made at unprecedented speed, resulting in rapid expansion and improvement of therapeutic modalities 19-23, curative treatment options are still lacking; promising vaccine candidates are under clinical development but may not be available at sufficient amounts to achieve population level impact in the near future 24-27. Non-pharmaceutical interventions (NPIs) are presently, and will remain, important measures to curb SARS-CoV-2 spread for as long as the pandemic is ongoing. The large-scale lockdowns implemented by governments all over the world during the first wave of the pandemic have proven extremely successful at controlling the outbreak and limiting the number of deaths, but induced significant economic damage 28,29. As lockdowns were gradually lifted, many of the more limited NPIs were maintained, with the goal of keeping the number of infections low and maintaining an effective Rt < 1. These NPIs include social distancing and hygiene measures, mask mandates and restrictions on public gatherings. In addition, given that a substantial fraction of SARS-CoV-2 transmissions originates from asymptomatic and presymptomatic individuals 30-34, a combination of public health measures termed Test-Trace-Isolate (TTI) is key to all successful containment strategies, which involves: (i) diagnostic testing that prioritizes, but is not limited to, symptomatic cases, (ii) isolation of confirmed cases, as well as (iii) tracing and quarantining exposed contacts 35. TTI is usually complemented with quarantine for incoming travelers. The term ‘isolation’, which refers to the separation of people with confirmed infection, is distinct from the term ‘quarantine’, which refers to the separation of people who were -potentially or certainly- exposed to SARS-CoV-2. For quarantine, WHO recommends a length of 14 days 36 and for isolation, a length of at least 13 days 37. However, it is not rare that different strategies are implemented at the national, and sub-national or institutional levels. This may be due to perceived socioeconomic pressures 38, to staffing concerns, especially with respect to health care workers when hospital systems are under strain 39, or to patient care considerations, given the detrimental effect that long isolation periods can for example have on cognitively impaired patients 40. In these settings, testing is frequently used to shorten the duration of quarantine and/or isolation. Given that antigen-based rapid diagnostic tests (RDT) are being used increasingly 41, strategies that are based on combined testing and quarantine/isolation criteria may gain even more momentum in the near future.
Through mathematical modelling, strategies have been proposed that combine regular surveillance testing and isolation test-positive cases to enable regular service in e.g. educational institutions 42,43. This seminal work has been complemented by real-world data, where such approaches have been successfully implemented in businesses, in some professional sports disciplines 44 as well as in healthcare and nursing facilities 45. At the time of writing, Slovakia and Austria are performing nation-wide diagnostic screens for SARS-CoV2. Such large-scale approaches have previously not been implemented for the general public, due to costs and logistic constraints. Also, voluntary testing may not be suitable to end the epidemic in general 46.
Durations of quarantine and isolation are under ongoing scrutiny to find an ideal balance between infection prevention and the socio-economic consequences they impose and have been the focus of several modelling studies 35,47-51. Herein, we developed models of within-host infection dynamics that enable assessing arbitrary quarantine-testing and isolation strategies with respect to their capacity of reducing SARS-CoV2 risk. We implemented these models into a user-friendly software which serves to enable the rational, evidence-based design of suitable non-pharmaceutical interventions ‘on the fly’.
Currently, WHO recommendations for quarantine are based on the maximum incubation time observed in studies done during the beginning of the pandemic 36,52, whereas several national guidelines on quarantine and testing may sometimes be determined in the political discourse. While consultation of researchers helps to improve strategies, quantifying the added benefit of a strategy-adaptation is often impossible, at least in a timely manner. We aim to fill this gap, by (a) consolidating our current knowledge on SARS-CoV2 infection dynamics and (b) by computing the consequential reduction in transmission risk for user-defined quarantine, isolation and testing strategies. The software allows (c) calculating the benefit of NPI strategies instantaneously while (d) offering total flexibility in its design. Moreover, (e) the user can distinguish between different risk-posing scenarios (contact management, travellers and isolation) and (f) adjust underlying model parameters, if needed. This allows corroborating a policy-making discourse by realistic numbers while the discussion is ongoing. Furthermore, the software can be used as a tool to communicate with the public and explain the benefit of quarantine and isolation strategies, improving their compliance.
While the software evaluates quarantine, isolation and testing strategies entirely from the perspective of infection prevention, users can use the tool to compute variables for more general cost-benefit analysis that weigh infection prevention against socio-economic factors. The tool is freely available under the GNU Lesser General Public License (LGPL) v3.
Methods
Model of infection dynamics
We model the time-course of SARS-CoV2 using a stochastic transit compartment model, as depicted in Fig. 1A. This model structure allows sufficient flexibility to resemble clinically observed infection dynamics and enables the direct use of published quantities, such as e.g. the ‘mean duration of the incubation phase’ in model simulations. We distinguish different phases by whether the virus is (i) detectable, the individual (ii) has symptoms and (iii) may be infectious (Fig. 1A). These three attributes describe a minimal set of properties important to evaluate SARS-CoV2 non-pharmaceutical control- and testing strategies, allowing to select timepoints for testing, incorporate symptom-based screening and to quantify the residual risk at the end of a testing- or quarantine strategy. We use a stochastic formalism to reflect inter-individual differences in infection time-courses, such as the “incubation time” or the “time of infectiousness”. The mathematical details of the model are exemplified in Supplementary Note 1. The model is solved analytically, enabling the user to assess and compare SARS-CoV2 control strategies “on the fly”. Initial states are defined depending on the evaluated context (contact management, quarantine of travelers or isolation) as elaborated in Supplementary Note 1.
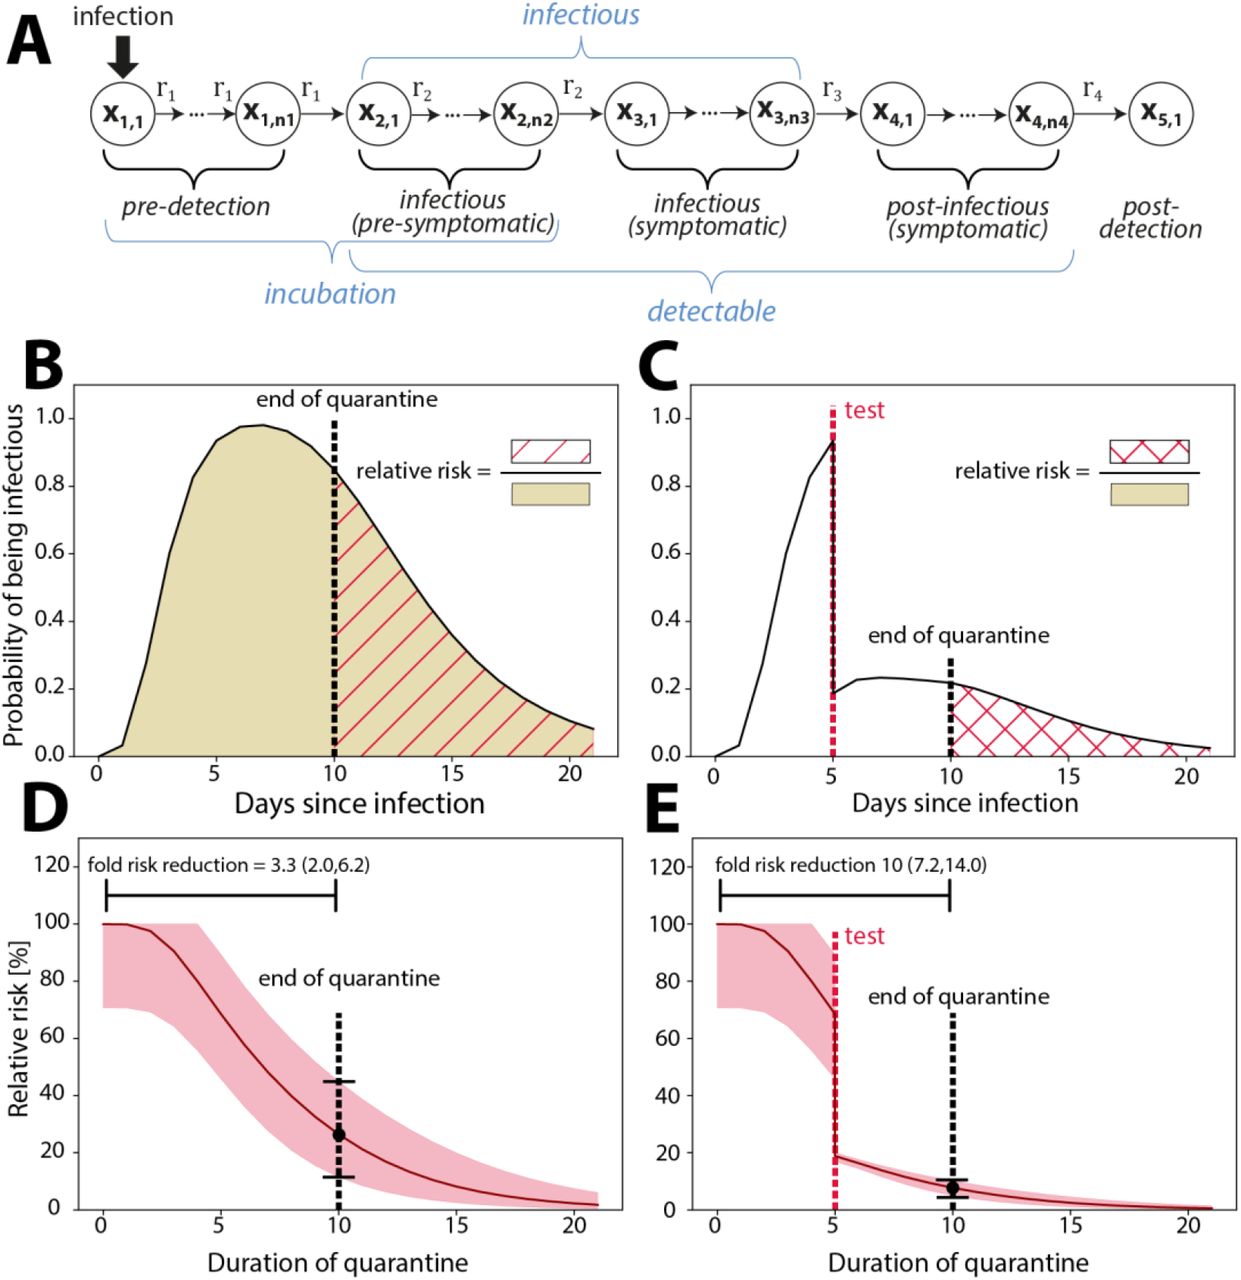
Simulation of Quarantine and testing strategies. A: Model structure. B. Model simulated probability of infectiousness. The shaded area indicates the risk emanating from an infected individual. If a quarantine was imposed until day 10 (dashed black vertical line), the risk of transmission would relate to the red-dashed area. Hence the risk reduction denotes the risk after the quarantine divided by the risk without quarantine. C. Model simulated probability of infectiousness when a test (dashed red vertical line) was performed at day 5. If the test was positive, the person would go into isolation, thus not posing a risk, whereas there is a residual risk that the person is infectious, if the test is negative (false negative). The risk after a 10 day quarantine (dashed black vertical line) with a test at day 5 is indicated by the red crossed area. D. Relative risk corresponding to a pure quarantine as indicated in panel B. E. Relative risk corresponding to a testing and quarantine scenario as indicated in panel C.
Parameters
The software allows full flexibility with regards to parameter choices, that, for example, determine the time-course of infection, the proportion of asymptomatic cases and the test sensitivity and much more. However, a set of default parameters is provided, that has been carefully derived by fitting the model’s parameters to available clinical and in-house data on the incubation time 53, the off-set of infectiousness after symptom onset or peak virus load 54-56, as well as the time-dependent test sensitivities 57,58. Details on the parameter fitting procedure and analysis of infectivity profiles are provided in Supplementary Note 2-3.
Calculation of relative risk
The goal of quarantine or isolation strategies is to reduce the risk of onwards transmission. Mathematically, the residual risk is the probability that an individual, who is released from a non-pharmaceutical intervention (NPI) is- or may become infectious and potentially spread the disease:
 where
where  integrates over the probability that the person is infectious after release from quarantine at time t, whereas
  ntegrates the over the probability of being infectious in the case where the person had not been isolated, or put into quarantine (Fig. 1B-C). So, in other words, the relative in transmission risk emanating from the individual.
The fold risk reduction is calculated as
 The pre-entry risk can be calculated using the ‘prevalence estimator’ functionality of the software or be adjusted by the user.
Prevalence estimation
The software allows, based on a user defined incidence history and the above described model to perform a prevalence estimation:
 where -T is the time horizon (preceding 5 weeks) before the current date t0 and e(t0-s)A ps(x) is the analytic solution of the infection dynamics model. The initial condition ps(x) for day s prior to today is computed from the incidence reports of the country of interest and a user-defined proportion of undetected cases as outlined in Supplementary Note 1.
Implementation
The software is as a standalone graphical user interface (GUI). Sourcecodes as well as pre-built executables are freely available for Windows, Mac and Linux from https://github.com/CovidStrategyCalculator/CovidStrategyCalculator. The tool itself is implemented in C++ using the Qt (Version 5.9.5) and Eigen (Version 3.3.7) library and is provided under the GNU GPLv3 license.
Results
COVIDStrategyCalculator can quantify the concurrent effects of quarantine and testing strategies
The utilized stochastic transit compartment model is shown in Fig.1A. The model consists of 5 phases (incubation, pre-symptomatic, symptomatic, post-symptomatic and post-detection). Each phase is subdivided into several sub-compartments, which allows to accurately capture inter-individual differences, as well as the shape of SARS-CoV-2 infection dynamics (Fig. SN.2 in Supplementary Note 1). For illustration we simulate a time course of infectiousness for a virtual patient cohort who is held in quarantine after exposure (Fig. 1B). In this illustrative example, the person is released from quarantine at day 10. This allows to quantify the relative risk emanating from this individual in terms of the ratios of the areas under the infectivity curve from the end of quarantine (dashed area) vs. the entire interval (filled area). In Figure 1C, a diagnostic test is performed at day 8. If the test is positive, the individual would go into isolation, and consequently not pose a risk. Therefore, the probability that the individual is actually infectious and not in quarantine is decreased in relation to the test sensitivity at the time of the test. Again, the relative risk is the ratio of the area under the infectiousness curve from the end of the quarantine (crossed area in Fig. 1C), relative to the entire interval (shaded area in Fig. 1B). The time-profiles of the corresponding relative risks for the two illustrative scenarios are shown in Fig. 1 C-D. The corresponding fold risk reduction (=1/relative risk(t)) for 10 days quarantine would be 2.6 (1.90; 5.26) and 10.0 (7.2; 14.0) for a 10 days quarantine with a PCR-test on day 5, as indicated by the vertical bars in Fig.1C-D. In the testing and quarantine example (Fig. 1C & E), the pre- and post-test-quarantine had a minor effect on the risk reduction, whereas the test reduced the relative risk considerably. In this example, the pre-test-quarantine increased the test-sensitivity considerably, making the combined strategy effective.
In summary, these examples illustrate how the model can be used to assess the concurrent effects of quarantine and testing strategies.
COVIDStrategyCalculator reproduces known incubation-, infectivity- and time-dependent test sensitivity profiles
The software allows full flexibility with regards to parameter choices, that, for example, determine the time-course of infection, the proportion of asymptomatic cases and the test sensitivity, etc., and can thus be tailored to user-specific queries. We have however carefully calibrated the models’ default parameters to reproduce published and in-house clinical data on the incubation time 53, the off-set of infectiousness after peak virus load/symptom onset 54-56,59, as well as the time-dependent test sensitivities 57,58.
Figure 2A shows the cumulative time-to-symptom-onset (grey shaded area) compiled in a meta-analysis of 56 studies 53, together with the model-predictions (solid- and dashed lines) using the default parameters. As can be seen, the utilized model perfectly reproduces not only the mean duration of incubation, but also the entire waiting time distribution. Figure 2B shows a summary of data sets used to evaluate the duration of infectiousness after peak virus load/symptom onset (shaded areas) 54-56,59, including the analysis of in-house data (Supplementary Note 2-3). The depicted data is scaled to represent the relative reduction in infectiousness assessed by culture-positivity, as well as viral load dynamics (details on the data analysis and parameter fitting procedure are provided in Supplementary Note 2-3). While Singanayagam et al. and van Kampen et al. 55,56 report relative culture-positivity over time, we used the in-house data to derive and fit a mechanistic model Supplementary Note 3 that allows to convert virus load profiles post-symptom onset into infectivity profiles. We used the mechanistic model to derive infectivity profiles from viral loads reported by Ejima et al. 54 and from the Charité 59.
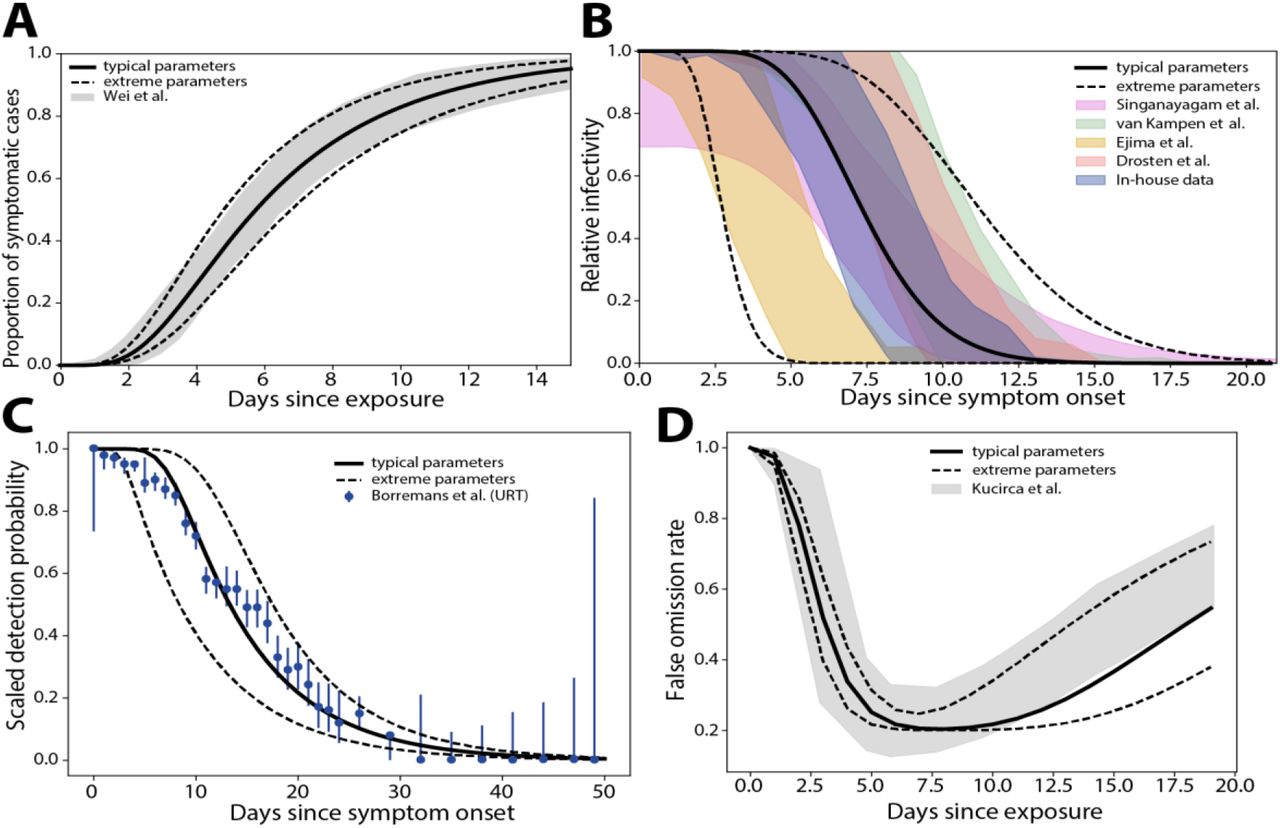
Model validation. Published- and data-derived SARS-CoV2 intra-patient dynamics (shaded areas), as well as model-predicted dynamics with default parameters (lines). A. Duration of incubation. The cumulative time-to-symptom onset from a meta-analysis of fifty six studies is shown (grey shaded areas) 53, together with the modelpredicted time-to-symptom onset (solid line: typical dynamics, dashed lines: upper and lower extremes). B. Relative infectiousness after symptom onset/peak viral load extracted from Singanayagam et al. and van Kampen et al. 55,56, deduced from in-house data (Supplementary Note 3) and derived from viral load kinetics reported by Ejima et al. 54,59are shown as shaded areas, whereas model-predicted infectiousness profiles are depicted by lines (solid line: typical dynamics, dashed lines: lower and upper extremes). C. Time-dependent PCR sensitivity after symptom onset reported by Borremans et al. 57 (error bars) together with model simulated PCR sensitivity using default parameters (solid line: typical dynamics, dashed lines: lower and upper extremes). D. Time-dependent false omission rate as reported by Kucirca et al. 58 (shaded area). Solid- and dashed lines show model simulations with typical- and upper/lower extreme parameters. Details on the parameter fitting procedure and analysis of infectivity profiles are provided in Supplementary Note 2-3.
The infectiousness profiles show a marked dispersion between different studies, which may be partly due to the investigation of different cohorts (mild-moderately ill 55 vs. hospitalized severely ill patients 56, differences in the definition of ‘symptom onset’, and methodological differences in the laboratory assays used to assess infectiousness. We adjusted the models’ default parameters to each study individually (Supplementary Note 2) and derived parameter ranges that capture the entire range of infectivity profiles, emphasizing on the tail of the distribution, which is most important to accurately capture the waning off of infectiousness. Figure 2C shows the decrease of detection probability 57, whereas Figure 2D shows the reported time-dependent false omission rate FOR(t) of the PCR diagnostics (shaded areas) 58, as well as respective model-predicted dynamics with default parameters (lines). As shown, the model captures the time-dependent assay sensitivity reasonably well with default parameters. A small deviation at the beginning (broad range of reported uncertainty in the data), may be due to uncertainties in determining the time of symptom onset (Fig. 2C) and infection (Fig. 2D).
In summary, the developed model, with default parameters, integrates the current state of knowledge on SARS-CoV-2 infection dynamics into a single mathematical model that can be used for designing non-pharmaceutical SARS-CoV2 control strategies. Details on the parameter fitting procedure and analysis of infectivity profiles are provided in Supplementary Note 2-3.
Software utilization
The emphasis in software design has been put on combining ease-of-use with maximal flexibility. Figure 3A shows a screenshot of the strategy evaluation window of the tool, where the user can set up an arbitrary strategy (1.). Simulating a chosen strategy, will depict the results table (2.) and graphics regarding the assay sensitivity and relative risk profile (3.), as well as numeric values regarding the time-dependent assay sensitivity (4.) to ease the selection of times to perform diagnostic tests. Figure 3B shows a zoom of the opening window: The different tabs allow to evaluate a strategy (5.), set parameters (6.) or perform a prevalence estimation (7). In field (8), the user can select between the different modi of the software; i.e. to assess quarantine- and testing strategies for (i) contact management (known time of exposure), for (ii) incoming travelers from high-risk areas (unknown time of exposure), as well as to evaluate (iii) de-isolation strategies.

Screenshot of CovidStrategyCalculator. A. The main window consists of four components: user input (1), a result log (2), time course trajectories (3) and test efficacy reports (4). Reported results include the pre-procedure risk (prevalence), post-procedure risk (residual risk) and fold risk reduction. B. Zoom-in on the strategy-related user input. C. Model parameter input tab. D. Prevalence estimator input tab.
In the contact management mode, the user sets the time passed since the putative infection (9), a duration of quarantine (10) and whether symptom screening is performed (checkbox in 11). Symptom screening would imply that an individual who develops symptoms is not released into society, but rather goes into isolation. The expected level of adherence to the chosen strategy can be set in (12). The user can also decide on whether diagnostic tests should be conducted during the quarantine time (check-boxes in 13) and select whether PCR-tests or antigen-based rapid diagnostic testing (RDT) should be performed. Pressing ‘run’ will then evaluate this user-defined strategy and depict the results in terms of the residual risk and the fold risk reduction in a table format on the right (field 2 in Fig. 3A).
When choosing the incoming travellers mode (field 8 in Fig. 2B), the user is taken to the prevalence estimation subroutine of the software, Figure 3D: The user provides the incidence history of the past 5 weeks in the travellers’ origin country (17) and an estimate of the presumed proportion of cases that are actually detected (18). The button ‘estimate prevalence’ will estimate the prevalence, as well as the infection states that the traveller is likely to be in (exemplified in the next paragraph). By checking the button ‘use’ (19), the estimated prevalence will be used as initial condition for the quarantine strategy, Figure 3B, where the user can proceed as described above.
In the isolation mode, the user can assess strategies for the duration of isolation of infected individuals. The user’s options are similar to the modi described above, with the exception that a symptomatic screening is not possible (individuals in isolation are confirmed infected or have symptoms) and that the isolated individual starts in the infectious (symptomatic) phase.
In addition to these features, a user can go straight to the prevalence estimator, field 7 in Fig. 3B or freely change the models’ default parameters (clicking on field 6 in Fig3B, will show the window depicted in Figure 3C) to customize the model. Figure 3C shows the model parameter input tab. Uncertainty ranges are calculated based on the extreme parameter values provided by the user (15). The percentage of asymptomatic cases can also be defined (16).
COVIDStrategyCalculator regards actual pandemic dynamics for policy design
The COVIDStrategyCalculator has an inbuilt prevalence estimator function that takes the recent, user provided, incidence history into account (Fig. 3D). These incidence reports are typically reported via the dash boards of the respective national- or supra-national public health institutions (e.g. the ECDC). Based on the incidence history, the ‘prevalence estimator’ computes the anticipated SARS-CoV-2 prevalence in the setting of interest. Moreover, it also computes which phase of infection individuals from the defined setting are expected to be in, which can have consequences for quarantine and testing strategies. In Fig. 4A-C, we show the model-predicted prevalence of infected- and-infectious individuals, as well as the probability of PCR-positivity at entry, depending on whether the incidence in the considered country is stable (Fig. 4A), on the rise (Fig. 4B) or declining (Fig. 4C; utilized incidence parameters are stated in the caption). Corresponding model predicted PCR sensitivities in the days post-entry are depicted in Fig. 4D, showing some differences between the considered settings over time. In summary, the tool can be used to inform differential quarantine- and testing strategies for travellers coming from high-risk areas with active or waning pandemic dynamics.

Pre-entry risk calculation for incoming travellers. A. Prevalence estimation for travellers entering from a country with a stable incidence (50 cases/100,000/week for the last 5 weeks), B. a declining incidence (200, 160, 120, 80, 40 cases/100,000/week for the last five weeks) and C. a rising incidence (20, 40, 80, 160, 320 cases/100,000/week for the last five weeks). D. Time-dependent PCR sensitivities in the respective cohorts of travellers in the days post-entry.
Calculations for quarantine duration
Using the COVIDStrategyCalculator with default parameters, we calculated the fold risk reduction during quarantine in contact person management (exposure on day 0), as well as for incoming travellers with unknown exposure time Table 1. From these numbers, the absolute risk can be easily calculated as (probability of infection)/(fold risk reduction).
Calculated fold risk reduction (typical dynamics and extreme dynamics) for quarantine. For contact person management, we assumed that exposure occurred on day 0 (today). For incoming travellers we assumed an incidence of 50 cases/100,000 inhabitants/week for the past 5 weeks, with 10% of the actual cases being detected. For symptom-screening we assumed 20% of cases to be asymptomatic.
Since some travellers could have been exposed prior to entering, a proportion may already have progressed through their infection. Therefore, greater risk reductions can be achieved for incoming travellers when compared to contact management of recently exposed individuals (columns 2 vs. 4 and 3 vs. 5 in Table 1). For example, after 14 days of quarantine, the risks reductions are 6.13 (3.30, 17.94), 12.22 (7.88, 22.13), 21.30 (8.48, 76.52) and 43.09 (21.82, 94.40) fold for contact person- and incoming travellers management with- and without symptom screening respectively. Also, a comparison of columns 2 & 3 and 4 & 5 in Table 1 highlights the respective benefits of symptom screening in contact- and travellers management, highlighting that its efficacy increases over the duration of quarantine. It should be noted that the depicted contact person management are worst-case scenarios that assume an exposure on day 0.
Calculations for combined quarantine- and testing strategies
Table 2 shows risk reductions for combined quarantine and testing strategies using default simulation parameters and assuming symptom screening. In the analyzed strategies, PCR- or antigen testing is conducted at the end of the quarantine to release individuals if they have a negative test result. For the antigen test, we assumed a relative sensitivity of 85% compared to PCR, as outlined in Supplementary Note 2. Our assessments with the CovidStrategyCalculator (default parameters) show that testing before day 5 in contact person management has limited effects on risk reduction. Furthermore, for contact person management, a PCR test at day 8 vs. an antigen test at day 10 would result in a noninferior risk reduction (> 12-fold) compared to the 14 days quarantine currently recommended by WHO and most national guidelines 36.
Calculated fold risk reduction for a combined quarantine- and testing strategy, where an individual goes into a pre-test quarantine with a diagnostic test at the end of it, which, when negative, results in the release from quarantine. We assumed that quarantine is combined with symptom-screening with 20% of cases to be asymptomatic. For contact person management, we assumed that exposure occurred on day 0 (today). For incoming travellers we assumed an incidence of 50 cases/100,000 inhabitants/week for the past 5 weeks, with 10% of the actual cases being detected.
Under the parameters used, a single PCR test at day 4 post entry reduced the risk for incoming travellers (unknown time of infection) in a similar manner compared to a 14-days quarantine for recently exposed individuals during contact person management (> 12-fold risk reduction; column 2 in Table 1 vs. column 4 in Table 2). For incoming travellers, a 14-days quarantine would result in a 43-fold (range: 22-94) risk reduction when combined with symptom screening. A noninferior fold risk reduction can be achieved for incoming travellers when testing is performed 8 (PCR test), respectively 10 days (antigen test) after a post-entry quarantine. Notably, these simulations assume that incoming travellers are exposed to the same infection dynamics as individuals in the country of their origin and that there is no elevated risk for the actual travel. For travellers that become infected during their travels, the contact management calculations hold.
Importantly, besides allowing to shorten quarantine durations, a benefit of testing is that it allows to detect asymptomatic cases. Moreover, it reduces the uncertainty in the risk reduction assessment: For example, a quarantine of 14 days in contact person management reduces the risks within the bounds 8-22 fold (mean: ∼12fold; last row in column 3 of Table 1). The equivalent combined quarantine- and testing strategy of 8 days (PCR), respectively 10 days (antigen test) tightens the confidence bounds to 13-16 fold (12-20 for antigen test), effectively reducing the uncertainty by a factor 4.6 (factor ∼1.7 for antigen; columns 2-3 in Table 2).
Calculations for de-isolation
Calculated fold risk reductions for different isolation durations are shown in Table 3. The fraction of infectious individuals decreases substantially (compare also Fig. 2B). It can be seen that 10 days of isolation post symptom onset already reduces the risk about >40 fold using typical parameters. However, it should also be mentioned that the uncertainty is large (range: 5, >1012). For de-isolation diagnostic testing is less straight forward to quarantine and requires a differentiated approach: The probability to have a positive PCR and the positive predictive value (PPV) of the PCR with regard to detecting infectious individuals is shown in columns 3-4 of Table 3: The PPV is high initially (>0.9 after 5 days of isolation) and drops rapidly from there. Therefore, a positive PCR-result alone is not an appropriate criterion for retaining a person in isolation who has already completed an isolation period by symptom-/ or duration-based clinical criteria. Also the prediction range, due to inter-individual differences in viral kinetics is immense. The negative predictive value (NPV) of the PCR with regard to assessing non-infectiousness is initially very low (< 0.3 before day 6) and increases to >0.9 after 10 days of quarantine (see column 4 in Table 3). This implies that testing isolated individuals negative is informative only after a considerable duration of isolation. Hence, testing individuals at these timepoints may ascertain their non-infectiousness, but it may not be a reasonable tool to shorten the isolation period in general, since the test only becomes informative after ∼10 days of isolation. In summary, this analysis indicates that combining PCR-testing and isolation has limited benefit when compared with isolation alone. Exceptions may arise when individuals shed virus for much longer than typical.
Calculated fold risk reduction for isolation and time-dependent informative value of the PCR. We report the probability of a positive PCR Pt(PCR+), as well as its positive- and negative predictive value (PPV, NPV) with regards to detecting infectious individuals at the end of the isolation period.
Discussion
The COVID-19 epidemic is ongoing and many northern hemisphere countries are already experiencing a severe second wave of cases while winter is approaching. Although vaccine candidates are now being evaluated in clinical trials with preliminary data indicating high promise, it is not yet clear when licensed vaccines will be widely available and what their longterm clinical efficacy will be. Thus, nonpharmaceutical control strategies, including testing, isolation and quarantine will remain an integral part of SARS-CoV-2 control for considerable time.
To help optimize these strategies, we have developed an open-source software that allows decision makers to evaluate and deduce non-pharmaceutical SARS-CoV2 mitigation strategies based on quarantine, testing and isolation. The software was designed to provide maximum flexibility to the user combined with intuitive operability. The underlying mathematical models and -methods are entirely novel and were calibrated to reproduce the spectrum of clinically observed infection dynamics from in-house and published studies 53-59.The software thus synthesizes the current state of knowledge on within-host infection dynamics and utilizes it to enable the rational, evidence-based design of non-pharmaceutical control strategies.
Given that the underlying models reproduce the statistical attributes of population dynamics, we see the COVIDStrategyCalculator ‘s prime field of application in providing rational, evidence-based guidance to policy makers determining test, quarantine and isolation strategies at national and subnational levels. Individual infection dynamics may differ from the ensemble dynamics, depending, for example, on age, known or unknown pre-existing conditions, disease severity and other factors that may affect the duration of viral shedding 60-62. Thus, while the tool is suitable to determine a strategy that has maximum benefit for most cases in a population, this approach may not be optimal for each individual case. In other words, the tool may not be well suited to select an individual or case-specific NPI regimen, especially in a context e.g. of preexisting conditions or critical disease. The models’ default parameters capture typical mean incubation periods [5.6-8.0 days] that correspond to mean/median incubation times reported in the literature [Backer et al., 6.4 days; Linton et al., days; Lauer et al. 5.1 days; Li et al., 5.2 days 52,63-65]. However, outliers have been reported, for example in immunodeficient individuals or the elderly 66,67. Likewise, the mean duration of infectiousness post symptom onset with the models’ default parameters lies within the range of 2.8 to 11.5 days, which is well supported by current knowledge (compare Fig.2) [Singanayagam et al., median 4 days; van Kampen et al., median 8 days; Arons et al., 6-9 days; Wölfel et al., <8 days; COVID-19 Investigation Team, < 9 days] 55,56,68-70. We have assumed, for our model, that infectiousness decreases sharply due to both viral decay and virus neutralization. Of note, patients with severe or critical illness may shed infectious virus considerably longer71 [van Kampen et al., up to 20 days; Jeong et al., up to 15 days; Xiao et al., 18 days 56,60,72] as may immunocompromised individuals [Koff et al., 20 days; Choi et al., 143 days 62,66]. Therefore, in the setting of severe disease or immunocompromise, de-isolation may be approached differently, for example, conditioned on a negative PCR test.
Our model captures the time-dependent sensitivity of diagnostic assays. For PCR, we modelled the “clinical sensitivity”, which takes into account (i) analytical sensitivity (which depends on technical performance parameters and is extremely high); and (ii), common preanalytical issues (e.g. inadequate specimen collection) which may lead to insufficient quantities of virus genetic material and ultimately false-negative results 73. While the quantities of genetic material obtained through swabbing may correlate with individual viral loads, they are confounded by ‘random effects’ associated with the specimen collection process (type of swab used and accessibility of sampling site). Our modelling demonstrates that these ‘random effects’ or ‘noise’ are considerable (Fig. S7 in Supplementary Note 3) and may limit our ability to detect differences between e.g. age- or risk groups.
For antigen-based rapid diagnostic tests, we assumed that sensitivity kinetics resemble those of PCR, albeit with lower analytical sensitivity 41,74,75. This approach was chosen because clinical data on the kinetics of RDT sensitivity is currently limited 76. However, the software will be refined with regards to test sensitivity dynamics as soon as robust data is available.
The presented software allows us to compute the infection prevalence based on the recent COVID-19 incidence history in the setting of interest (compare Fig. 4) and to then incorporate this knowledge into the rational design of testing strategies. For prevalence estimation, the model is simulated using the user-provided incidence values for the preceding 5 weeks at initial values. Moreover, the user can define the percent of SARS-CoV-2 cases that have actually been diagnosed. The ‘percent diagnosed’ has been the focus of intense research with highly conflicting predictions 77-82. To date, there is no reliable estimate of this parameter, which is likely influenced by changes in testing strategies and variations in testing capacities over time. In a related, entirely genomics-driven approach, we are quantifying the temporal change of this parameter; the resulting data will be used in conjunction with the software presented here.
Besides the already presented calculation examples in Tables 1-3, the following general statements can be made for NPI strategies:
Testing, when conducted at time-points with high diagnostic sensitivity, can substantially reduce the duration of quarantine while offering equivalent risk reduction. This is because testing facilitates the identification of infected individuals, regardless of whether they develop symptoms or not. Not all of such asymptomatic or pre-symptomatic individuals may be removed from the infectious pool by quarantine alone. Of note, to ensure equivalent risk reduction, the use of less sensitive tests entails a smaller reduction in quarantine duration. This may have important implications with respect to antigen-based rapid diagnostic tests. We observed that testing can reduce the uncertainty in the residual risk; this is an additional benefit of a combined testing and quarantine strategy.
Diagnostic testing for reducing the duration of isolation requires a differentiated approach: A negative test can be informative regarding the non-infectiousness of an individual (high negative predictive value) only after a minimum isolation time has passed (approx. 10 days). To the contrary, a positive test does not necessarily imply infectiousness. However, testing viral replication as a surrogate of infectiousness, as suggested by Huang et al. 83, or integrating information about the viral loads might facilitate a combined testing and de-isolation approach in the future. Also, rapid diagnostic tests (RDT) could be more suitable than PCR for de-isolating individuals.
Releasing pre-symptomatic, infected individuals from quarantine bears a much larger residual risk of onwards transmission, because these individuals can potentially infect others over a longer time period compared with de-isolated individuals, whose infectiousness is already decreasing. On the other hand, only a fraction of individuals in quarantine is actually infected, whereas the majority of isolated individuals is infectious. These considerations are readily implemented in the tool where the pre-procedure risk can be either set manually or computed using the prevalence estimator.
While we are not the first group to calculate testing-, quarantine- and isolation strategies35,47,48, we offer a tool that enables decision makers and users alike to tailor these calculations specifically to their needs and questions. Thus, we enable users to get immediate answers to the questions of their choosing to design non-pharmaceutical prevention strategies to fight SARS-CoV-2.
The software is freely available through https://github.com/CovidStrategyCalculator/CovidStrategyCalculator
Data Availability
All data for reproducing the results is available as outlined in the manuscript.
https://github.com/CovidStrategyCalculator/CovidStrategyCalculator
Working group on SARS-CoV Diagnostics at RKI
Sandra Beermann, Sindy Böttcher, Brigitte Dorner, Ralf Dürrwald, Max von Kleist, Janine Kleymann-Hilmes, Stefan Kröger, Martin Mielke, Andreas Nitsche, Djin-Ye Oh, Janna Seifried, Sebastian Voigt, Thorsten Wolff
Funding
WvDT and MvK acknowledge funding from the Germany ministry for science and education (BMBF; grant numbers 01KI2016 and 031L0176A). D-YO acknowledges funding through the German ministry of health (BMG) as part of the COVID emergency crisis funds provided to RKI. The funders had no role in designing the research or the decision to publish.
Conflicts of interest
The authors declare that no conflicts of interest exist.
Footnotes
typos in Table 3 (PPV, NPV)
References


