
Abstract
As economic woes of the COVID-19 pandemic deepen, strategies are being formulated to avoid the need for prolonged stay-at-home orders, while implementing risk-based quarantine, testing, contact tracing and surveillance protocols. Given limited resources and the significant economic, public health and operational challenges of the current 14-day quarantine recommendation, it is vital to understand if more efficient but equally effective quarantine and testing strategies can be deployed. To this end, we developed a mathematical model to quantify the probability of post-quarantine transmission that varied across a range of possible quarantine durations, timings of molecular testing, and estimated incubation periods. We found that a 13-day quarantine with testing on entry, a nine-day quarantine with testing on exit, and an eight-day quarantine with testing on both entry and exit each provide equivalent or lower probability of post-quarantine transmission compared to a 14-day quarantine with no testing. We found that testing on exit from quarantine is more effective in reducing probability of post-quarantine transmission than testing upon entry. When conducting a single test, testing on exit was most effective for quarantines of six days or shorter, while testing on day six or seven is optimal for longer quarantines. Optimal timing of testing during quarantine will reduce the probability of post-quarantine transmission, as false-positive results become less likely, enabling case isolation. Based on 4,040 SARS CoV-2 RT-PCR tests, an exit test 96 hours after the start of quarantine for an offshore oil rig population was demonstrated to identify all known asymptomatic cases that previously tested negative at entry, and—moreover—successfully prevented an expected seven or more offshore transmission events, each a serious concern for initiating rapid spread and a disabling outbreak in the close quarters of an offshore rig. This successful outcome highlights the importance of context-specific guidelines for the duration of quarantine and timing of testing that can minimize economic impacts, disruptions to operational integrity, and COVID-related public health risks.
Introduction
The COVID-19 pandemic has engendered unprecedented efforts to quell ongoing outbreaks and manage healthcare capacity, including strict travel restrictions and stay-at-home orders. However, these efforts have disrupted workplaces, leading to significant and pervasive socioeconomic costs 1,2. Economic pressures have led many governments and corporations to proceed with plans to reopen their economy and workforce 3. Safely reopening in the absence of a vaccine relies on reducing the likelihood of an infectious individual entering a workplace or school 4. Current strategies include the use of a 14-day quarantine and often with some combination of entry and/or exit testing, coupled with contact tracing should a case arise. These strategies aim to reduce the effective reproduction number R—the average number of secondary infections caused by a primary case—below one.
Quarantining individuals imposes myriad challenges for government workers, military, businesses, universities, and other entities. In many settings, the recommended 14-day quarantine poses a significant strain on the mental and physical health of employees and their families 5,6, coupled with the associated economic toll and potential impacts on operational integrity. For example, during the time of the epidemic with quarantine measures in place, offshore oil and gas employees may be needed to work extended cycles significantly beyond their traditional 14-day on-and-off cycle. This built-in quarantine time into the overall work schedule results in prolonged time periods that crew members are away from their home. Given the impact of long quarantines on mental and physical health 5,6, a priority of our research was to identify a minimal, effective quarantine strategy for close-quarter environments where there is potentially a high risk for the rapid spread of COVID-19 with associated severe outcomes and even mortality.
Previous work has focused on impact of quarantine and testing on population-level COVID-19 incidence and deaths 7–9, and testing measures that are most appropriate for disease surveillance within a population by examining various testing frequencies 10. Currently, there is no consensus regarding the optimal duration of quarantine or timing of testing that minimizes the risk of outbreaks in workplaces, university campuses, military facilities 11. Many institutions are relying on testing at entry into quarantine, and other measures such as symptom screenings, hand sanitizers, and face masks to reduce the risk of an outbreak. Given that over 50% of COVID-19 transmission is attributed to pre-symptomatic and asymptomatic cases 12, screening for symptoms alone is inadequate to prevent or interrupt a COVID-19 outbreak 12. In addition, testing early post-infection could produce a false-negative result 13. Thus, symptom-based screening and one-time testing could still entail a significant probability of post-quarantine transmission (PQT). Consequently, some jurisdictions have suggested and implemented testing upon exit from a 14-day quarantine 14. Understanding the complementarity of quarantine and testing in reducing PQT would provide vital insight into effective strategies to ensure the safety of civilian and military workers, students returning to classrooms, and international travelers, thereby mitigating disease spread in the wider community.
Here, we evaluate whether an alternative epidemiologically sound, quarantine and testing strategy exists that would be equivalent to the standard 14-day quarantine protocol in reducing PQT. To do so, we developed a mathematical model to calculate the benefits of diverse quarantine and molecular testing strategies in reducing the probability of PQT, accounting for the infectivity profile of an infected individual and the temporal diagnostic sensitivity of RT-PCR testing. We estimated the probability of PQT for an infected individual that has not manifested symptoms but has completed quarantine with undetected infection. In our analysis, we considered different combinations of timing and frequency of testing with quarantine of up to 14 days, with and without contact tracing. In addition, we performed a sensitivity analysis on our results based on the impact of differences in the estimated mean incubation period. We compared the probability of PQT under three scenarios of testing: (i) on entry to quarantine only, (ii) on exit from quarantine only, and (iii) on both entry to and exit from quarantine for an infected individual. Lastly, we analyze the results of the application of guidance from our model regarding the operational processes of quarantine and testing within the oil and gas industry that prevented offshore transmission (Supplementary Information: Narrative).
Results
Using the infectivity profile derived from transmission pairs of COVID-19 infected individuals 15, temporal diagnostic sensitivity of RT-PCR tests 16, and an incubation period of 8.29 days (95% credible interval of 7.69–8.92) 17, we calculated the probability of PQT for a basic reproduction number of R0 = 2.5, assuming that secondary infections are distributed through a negative binomial distribution with a dispersion parameter of 0.25 18 (Table S1). From the infectivity profile, assuming that 30.8% of infections are asymptomatic across the disease time course [12], we estimated that the reproduction number reduces to 1.53 under perfect isolation of cases upon symptom onset, with 1.09 secondary cases occurring during the incubation period (Fig. S1A). The expected number of secondary infections still remains above one with a lower asymptomatic proportion of 22.6% or with a reduced R0 of 2 (Fig. S1B–D). Therefore, perfect isolation of all symptomatic individuals would not be sufficient to interrupt the chain of disease transmission.
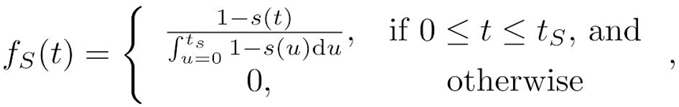
Impact of quarantine without testing
To evaluate the effectiveness of quarantine alone, we computed the expected PQT (Fig. S2A) and the probability of PQT after a range of quarantine durations (Fig. 1, Fig. S3). Assuming individuals self-isolate immediately upon symptom onset, we calculated that the probability of PQT declines as the duration of quarantine increases (Fig. 1). This probability is less than 0.25 with a quarantine duration of at least three days, and falls below 0.05 for quarantines of eight days or longer.

The probability of post-quarantine transmission for no testing and three testing strategies and durations of quarantine from 1–14 days, with 30.8% asymptomatic infections and perfect self-isolation of symptomatic infections. The average incubation period (specified by a discretized Gamma distribution) of (A) 8.29 days (95% credible interval: 7.69–8.92), and (B) 5.2 days (95% credible interval: 3.8–6.7). Curves for the probability of post-quarantine transmission show the average probability of one or more post-quarantine infections when an infected individual enters quarantine uniformly within the incubation or asymptomatic period without testing (red), and with testing upon entry to quarantine (orange), on exit from quarantine (blue), and on both entry to and exit from quarantine (purple). With a delay in sample collection to results, we assumed that testing on exit occurred the day before the end of quarantine.
Testing during quarantine
The effectiveness of quarantine in reducing the probability of PQT can be augmented through testing. We assumed a 24-hour delay between the sample collection and test results, indicating testing on exit occurs a day before the end of quarantine. Under each scenario of testing, individuals who are tested positive or developed symptoms are isolated. We found that the probability of PQT is reduced by at least 40.5% across a full range of quarantine durations when any of the three testing strategies are conducted compared to no testing (Fig. 1A and Fig. S3). For a single test during quarantine, testing leads to the largest reduction in the probability of PQT when it is conducted on the last day of quarantine for durations less than seven days; on day six for quarantines between seven and 13 days; and on day seven for quarantines 14 days or longer (Fig. S4A).
Comparing the three testing strategies, we found that testing on both entry and exit from quarantine provides the greatest return in decreasing the probability of PQT, whereas the benefit of testing in reducing this probability is lowest when conducted only at entry into quarantine (Fig. 1, Fig. S3). Testing on exit consistently outperformed testing on entry across all quarantine durations considered (Fig. 1). For example, a quarantine duration as short as three days with a test on both entry and exit yields an 86.1% reduction in probability of PQT relative to no testing, compared to a 45.5% decrease when the individual is tested on entry only and a 72.9% decline for testing on exit only (Fig. S3).
We compared strategies of quarantine and testing with the widely implemented, World Health Organization-recommended 14-day quarantine without testing 19. We found that a 13-day quarantine with testing on entry, a nine-day quarantine with testing on exit, and an eight-day quarantine with testing on both entry and exit each provide equivalent or lower probability of PQT compared to a 14-day quarantine with no testing (Fig. 1A, Fig. S2–S3).
Assessment of quarantine and testing strategies implemented for offshore facilities
We performed an assessment of the practical implications of our analyses based on quarantine and testing protocols in the setting of offshore oil-and-gas platforms (Supplementary Information: Narrative). We stratified the tests into regions A and B based on the location of the lab where the test results were obtained. Among the 4040 RT PCR tests conducted prior to travel offshore, there were 69 positive results (1.7%). Initially, a three-day quarantine with testing only upon entry was implemented. Of the 1792 RT-PCR tests conducted with this strategy, there were 22 positive results (1.2%). Region A deployed a seven-day home quarantine, where testing was performed on both entry and exit (96 h after the first test) starting from August 13, with 50.0% (1/2) of the positive tests occurring on exit (Fig. 2B). Region B expanded to a five-day hotel quarantine with testing on both entry and 96 h after the first test, starting on June 25, 2020. For the period in which the entry and exit testing strategy was implemented in region B, 33.3% (15/45) of the positive tests were obtained upon the exit test, following a negative entry test (Fig. 2B). Further validation of the entry and exit testing protocol was provided through an additional 155 RT-PCR tests performed post-quarantine (11 days after the initial test), all of which were negative.

Weekly SARS-CoV-2 testing between April 11 to August 26, 2020 among two regions where crew members were quarantined. The positivity rate of test conducted between April 11 and August 26 for (A) region A (with a seven-day quarantine) where testing on entry and exit was started on August 13 and (B) region B (with a five-day quarantine) where testing on entry and exit was started on June 25. Initially, a three-day quarantine with testing only on entry was conducted in both regions. The vertical dashed line separates the strategy of testing on only entry (left), the strategy of testing on both entry and exit (right), with follow-up post-quarantine tests conducted 11 days after the initial test (i.e., on day 12). Negative and positive sequential symbols − and + indicate the test histories. In these results, negative symbols are always conveying results to tests that were previous to the results quantified by the bar above. The number of positive tests and the number of tests conducted is denoted above the bar in parentheses.
No offshore worker registering negative tests-on-entry-and-exit from quarantine was later diagnosed with COVID-19 during their offshore work. We quantified the probability of PQT for the cases detected by an exit test, as well as the extent to which adding testing on exit to testing on entry reduced this probability, assuming an average incubation period of 8.29 days. Individuals who eventually developed symptoms entered quarantine uniformly during their incubation period (prior to symptom onset), whereas asymptomatic individuals entered quarantine over the course of their infection. Compared with a three-day quarantine and testing only on entry, extending the quarantine duration and adding testing on exit (96 h after the first test) reduced the probability of PQT by 95.3% for the seven-day quarantine and 88.5% for a five-day quarantine. If the single case identified on the exit test from region A remained undetected within the seven-day quarantine, we estimate an off-shore probability of PQT of 0.127. If the 15 cases that had been ascertained on exit from region B had remained undetected after the five-day quarantine without testing on exit, we estimate that the probability of PQT would have been 0.982, and would have resulted in an expected 7.2 offshore transmission events—each one a serious concern for initiating rapid spread and a disabling outbreak in the close quarters of an offshore rig.. We found that the estimated probability of PQT using the strategy of testing upon entry and exit moderately increased with the proportion of infections being asymptomatic (Fig. S5).
Accounting for prevalence of disease in the community
We evaluated the impact of disease prevalence in the community on the probability of PQT (Fig. S6). For a cohort of size 40 and a five-day quarantine with prevalence of 1%, we estimated the probability of PQT to be 0.039 for testing only on entry, and 0.006 for testing on both entry and exit (Fig. S6B). For a seven-day quarantine and the same prevalence, the probability of PQT drops from 0.017 for testing only on entry to 0.002 when augmented with testing on exit (Fig. S6C).
Contrasting contact tracing and uniform entry into quarantine
We evaluated the effectiveness of quarantine through contact tracing in reducing the probability of PQT with no delay (Fig. 3, Fig. S7–S8) and with one-day delay in the identification of exposed contacts (Fig. S9–S10). Consistent with practices at remote mining sites, tracing of contacts was assumed to be initiated by the presentation of a worker to the onsite health unit with relevant COVID-19 symptoms. For offshore oil platforms, contact tracing is initiated if there is identification of a positive case either by symptom presentation or by surveillance screening through testing. Rapid contact tracing leads to contacts being quarantined early in the disease time course (if infected), influencing the decline in the probability of PQT as the duration of quarantine increases compared to uniform entry into quarantine over the duration of the incubation period or disease course (Fig. 3 vs Fig. 1). Under contact tracing with no testing, the probability of PQT decreases gradually from 0.32 for a quarantine lasting one day to 0.30 for a quarantine of three days, then reduces more rapidly to 0.12 for an eight-day quarantine, and again decreases gradually for longer durations of quarantine (Fig. 3). In contrast, entry into quarantine uniformly over the course of the incubation period or disease period leads to a continuous decline in the probability of PQT from 0.29 for a one-day quarantine to 0.05 for an eight-day quarantine, with the rate of decrease slowing for quarantine durations longer than eight days (Fig. 1). We found that the optimal timing of a single test within quarantine of traced contacts was to test upon exit for durations as long as seven days, with testing on day seven for quarantines extending beyond seven days (Fig. S4B).

The probability of post-quarantine transmission for no testing and three testing strategies and durations of quarantine of 1–14 days, with 30.8% asymptomatic infections and perfect self-isolation of symptomatic infections. The average incubation period (specified by a discretized Gamma distribution) of (A) 8.29 days (95% credible interval: 7.69–8.92), and (B) 5.2 days (95% credible interval: 3.8–6.7). Curves for the probability of post-quarantine transmission show the average probability of one or more post-quarantine infections when an infected individual enters quarantine through contact tracing within the incubation period without testing (red), and with testing upon entry to quarantine (orange), on exit from quarantine (blue), and on both entry to and exit from quarantine (purple). With a delay in sample collection to results, we assumed that testing on exit occurred the day before the end of quarantine
We observed that the relative decline in the probability of PQT is similar whether entering quarantine uniformly during infection or through contact tracing. (Fig. 1 vs Fig. 3). However, when testing on entry, the decrease in the probability of PQT occurring as a consequence of increasing the duration of quarantine is smaller with contact tracing than with uniform entry into quarantine. For example, the reductions in the probability of PQT from a one-day quarantine to a three-day quarantine with testing on entry are 4.1% and 12% for entry into quarantine based on contact tracing and uniformly, respectively.
We found that testing under any of the three strategies (i.e., on entry only, on exit only, or on both entry and exit) reduces the probability of PQT by at least 30.3% when quarantine is initiated through contact tracing (Fig. S8). Furthermore, a 14-day quarantine with no testing is equivalent to a 13-day quarantine with testing on entry, a nine-day quarantine with testing on exit, and an eight-day quarantine with testing on entry and exit (Fig. 3A, Fig. S7–S8).
Effect of the incubation period
We performed a comparative analysis when the average incubation period decreased from 8.29 days 17 to 5.2 days 20. We found that the difference in the mean incubation period had only a minimal effect on the expected transmission occurring before symptom onset (1.09 for 8.29 days vs 1.06 for 5.2 days). The peak of infectivity was slightly higher and earlier with the shorter incubation period (Fig. S11). Entering into quarantine whether uniformly (Fig. 1B, Fig. S12, Fig. S13) or through contact tracing (Fig. 3B, Fig. S14, Fig. S15), the probability of PQT was lower for the shorter incubation period. Assuming the shorter incubation period of 5.2 days, testing on exit is best for quarantines lasting at least four-days (Fig. S4C, Fig. S4D). For longer quarantines, testing on day three was optimal for uniform entry, and on day four when entering quarantine through contact tracing (Fig. S4C, Fig. S4D).
Discussion
Here, we developed a modelling framework to calculate the probability of post-quarantine transmission of COVID-19 for a wide range of durations of quarantine, supplemented by testing on entry to quarantine, on exit from quarantine, or both. Evidence suggests that isolation of cases upon symptom onset is insufficient to contain an outbreak of COVID-19 12. However, the likelihood of transmission can be reduced substantially through quarantine and testing 4. We found that testing on both entry to and exit from quarantine was the most effective strategy in reducing the probability of PQT. Furthermore, the optimal timing of a single test was upon exit for quarantines with durations as short as six days. For a quarantine duration longer than six days, the optimal testing time was between six and seven days.
The current public health guidelines for a 14-day quarantine of individuals with known exposure to COVID-19 relies on estimates of 5.2 days for the mean incubation period 20, indicating that 99% of infected individuals develop symptoms within 14 days of infection. More recent estimates suggest an extended duration of 20 days from infection to symptom onset, with mean incubation period of 8.29 days 17. Monitoring individuals for symptom onset during quarantine is a suboptimal strategy, as a sizable proportion of individuals experience asymptomatic infection 21,22. Furthermore, economic costs and negative effects of a prolonged quarantine on mental health and other social aspects of life could be substantial. Reducing these consequences by shortening the duration of quarantine may, on the other hand, increase the risk of post-quarantine transmission from undetected cases; thus, highlighting the importance of augmenting quarantine with testing.
An outbreak can be triggered or sustained within an environment that is monitored only for symptoms of COVID-19. Quarantining individuals before returning to work or school has been a common strategy among many businesses, the military and universities to prevent potential outbreaks. An offshore or military setting is one of numerous close-quarters environments in modern society where an outbreak can seriously impact operational integrity, leading to compromised safety and adverse economic consequences. Hence, minimizing outbreak risk while maintaining staffing is critical. Testing may allow for the quarantine duration to be reduced without increasing the risk of PQT. For example, many universities have implemented plans for quarantining and frequent testing of students and employees, where resources allow23,24. For businesses and close-quarters environments, the impact of false negatives are a substantially greater issue for operational integrity than false positives. Our results show that testing upon entry to quarantine carries such a risk of false negatives, as infected individuals who enter quarantine very early in the incubation period of disease may not be detected due to low viral loads.
There are benefits to conducting additional tests as prevalence in the general community increases (Fig. S6, blue and purple), because as substantial numbers of infected individuals enter quarantine, larger numbers of individuals may proceed through testing with rare false-negative test results, increasing PQT. Additional tests decrease the likelihood of the occurrence of a series of false-negatives. However, there is a declining return of additional testing from lower detection rates during the early stages of disease post-infection (Fig. S27). Therefore, the benefit of additional tests is moderate.
Optimal timing of limited testing during quarantine improves the ability to control PQT. Testing several days into quarantine increases the likelihood of an infected case testing positive (Fig. S4). The increasing diagnostic sensitivity of the RT-PCR test is attributable to the rapidly increasing viral load following the less detectable latent stage of infection. If the infected individual remains asymptomatic, testing near the end of a standard 14-day quarantine can also lead to low diagnostic sensitivity due to a declining viral load as they overcome the infection 25. Specifying an average incubation period of 8.29 days, our analysis indicates that the lowest probability of PQT is achieved by testing on day seven of the standard 14-day quarantine (Fig. S4A, Fig S4B).
Testing was found to result in a smaller reduction of the expected PQT when entering quarantine through contact tracing compared to not. Contact tracing will be more effective in identifying infected individuals than when selecting individuals at random for quarantine, due to the differences in exposure risk, increasing the importance of reducing PQT via testing. For example, if prevalence is 1% and 10 individuals are selected at random for quarantine, then on average 0.1 people would be infected. Alternatively, if an index case is isolated upon symptom onset, there would be on average 1.09 individuals infected (for an R0 = 2.5) prior to symptom onset and potentially identified through contact tracing. However, individuals entering quarantine because they are identified by contact tracing are likely to do so earlier post-infection (Fig. S28). Therefore, an earlier entry requires a longer quarantine (generally), and makes it more likely that testing occurs during the incubation period, when diagnostic sensitivity of the RT-PCR test is highly limited.
Our results are based on the temporal diagnostic sensitivity of RT-PCR tests, which are currently considered the gold standard test. However, this testing approach is moderately invasive, may be inconsistent during serial testing, and is dependent on the availability of some raw materials that have been scarce 26–29. The use of saliva tests as an alternative could allow for frequent testing of individuals at a decreased cost, while being less invasive and self-administered 30,31. There is also evidence that saliva tests are more sensitive than RT-PCR tests from nasal swabs in COVID-19 patients 26but less sensitive for detection in a community setting 32. Thus, the recent innovations to improve access to testing, such as widespread use of saliva tests, could shift optimal decision-making for prevention of COVID-19 transmission via quarantine and testing.
Our study is informative for businesses, military operations and universities, providing quantitative estimation of the residual risk of PQT. The calculated infection risks were used to inform the quarantine and RT-PCR testing strategy deployed by an oil and gas company prior to workers travelling offshore. Of the positive tests obtained under this strategy, 34% were on the exit test, which prevented 16 infected crew members that otherwise would have exited quarantine and entered confined quarters offshore while infectious. The results of the time of testing for a given quarantine duration could be also useful for population-level disease control when quarantine is required for international or even interstate travel.
Our examination of the effects of durations of quarantine and timings of testing is critical to future efforts to balance the risk of PQT with the undue costs associated with prolonged quarantines. As efforts continue for returning to a level of normality, any control strategy will need to account for public safety, commercial and military operational integrity, school reopening and family emotional well-being. Our study indicates that the approach of testing upon entry into quarantine—currently implemented by most administrative bodies—is the least effective strategy. Testing can provide substantially higher dividends in reducing PQT if performed later during quarantine—at exit, or in longer quarantines, at an optimal timing. Defining and comprehending the risk of PQT within each context is essential to effective and transparent balancing of lives and livelihoods in times of a global pandemic.
Conclusion
Our analysis shows a reduced probability of post-quarantine transmission when testing on exit compared to testing on entry. By augmenting quarantine with molecular testing, the quarantine duration can be substantially shortened from the recommended 14-day period, while attaining a similar level of risk. The results from this analysis are supported by data of quarantined crew members of an offshore oil facility.
Methods
Data of SARS CoV-2 tests during quarantine
Between April 11, 2020 and August 26, 2020, there were 4,040 SARS CoV-2 RT-PCR tests conducted among employees of an oil and gas company coming from two regions (stratified by lab location). A third region that was monitored is not included in our data set, as there was low population prevalence entering quarantine and there were no positive tests. During the early stages of the epidemic, both regions used a three-day quarantine with testing on entry. On August 13, employees from region A quarantined at home for seven days, with testing occurring on both entry and exit. While employees were at home, they were asked to practice social distancing in public. Starting on June 25, employees from region B were quarantined in a hotel for five days prior to their departure off-shore and tested on both entry and exit. The requirements of an employee to go off-shore were (1) passing the components of a screening form used to filter out symptomatic cases and those potentially exposed, (2) temperature screenings, and (3) completion of the quarantine with no positive RT-PCR test. Upon a positive test, the employee initiated a 14-day isolation period and followed through the company’s case management process. After the isolation period, individuals were able to return back to work contingent upon two negative RT-PCR tests.
Epidemiological parameters
The distribution for the average incubation period was assumed to be Gamma distributed, with an average 8.29 days, and fit to the 95% credible interval of 7.67–8.90 17. As a sensitivity analysis to the results, we considered a Gamma distribution with an average of 5.2 days, with the 95% credible interval fit to 4.1–7.0 days 20. We integrated over these distributions to compute the expected PQT (average number of secondary infections post-quarantine) and the probability of PQT associated with each strategy.
For our baseline analysis, we considered a delay of one day between sample collection and result of RT-PCT test. Thus, the sample is taken one day before the end of quarantine when testing on exit. We also conducted the analysis when there was no delay in testing results to examine the impact on the probability of PQT (Fig. S16–S19).
In the baseline analysis, we assumed R0 = 2.5 and 30.8% of infections are asymptomatic 12,21. We further analyzed the scenario in which 22.6% of infections are asymptomatic (Fig S20–S23) 22. Asymptomatic infections were assumed to be equally as infectious as symptomatic infections. This assumption is based on measurements of viral loads in asymptomatic infections being comparable to those observed in symptomatic cases 33,34.
Infectivity profile
We used a Gamma distribution informed by infectivity profiles previously inferred from 77 COVID-19 transmission pairs 15. For a given incubation period, the parameters of the Gamma distribution were determined through least squares optimization by fitting the infectivity profile after symptom onset inferred from the Gamma distribution to the previously estimated infectivity profiles after symptom onset when infectivity started from five, eight, 11, and 12.3 days prior to symptom onset. We assumed that the infectivity profile starts upon infection of the individual, i.e., 12.3 days prior to symptom onset.
Temporal diagnostic sensitivity of a SARS CoV-2 RT-PCR assay
To account for the variability in viral load dynamics over time, we analyzed the population-average diagnostic sensitivity at each time point over the course of disease. We incorporated into our analysis the temporal diagnostic sensitivity results for the RT-PCR tests of infected individuals over the first month following symptom onset 16. To infer the diagnostic sensitivity prior to symptom onset—which was not assessed in Xiao et al 16, we constructed a mapping between post-symptom infectivity to the diagnostic sensitivity based on the post-symptomatic data. This mapping was fit to a sigmoidal Hill function, which fit well the saturating decline in diagnostic sensitivity observed after the incubation period. The parameters for the Hill function were informed by a least-squares fit to diagnostic sensitivity data for the RT-PCR tests of infected individuals over the first month following symptom onset 16. For the fitting of the Hill function, we used the infectivity profile (as a proxy for the viral load) for an incubation period of 7.76 days (median estimate) 17. For the fitted case, we checked to ensure that the Hill function yielded a very similar curve to a more highly parameterized polynomial interpolation function applied to the temporal diagnostic sensitivity of patients who tested positive after receiving multiple RT-PCR tests 35. To specify a single functional form for RT-PCR diagnostic sensitivity, we then used this mapping from infectivity profile to diagnostic sensitivity to specify diagnostic sensitivity over the entire course of infection (Fig. S26), with similar trends resulting as were revealed by previous research 10. We assumed that the specificity of the RT-PCR assay was 100% 36.
Probability of post-quarantine transmission
To calculate the probability of PQT—defined to be the probability of at least one post-quarantine infection—we assumed that the expected post-quarantine transmission is described by a negative binomial distribution with a dispersion parameter of 0.25 18. This value for the dispersion parameter is consistent with numerous published estimates 37–39. For sensitivity analyses, we also computed the probability of PQT given Poisson-distributed post-quarantine transmission (Fig. S24–S25). In our additional analysis accounting for the underlying prevalence within the community, the probability of PQT was defined as the likelihood that at least one infected individual in a cohort became a source of PQT. Similarly, to calculate the probability of PQT given a negative test on entry for N infected individuals, we estimated the probability that at least one of the cases contributed to PQT.
Data Availability
The number of positive tests and tests conducted at the two regions quarantining the crew members heading offshore are presented in Fig. 2, with other data used in the analysis referenced in Table S1 and in the Methods.
Data availability
The number of positive tests and tests conducted at the two regions quarantining the crew members heading offshore are presented in Fig. 2, with other data used in the analysis referenced in Table S1 and in the Methods.
Code availability
The computational code for the analysis was implemented in MATLAB, and it is available at github.com/WellsRC/Optimizing-COVID19-Quarantine-and-Testing-Strategies.
Supplementary Information
Narrative
The recommended 14-day quarantine poses a significant strain on the mental health of employees, in addition to bringing economic distress. During the time of the epidemic with quarantine measures in place, employees of an off-shore oil company are working a cycle of 26 days on and 16 days off. The goal of the company has been to reach a risk reduction of a 14-day quarantine through alternative strategies, while considering all factors in play. For the company, the marginal gains in efficacy from a five-day to a seven-day quarantine with testing on entry and exit did noy justify its implementation due to the logistical challenges and substantial costs involved. However, quarantine has been chosen to be extended in high-risk areas in order to decrease the risk of an outbreak offshore.
During the early stages of the epidemic, when prevalence was low, a three-day quarantine was implemented by the company in a secured facility with testing occurring on entry. The introduction of the risk reduction models of testing on entry and exit caused a dramatic shift in the decision for quarantining workers. A five-day quarantine was immediately implemented, with testing on entry and the second (exit) test 96 h after the first test. Positive tests were obtained within the first week of testing on exit.
Theory
Transmission over Time
Infectivity of a pathogen from an infected individual is typically time-dependent, based on pathogen shedding and other factors, and can be represented over time by a function r (t), for which time t = 0 represents initial infection, scaled such that
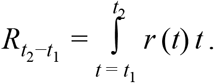
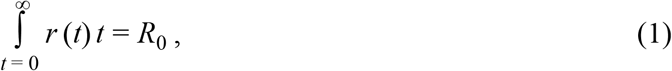 where R0 is the basic reproduction number: the expected number of infections consequent to a single infected individual under a scenario of no intervention. Infectiousness during discrete timespans t2 − t1 (e.g. days) can be calculated as
Self-isolation at Symptom Onset
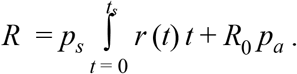
A significant means of intervention to prevent infection is self-isolation of infected individuals upon symptom onset. The expected effect on onward transmission of an intervention such as self-isolation of a case that becomes symptomatic at time ts can be calculated as
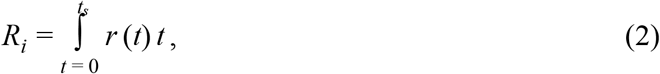 provided that all individuals self-isolate upon presentation with symptoms. If
 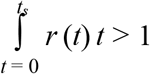 , then even perfect self-isolation upon symptom onset will be insufficient to extinguish disease transmission.
If the outcome of infections leads to a proportion of infected individuals pa that can infect others but that never manifest symptoms (i.e. that are asymptomatic carriers), then transmission may be partitioned into the contributions of symptomatic and asymptomatic cases as R0 = R0,s ps + R0,a pa, in which the probability of a symptomatic case ps = (1− pa). R0,s and R0,a can be equated to distinct infectiousness functions rs (t) and ra (t). For simplicity of presentation in ensuing theory, it will be assumed that R0,s = R0,a and rs (t) = ra (t) = r (t)1,2. Alternate overall transmission and alternate forms of infectivity over time for asymptomatic cases may easily be partitioned and tracked in the theory that follows should there be evidence to substantiate their difference.
With R0,s = R0,a = R0 and rs (t)= ra (t) = r (t), the presence of asymptomatic carriers increases the degree of transmission consequent to a self-isolation intervention from that shown by Eq. 2 to
Quarantine
Quarantine with a Known Time of Infection
A longstanding approach to limit disease spread is the quarantine of individuals who have no prior indication of potential for disease but intend to migrate from a population in which there is current transmission to a population with lower or zero disease prevalence. Because quarantined individuals experience a significant restriction of personal freedom, it is important to minimize the duration of quarantine q, but also maximize its effectiveness in limiting post-quarantine transmission. Quarantine of q days from time tq to time tq + q limits total expected post-quarantine transmission to
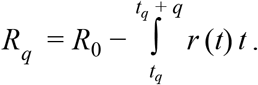 For policy decision-making regarding quarantine duration, the expected post-quarantine transmission is typically most important, and can be calculated as
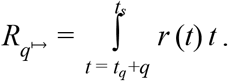
 If individuals self-isolate, there is a trivial case in which ts ≤ tq +q and
  ; otherwise, ts > tq + q and
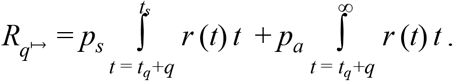
 Including asymptomatic carriers,
 Unfortunately, these expressions are unlikely to be useful in this form for quantifying the benefits of quarantine in reducing transmission. In the case of quarantine of migrants from one population to another, the time of infection—and correspondingly the time of quarantine tq —are rarely known.
Quarantine with an Unknown Time of Infection
In a rapidly spreading epidemic, individuals who might be entering quarantine will tend to be early in disease time course. In a rapidly declining epidemic, individuals who might be entering quarantine will tend to be later in disease time course. In a steady-state epidemic with case counts c (t),  over the period from t0 to ts such that individuals entering quarantine are evenly distributed across the disease time course. Provided all individuals experience symptoms at time ts that qualify them for isolation instead of quarantine, then the expected post-quarantine infectivity is
 and expected post-quarantine transmission from an infected individual is
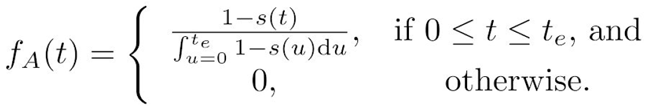
 a function of days of quarantine q. For asymptomatic carriers entering within disease time course te,
 Incorporating both symptomatic and asymptomatic infections,
 A similar approach that incorporates symptomatic and asymptomatic cases by their proportions within the population may be performed throughout the rest of the scenarios below, and will not be specifically pointed out for each scenario.
Testing
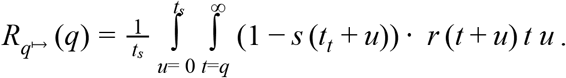
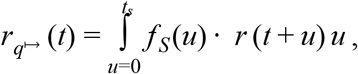
Testing with a Known Time of Infection
Diagnostic test sensitivity s (t) is also time-dependent. Assaying for components of the pathogen (e.g. DNA, RNA, or protein), diagnostic sensitivity typically is zero to low very early in disease before the pathogen load burgeons, then declines in the later stages of disease when immune responses develop and infection is suppressed (Fig. S27). In a disease for which tests can diagnose infections during the incubation phase, testing can enhance the efficacy of quarantine by identifying individuals to be isolated instead of quarantined, thereby preventing future transmission from cases that persist as infectious through an earlier exit from quarantine than would be called for in case isolation.
Testing with an Unknown Time of Infection
The temporal diagnostic sensitivity of a test for infected cases with an unknown time of infection can be calculated by integrating over the unknown time of infection, such that

Quarantine and Testing
Quarantine with an Unknown Time of Infection with Testing on Entry
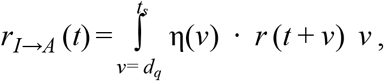
Assuming the duration of the quarantine, q, is longer than the delay between administering the test and acting to isolate upon a positive result, the expected post-quarantine infectivity over time of an individual whose time of infection is unknown and who is tested for disease on entry to quarantine is
 in terms of time from infection. In terms of q days of quarantine, the expected post-quarantine transmission is
 For asymptomatic carriers,
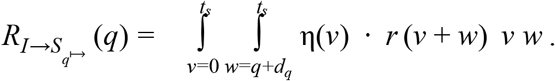
Quarantine with an Unknown Time of Infection with Testing on Entry and Exit
Expected post-quarantine transmission from an individual whose time of infection is unknown and who is tested for disease upon entry and at the last opportunity prior to the end of quarantine is
 where dt is the delay between administering the test and isolation if positive. For asymptomatic carriers,
Quarantine with Testing at Any Time(s)
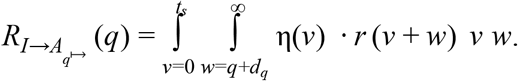
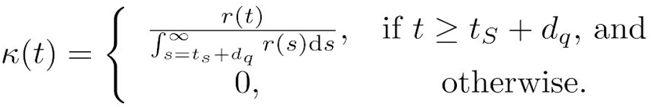
Expected post-quarantine transmission of an infected individual whose time of infection is unknown and who is tested for disease at any time 0≤ tt ≤ q − dt is
 For asymptomatic carriers,
 Additional terms (1 − s (u + tk)), where k indexes testing times, may be included as terms within the product inside the double integral to quantify the expected post-quarantine transmission of any schedule of testing to be applied during quarantine.
Quarantine with a Negative Test on Entry
The probability density for obtaining a false negative upon entry for a symptomatic individual is
 and the probability density for an asymptomatic individual is
 The expected post-quarantine infectivity over time of a symptomatic individual who tested negative for disease on entry to quarantine is
 in terms of time from infection. In terms of q days of quarantine, the expected post-quarantine transmission is
 For asymptomatic carriers, the expected post-quarantine infectivity is
 and the expected post-quarantine transmission is
Contact Tracing
Tracing of individuals who have had contact with an index case identifies persons whose quarantine would reduce the risk of disease transmission from recently exposed individuals. When an individual is identified as a contact of an index case, the expected time of infection is not the same as that of an individual selected at random from an infected population. Restricting our attention to transmissions occurring between an index case and their contacts, there are four nominal transmission relationships to be considered, of which three are considered relevant to an attentive program of contact tracing and quarantine (Table S2): the asymptomatic or pre-symptomatic contact may have infected the index case, or may have been infected by the index case. Here we excluded from calculation the case in which a pre-symptomatic individual infects the index case, because that scenario is formally impossible with a fixed ts and rigorous self-isolation and self-identification upon symptoms, and unlikely even with variable ts and imperfect adherence to self-isolation and self-identification.
A To-be-Symptomatic Contact Infected by the Index Case but not yet Symptomatic
By assumption, infection of the contact must have occurred prior to the onset of symptoms in the index case. The likelihood that an infection from the index case occurred at a time during the disease time course of the index case should proportionally follow r (t) (Eq. 1). Thus, the probability density for infection—on the timescale t of the infection of the index case that was identified at symptom onset—is
 The probability density for the time since infection of the to-be-symptomatic contact—on the timescale t of the contact—is
 Thus, the erstwhile expected infectivity from the contact that was infected by the index case from the time of intervention by a quarantine is
 where dq is the delay from identifying the index case to quarantine of the contact. The expected post-quarantine transmission by the contact after a quarantine of duration q is
An Asymptomatic Carrier Contact Infected by the Index Case
The expected infectivity of an asymptomatic contact infected by the index case—from time t = 0 at intervention by quarantine—is
 where dq is the delay from identifying the index case to quarantine of the contact. The expected post-quarantine transmission from the asymptomatic contact infected by the index case starting from the time of intervention by a quarantine of duration q is
An Asymptomatic Contact that Infected the Index Case
Because the index case was assumed to be identified due to symptom onset, an asymptomatic contact that infected the index case must have already been infected for a duration of at least ts + dq. Consequently, the probability density of infection from that contact is
 Setting
  , the expected infectivity of the asymptomatic contact that infected the symptomatic index case—from time t = 0 at intervention by quarantine—is
 and the expected post-quarantine transmission is
 Continuing our assumption that individuals are assiduously self-isolating upon symptom onset and recalling that
  (Eq. 2), we can tabulate the expected transmission by contacts of the index that are classified into three kinds (Table S3). By assumption, a contact to become symptomatic could not have infected the index case, because otherwise in an assiduously self-isolating population, that contact would have been the index case.
Combining all three transmission functions of contacts of an index case discovered due to appearance of symptoms, the expected post-quarantine infectivity
 Incorporating a quarantine of duration q for contacts, the expected post-quarantine transmission

Probability of post-quarantine transmission
The probability of post-quarantine transmission is specified to be the probability that an infected individual exits quarantine, but can still infect one or more individuals. We calculated this probability under a negative-binomial model appropriate when superspreaders play a role in transmission, as well as a Poisson distribution appropriate when transmission is fairly evenly distributed among infected individuals.
Negative-binomial distribution
We specified a negative binomial distribution
 with dispersion parameter k = 0.25 3 and
  , such that the average of the distribution was
  . Thus, the corresponding probability of post-quarantine transmission with negative binomially-distributed transmissions from a case is
Poisson distribution
Specifying a Poisson distribution producing an expected number of secondary infections post-quarantine transmission of  , the probability of transmission after a quarantine of duration q days
Population prevalence
Given a cohort size N and a prevalence of ρ, the probability of post-quarantine transmission is 1 − (1 − P (q))Nρ.
Methods
Infectivity function
We use a Gamma function to specify the infectivity over the disease time course (Fig. S1, Fig. S11, and Fig. S26). The parameters of the Gamma distribution for a given incubation period were estimated by fitting to the post-symptomatic infectivity profile for incubation periods of five, eight, 11, and 12.3 days 4 through minimization of least squares. The infectivity profiles for incubation periods five, eight, 11, and 12.3 days were determined by fitting a Gamma distribution to the digitized data for each incubation period.
Diagnostic sensitivity function
We used diagnostic test sensitivity from day one to 30 post-symptom onset 5 and the infectivity profile post-symptom onset 4 to construct a mapping from infectivity to diagnostic sensitivity, in order to infer the diagnostic sensitivity during the incubation period. This mapping from infectivity to diagnostic sensitivity was performed using the Hill function
 where n is the Hill coefficient and C is the Hill saturation constant.
Supplementary Tables
Supplementary Figures

Average infectivity profile for a known time of infection under no self-isolation upon symptom onset (black) and perfect isolation upon symptom onset (yellow line) for (A) R0 = 2.5 and 30.8% infections being asymptomatic (resulting in 1.53 secondary infections, yellow fill), (B) R0 = 2 and 30.8% infections being asymptomatic (resulting in 1.22 secondary infections, yellow fill), (C) R0 = 2.5 and 22.6% infections being asymptomatic (resulting in 1.41 secondary infections, yellow fill) and (D) R0 = 2 and 22.6% infections being asymptomatic (resulting in 1.13 secondary infections, yellow fill).

Expected post-quarantine transmission when entering quarantine not through contact tracing for an average incubation period of 8.29 days. The impact of quarantine and testing on reducing secondary infections post-quarantine, with 30.8% of infections asymptomatic and perfect self-isolation of symptomatic infections. Specifying an incubation period using a discretized Gamma distribution for the incubation period with an average of 8.29 days and a 95% credible interval of 7.69–8.92 days for durations of quarantine from 1–21 days, (A) the average number of expected infections post-quarantine when a symptomatic individual enters quarantine uniformly within the incubation period and asymptomatic individuals enter uniformly across the disease time course with no testing, testing on entry, testing on exit, and testing on entry and exit, when tested on exit from quarantine, and when tested on entry and exit from quarantine; and (B) durations of quarantine with testing on entry, testing on exit, and testing on entry and exit that perform just as well or better than a quarantine with no testing. Because of the time required to obtain test results, sampling for the test on exit is assumed to occur the day before the quarantine is complete. Cells that share a background color in common indicate equivalent durations of quarantine associated with each of the testing strategies.

Probability of post-quarantine transmission when entering quarantine not through contact tracing for an average incubation period of 8.29 days.The impact of quarantine and testing on reducing the probability of post-quarantine transmission, with 30.8% of infections asymptomatic and perfect self-isolation of symptomatic infections. Specifying an incubation period using a discretized Gamma distribution for the incubation period with an average of 8.29 days and a 95% credible interval of 7.69–8.92 days, for durations of quarantine from 1–21 days, the average probability of ongoing transmission post-quarantine (probability of one or more post-quarantine infections) when a symptomatic individual enters quarantine uniformly within the incubation period and asymptomatic individuals enter uniformly across the disease time course with no testing, when tested upon entry to quarantine, when tested on exit from quarantine, and when tested on entry and exit from quarantine. Because of the time required to obtain test results, sampling for the test on exit is assumed to occur the day before the quarantine is complete. Cells that share a background color in common indicate equivalent durations of quarantine associated with each of the testing strategies.
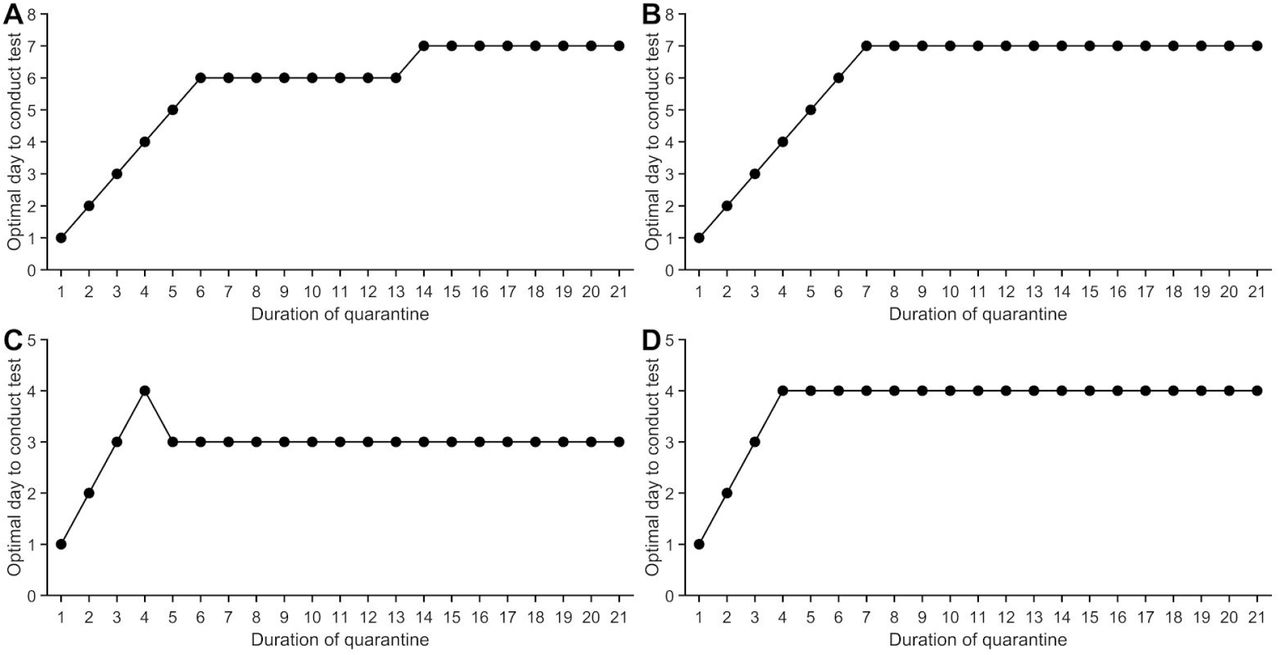
The optimal day of testing to obtain the minimum post-quarantine transmission with 30.8% of infections asymptomatic and perfect self-isolation of symptomatic infections. Specifying an incubation period using a discretized Gamma distribution for the incubation period with an average of (A) 8.29 days and a 95% credible interval of 7.69–8.92 days and uniform entry into quarantine, (B) 8.29 days (95% CI: 7.69–8.92 days) and entry into quarantine as a traced contact, (C) 5.2 days (95% CI: 3.8–6.7 days) and uniform entry into quarantine, (D) 5.2 days (95% CI: 3.8–6.7 days) and entry into quarantine as a traced contact.

The impact of asymptomatic infection on the probability of post-quarantine transmission, with perfect self-isolation of symptomatic infections. Specifying an incubation period using a discretized Gamma distribution for the incubation period with an average of 8.29 days and a 95% credible interval of 7.69–8.92 days, for proportions from 0–1 of infections being asymptomatic, the average probability of post-quarantine transmission(probability of one or more post-quarantine infections) when a symptomatic individual enters quarantine uniformly within the incubation period and asymptomatic individuals enter uniformly across the disease time course with no testing (red) and when tested on entry and exit from quarantine (blue) for a (A) five-day quarantine and a (B) seven-day quarantine. Because of the time required to obtain test results, sampling for the test on exit is assumed to occur the day before the quarantine is complete.

The probability of post-quarantine transmission for a cohort and underlying prevalence. Specifying an incubation period using a discretized Gamma distribution for the incubation period with an average of 8.29 days and a 95% credible interval of 7.69–8.92 days, the probability of post-quarantine transmission accounting for underlying community prevalence in a cohort (crew) of 40 employees for testing on entry (orange), testing on exit (blue), and testing on both entry and exit (purple) for a (A) three-day quarantine, (B) five-day quarantine, (C) seven-day quarantine, and (D) 14-day quarantine. Because of the time required to obtain test results, sampling for the test on exit is assumed to occur the day before the quarantine is complete.

Secondary infections post-quarantine when entering quarantine through contact tracing for an average incubation period of 8.29 days. The impact of quarantine and testing on reducing secondary infections post-quarantine, with 30.8% of infections asymptomatic and perfect self-isolation of symptomatic infections. Specifying an incubation period using a discretized Gamma distribution for the incubation period with an average of 8.29 days and a 95% credible interval of 7.69–8.92 days fo durations of quarantine from 1–21 days, (A) the average number of expected infections post-quarantine when individuals enter quarantine through contact tracing with no testing, testing on entry, testing on exit, and testing on entry and exit, when tested on exit from quarantine, and when tested on entry and exit from quarantine; and (B) durations of quarantine with testing on entry, testing on exit, and testing on entry and exit that perform just as well or better than a quarantine with no testing. Cells that share a background color in common indicate equivalent durations of quarantine associated with each of the testing strategies. Because of the time required to obtain test results, sampling for the test on exit is assumed to occur the day before the quarantine is complete.

Probability of post-quarantine transmission when entering quarantine through contact tracing for an average incubation period of 8.29 days.The impact of quarantine and testing on reducing the probability of post-quarantine transmission, with 30.8% of infections asymptomatic and perfect self-isolation of symptomatic infections. Specifying an incubation period using a discretized Gamma distribution for the incubation period with an average of 8.29 days and a 95% credible interval of 7.69–8.92 days, for durations of quarantine from 1–21 days, the average probability of ongoing transmission post-quarantine (probability of one or more post-quarantine infections) when individuals enter quarantine through contact tracing with no testing, when tested upon entry to quarantine, when tested on exit from quarantine, and when tested on entry and exit from quarantine. Because of the time required to obtain test results, sampling for the test on exit is assumed to occur the day before the quarantine is complete. Cells that share a background color in common indicate equivalent durations of quarantine associated with each of the testing strategies.

Secondary infections post-quarantine when entering quarantine through contact tracing, with a one-day tracing delay, for an average incubation period of 8.29 days. The impact of quarantine and testing on reducing secondary infections post-quarantine, with 30.8% of infections asymptomatic and perfect self-isolation of symptomatic infections. Specifying an incubation period using a discretized Gamma distribution for the incubation period with an average of 8.29 days and a 95% credible interval of 7.69–8.92 days for durations of quarantine from 1–21 days, (A) the average number of expected infections post-quarantine when individuals enter quarantine one day after being identified through contact tracing with no testing, testing on entry, testing on exit, and testing on entry and exit, when tested on exit from quarantine, and when tested on entry and exit from quarantine; and (B) durations of quarantine with testing on entry, testing on exit, and testing on entry and exit that perform just as well or better than a quarantine with no testing. Because of the time required to obtain test results, sampling for the test on exit is assumed to occur the day before the quarantine is complete. Cells that share a background color in common indicate equivalent durations of quarantine associated with each of the testing strategies.

Probability of post-quarantine transmission when entering quarantine through contact tracing, with a one-day tracing delay, for an average incubation period of 8.29 days.The impact of quarantine and testing on reducing the probability of post-quarantine transmission, with 30.8% of infections asymptomatic and perfect self-isolation of symptomatic infections. Specifying an incubation period using a discretized Gamma distribution for the incubation period with an average of 8.29 days and a 95% credible interval of 7.69–8.92 days, for durations of quarantine from 1–21 days, the average probability of ongoing transmission post-quarantine (probability of one or more post-quarantine infections) when individuals enter quarantine after one day from being identified through contact tracing with no testing, when tested upon entry to quarantine, when tested on exit from quarantine, and when tested on entry and exit from quarantine. Because of the time required to obtain test results, sampling for the test on exit is assumed to occur the day before the quarantine is complete. Cells that share a background color in common indicate equivalent durations of quarantine associated with each of the testing strategies.

Average infectivity of an infected individual under no self-isolation upon symptom onset where the average incubation period is 8.29 days (black) and 5.2 days (dashed green line). The number of secondary infections that occur with an incubation period of 8.29 days is 1.09, and with an incubation period of 5.2 days is 1.06.

Secondary infections post-quarantine when entering quarantine not through contact tracing for an average incubation period of 5.2 days.The impact of quarantine and testing on reducing secondary infections post-quarantine, with 30.8% of infections asymptomatic and perfect self-isolation of symptomatic infections. Specifying an incubation period using a discretized Gamma distribution for the incubation period with an average of 5.2 days and a 95% credible interval of 3.8–6.7 days for durations of quarantine from 1–21 days, (A) the average number of expected infections post-quarantine when a symptomatic individual enters quarantine uniformly within the incubation period and asymptomatic individuals enter uniformly across the disease time course with no testing, testing on entry, testing on exit, and testing on entry and exit, when tested on exit from quarantine, and when tested on entry and exit from quarantine; and (B) durations of quarantine with testing on entry, testing on exit, and testing on entry and exit that perform just as well or better than a quarantine with no testing. Because of the time required to obtain test results, sampling for the test on exit is assumed to occur the day before the quarantine is complete. Cells that share a background color in common indicate equivalent durations of quarantine associated with each of the testing strategies.

Probability of post-quarantine transmission when entering quarantine not through contact tracing for an average incubation period of 5.2 days.The impact of quarantine and testing on reducing the probability of post-quarantine transmission, with 30.8% of infections asymptomatic and perfect self-isolation of symptomatic infections. Specifying an incubation period using a discretized Gamma distribution for the incubation period with an average of 5.2 days and a 95% credible interval of 3.8–6.7 days, for durations of quarantine from 1–21 days, the average probability of ongoing transmission post-quarantine (probability of one or more post-quarantine infections) when a symptomatic individual enters quarantine uniformly within the incubation period and asymptomatic individuals enter uniformly across the disease time course with no testing, when tested upon entry to quarantine, when tested on exit from quarantine, and when tested on entry and exit from quarantine. Because of the time required to obtain test results, sampling for the test on exit is assumed to occur the day before the quarantine is complete. Cells that share a background color in common indicate equivalent durations of quarantine associated with each of the testing strategies.

Secondary infections post-quarantine when entering quarantine through contact tracing for an average incubation period of 5.2 days.The impact of quarantine and testing on reducing secondary infections post-quarantine, with 30.8% of infections asymptomatic and perfect self-isolation of symptomatic infections. Specifying an incubation period using a discretized Gamma distribution for the incubation period with an average of 5.2 days and a 95% credible interval of 3.8–6.7 days for durations of quarantine from 1–21 days, (A) the average number of expected infections post-quarantine when individuals enter quarantine through contact tracing with no testing, testing on entry, testing on exit, and testing on entry and exit, when tested on exit from quarantine, and when tested on entry and exit from quarantine; and (B) durations of quarantine with testing on entry, testing on exit, and testing on entry and exit that perform just as well or better than a quarantine with no testing. Because of the time required to obtain test results, sampling for the test on exit is assumed to occur the day before the quarantine is complete. Cells that share a background color in common indicate equivalent durations of quarantine associated with each of the testing strategies.

Probability of post-quarantine transmission when entering quarantine through contact tracing for an average incubation period of 5.2 days. Impact of quarantine and testing on reducing the probability of post-quarantine transmission, with 30.8% of infections asymptomatic and perfect self-isolation of symptomatic infections. Specifying an incubation period using a discretized Gamma distribution for the incubation period with an average of 5.2 days and a 95% credible interval of 3.8–6.7 days, for durations of quarantine from 1–21 days, the average probability of ongoing transmission post-quarantine (probability of one or more post-quarantine infections) when individuals enter quarantine through contact tracing with no testing, when tested upon entry to quarantine, when tested on exit from quarantine, and when tested on entry and exit from quarantine. Because of the time required to obtain test results, sampling for the test on exit is assumed to occur the day before the quarantine is complete. Cells that share a background color in common indicate equivalent durations of quarantine associated with each of the testing strategies.

Secondary infections post-quarantine when entering quarantine not through contact tracing for an average incubation period of 8.29 days and no delay in obtaining the test result. The impact of quarantine and testing on reducing secondary infections post-quarantine, with 30.8% of infections asymptomatic and perfect self-isolation of symptomatic infections. Specifying an incubation period using a discretized Gamma distribution for the incubation period with an average of 8.29 days and a 95% credible interval of 7.69–8.92 days for durations of quarantine from 1–21 days, (A) the average number of expected infections post-quarantine within the incubation period and asymptomatic individuals enter uniformly across the disease time course with no testing, testing on entry, testing on exit, and testing on entry and exit, when tested on exit from quarantine, and when tested on entry and exit from quarantine; and B) durations of quarantine with testing on entry, testing on exit, and testing on entry and exit that perform just as well or better than a quarantine with no testing. Testing on exit is assumed to occur on the last day of quarantine (i.e. there is negligible delay in obtaining the test result). Cells that share a background color in common indicate equivalent durations of quarantine associated with each of the testing strategies.

Probability of post-quarantine transmission when entering quarantine not through contact tracing for an average incubation period of 8.29 days, with no delay in obtaining test results. The impact of quarantine and testing on reducing the probability of post-quarantine transmission, with 30.8% of infections asymptomatic and perfect self-isolation of symptomatic infections. Specifying an incubation period using a discretized Gamma distribution for the incubation period with an average of 8.29 days and a 95% credible interval of 7.69–8.92 days, for durations of quarantine from 1–21 days, the average probability of ongoing transmission post-quarantine (probability of one or more post-quarantine infections) when a symptomatic individual enters quarantine uniformly within the incubation period and asymptomatic individuals enter uniformly across the disease time course with no testing, when tested upon entry to quarantine, when tested on exit from quarantine, and when tested on entry and exit from quarantine. Testing on exit is assumed to occur on the last day of quarantine (i.e. there is negligible delay in obtaining the test result). Cells that share a background color in common indicate equivalent durations of quarantine associated with each of the testing strategies.

Secondary infections post-quarantine when entering quarantine through contact tracing for an average incubation period of 8.29 days and no delay in obtaining the test result. The impact of quarantine and testing on reducing secondary infections post-quarantine, with 30.8% of infections asymptomatic and perfect self-isolation of symptomatic infections. Specifying an incubation period using a discretized Gamma distribution for the incubation period with an average of 8.29 days and a 95% credible interval of 7.69–8.92 days for durations of quarantine from 1–21 days, (A) the average number of expected infections post-quarantine when a symptomatic individual enters quarantine through contact tracing with no testing, testing on entry, testing on exit, and testing on entry and exit, when tested on exit from quarantine, and when tested on entry and exit from quarantine; and (B) durations of quarantine with testing on entry, testing on exit, and testing on entry and exit that perform just as well or better than a quarantine with no testing. Testing on exit is assumed to occur on the last day of quarantine (i.e. there is negligible delay in obtaining the test result). Cells that share a background color in common indicate equivalent durations of quarantine associated with each of the testing strategies

Probability of post-quarantine transmission when entering quarantine through contact tracing for an average incubation period of 8.29 days, with no delay in obtaining the test result. The impact of quarantine and testing on reducing the probability of post-quarantine transmission, with 30.8% of infections asymptomatic and perfect self-isolation of symptomatic infections. Specifying an incubation period using a discretized Gamma distribution for the incubation period with an average of 8.29 days and a 95% credible interval of 7.69–8.92 days, for durations of quarantine from 1–21 days, the average probability of ongoing transmission post-quarantine (probability of one or more post-quarantine infections) when individuals enter quarantine through contact tracing with no testing, when tested upon entry to quarantine, when tested on exit from quarantine, and when tested on entry and exit from quarantine. Testing on exit is assumed to occur on the last day of quarantine (i.e. there is negligible delay in obtaining the test result). Cells that share a background color in common indicate equivalent durations of quarantine associated with each of the testing strategies.

Secondary infections post-quarantine when entering quarantine not through contact tracing for an average incubation period of 8.29 days and fewer asymptomatic infections.The impact of quarantine and testing on reducing secondary infections post-quarantine, with 22.6% of infections asymptomatic and perfect self-isolation of symptomatic infections. Specifying an incubation period using a discretized Gamma distribution for the incubation period with an average of 8.29 days and a 95% credible interval of 7.69–8.92 days for durations of quarantine from 1–21 days, (A) the average number of expected infections post-quarantine when a symptomatic individual enters quarantine uniformly within the incubation period and asymptomatic individuals enter uniformly across the disease time course with no testing, testing on entry, testing on exit, and testing on entry and exit, when tested on exit from quarantine, and when tested on entry and exit from quarantine; and (B) durations of quarantine with testing on entry, testing on exit, and testing on entry and exit that perform just as well or better than a quarantine with no testing. Because of the time required to obtain test results, sampling for the test on exit is assumed to occur the day before the quarantine is complete. Cells that share a background color in common indicate equivalent durations of quarantine associated with each of the testing strategies.

Probability of post-quarantine transmission when entering quarantine not through contact tracing for an average incubation period of 8.29 days.The impact of quarantine and testing on reducing the probability of post-quarantine transmission, with 22.6% of infections asymptomatic and perfect self-isolation of symptomatic infections. Specifying an incubation period using a discretized Gamma distribution for the incubation period with an average of 8.29 days and a 95% credible interval of 7.69–8.92 days, for durations of quarantine from 1–21 days, the average probability of ongoing transmission post-quarantine (probability of one or more post-quarantine infections) when a symptomatic individual enters quarantine uniformly within the incubation period and asymptomatic individuals enter uniformly across the disease time course with no testing, when tested upon entry to quarantine, when tested on exit from quarantine, and when tested on entry and exit from quarantine. Because of the time required to obtain test results, sampling for the test on exit is assumed to occur the day before the quarantine is complete. Cells that share a background color in common indicate equivalent durations of quarantine associated with each of the testing strategies.

Secondary infections post-quarantine when entering quarantine through contact tracing for an average incubation period of 8.29 days and fewer asymptomatic infections.The impact of quarantine and testing on reducing secondary infections post-quarantine, with 22.6% of infections asymptomatic and perfect self-isolation of symptomatic infections. Specifying an incubation period using a discretized Gamma distribution for the incubation period with an average of 8.29 days and a 95% credible interval of 7.69–8.92 days for durations of quarantine of 1–21 days, (A) the average number of expected infections post-quarantine when individuals enter quarantine through contact tracing with no testing, testing on entry, testing on exit, and testing on entry and exit, when tested on exit from quarantine, and when tested on entry and exit from quarantine; and (B) the durations of quarantine with testing on entry, testing on exit, and testing on entry and exit that perform just as well or better than a quarantine with no testing. Because of the time required to obtain test results, sampling for the test on exit is assumed to occur the day before the quarantine is complete. Cells that share a background color in common indicate equivalent durations of quarantine associated with each of the testing strategies.

Probability of post-quarantine transmission when entering quarantine not through contact tracing for an average incubation period of 8.29 days, with fewer asymptomatic infections. The impact of quarantine and testing on reducing the probability of post-quarantine transmission, with 22.6% of infections asymptomatic and perfect self-isolation of symptomatic infections. Specifying an incubation period using a discretized Gamma distribution for the incubation period with an average of 8.29 days and a 95% credible interval of 7.69–8.92 days, for durations of quarantine from 1–21 days, the average probability of ongoing transmission post-quarantine (probability of one or more post-quarantine infections) when individuals enter quarantine through contact tracing with no testing, when tested upon entry to quarantine, when tested on exit from quarantine, and when tested on entry and exit from quarantine. Because of the time required to obtain test results, sampling for the test on exit is assumed to occur the day before the quarantine is complete. Cells that share a background color in common indicate equivalent durations of quarantine associated with each of the testing strategies.

Probability of post-quarantine transmission when entering quarantine not through contact tracing for an average incubation period of 8.29 days, assuming transmission is Poisson distributed.The impact of quarantine and testing on reducing the probability of post-quarantine transmission, with 30.8% of infections asymptomatic and perfect self-isolation of symptomatic infections. Specifying an incubation period using a discretized Gamma distribution for the incubation period with an average of 8.29 days and a 95% credible interval of 7.69–8.92 days, for durations of quarantine from 1–21 days, the average probability of ongoing transmission post-quarantine (probability of one or more post-quarantine infections) when a symptomatic individual enters quarantine uniformly within the incubation period and asymptomatic individuals enter uniformly across the disease time course with no testing, when tested upon entry to quarantine, when tested on exit from quarantine, and when tested on entry and exit from quarantine. Because of the time required to obtain test results, sampling for the test on exit is assumed to occur the day before the quarantine is complete. Cells that share a background color in common indicate equivalent durations of quarantine associated with each of the testing strategies.
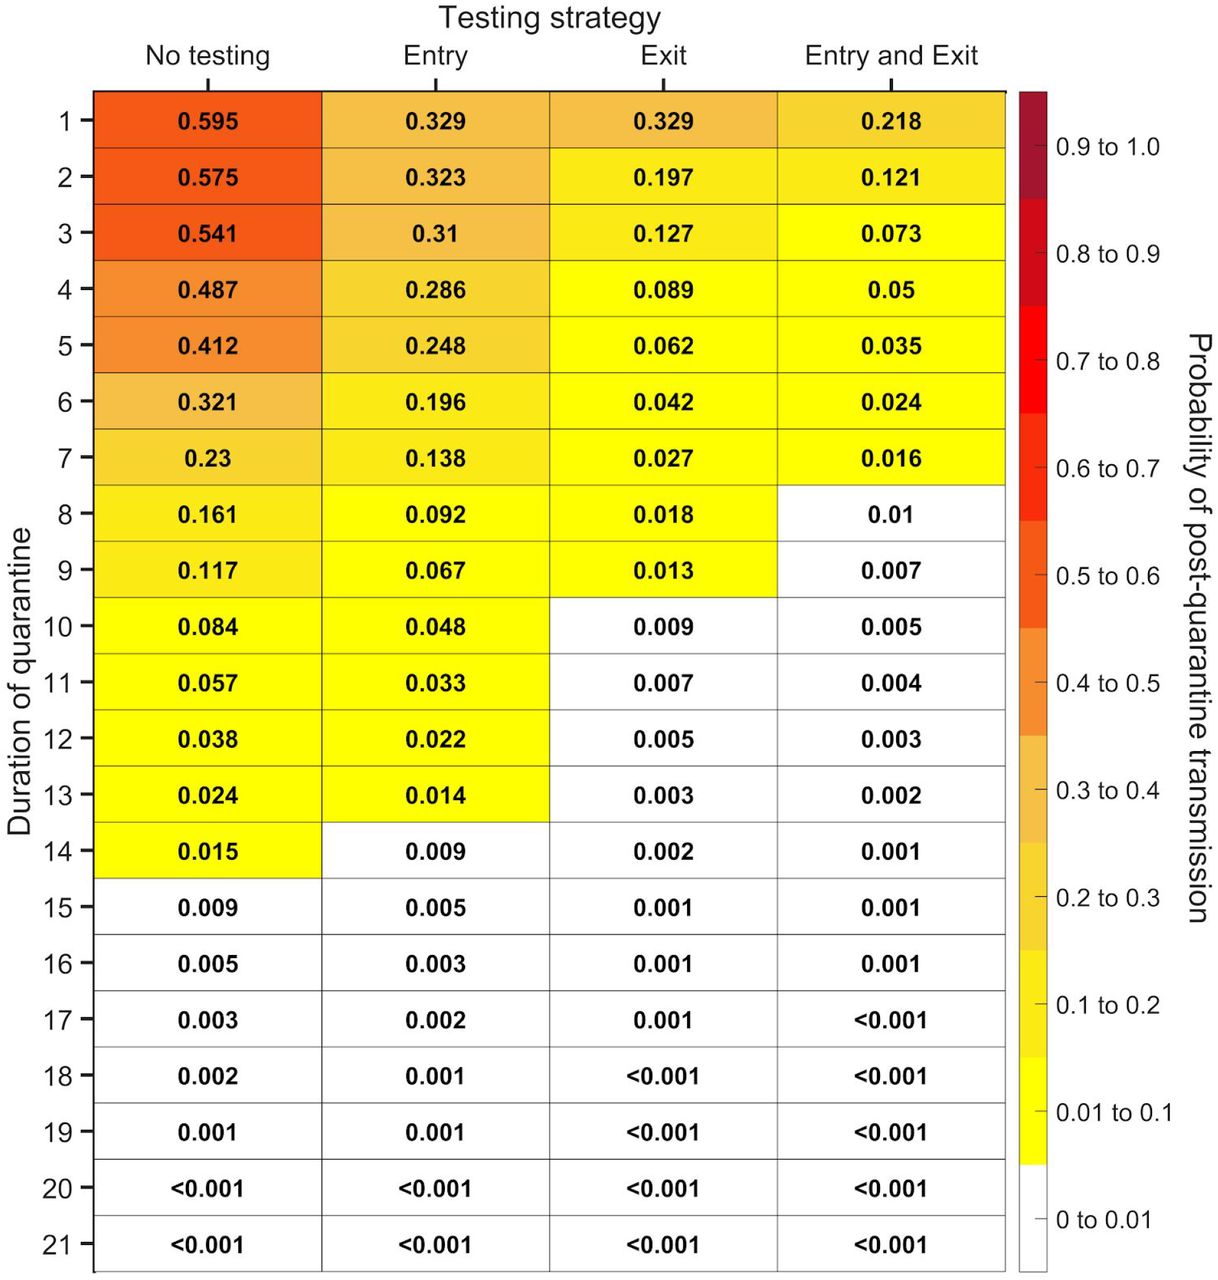
Probability of post-quarantine transmission when entering quarantine through contact tracing for an average incubation period of 8.29 days, assuming transmission is Poisson distributed. The impact of quarantine and testing on reducing the probability of post-quarantine transmission, with 30.8% of infections asymptomatic and perfect self-isolation of symptomatic infections. Specifying an incubation period using a discretized Gamma distribution for the incubation period with an average of 8.29 days and a 95% credible interval of 7.69–8.92 days, for durations of quarantine from 1–21 days, the average probability of ongoing transmission post-quarantine (probability of one or more post-quarantine infections) when individuals enter quarantine through contact tracing with no testing, when tested upon entry to quarantine, when tested on exit from quarantine, and when tested on entry and exit from quarantine. Because of the time required to obtain test results, sampling for the test on exit is assumed to occur the day before the quarantine is complete. Cells that share a background color in common indicate equivalent durations of quarantine associated with each of the testing strategies.

The infectivity profile over the time course of disease for incubation periods of 5.2days (blue), 7.76 days (black), 8.29 days (green), and 14 days (yellow).

The diagnostic sensitivity of the RT-PCR test over the time course of disease. (A) The infectivity function using an incubation period of 7.76 days (median estimate) 7 was mapped to the diagnostic sensitivity using a sigmoidal Hill function (black line) fit to the empirical data of SARS CoV-2 test results from Xiao, A. T. et al. 5 (red dots) through minimization of least squares. (B) The daily diagnostic sensitivity for an incubation period of 5.2 days (blue), 8.29 days (green), and 14 days (yellow) over the course of the disease.

The probability density function for when during the disease time course cases enter quarantine. (A) The day in which a contact infected by an index case enters quarantine (black) compared to the uniform entry into quarantine of a case to exhibit symptoms (blue) and an asymptomatic case (red). (B) The day in which the asymptomatic contact that infected the index case enters quarantine (black) compared to the uniform entry of an asymptomatic case (red) entering quarantine.
Acknowledgements
We thank Justin Abshire for expert data collection. J.P.T. gratefully acknowledges funding from the National Science Foundation grant CCF 1918656, the Elihu endowment, Notsew Orm Sands Foundation, and BHP. G.K., B.S., and R.H.M acknowledge funding from BHP. S.M.M. acknowledges support from the Canadian Institutes of Health Research (grant OV4-170643; Canadian 2019 Novel Coronavirus Rapid Research), the Natural Sciences and Engineering Research Council of Canada, and BHP. A.P.G. gratefully acknowledges funding from NIH UO1-GM087719, the Burnett and Stender families’ endowment, the Notsew Orm Sands Foundation, and BHP.


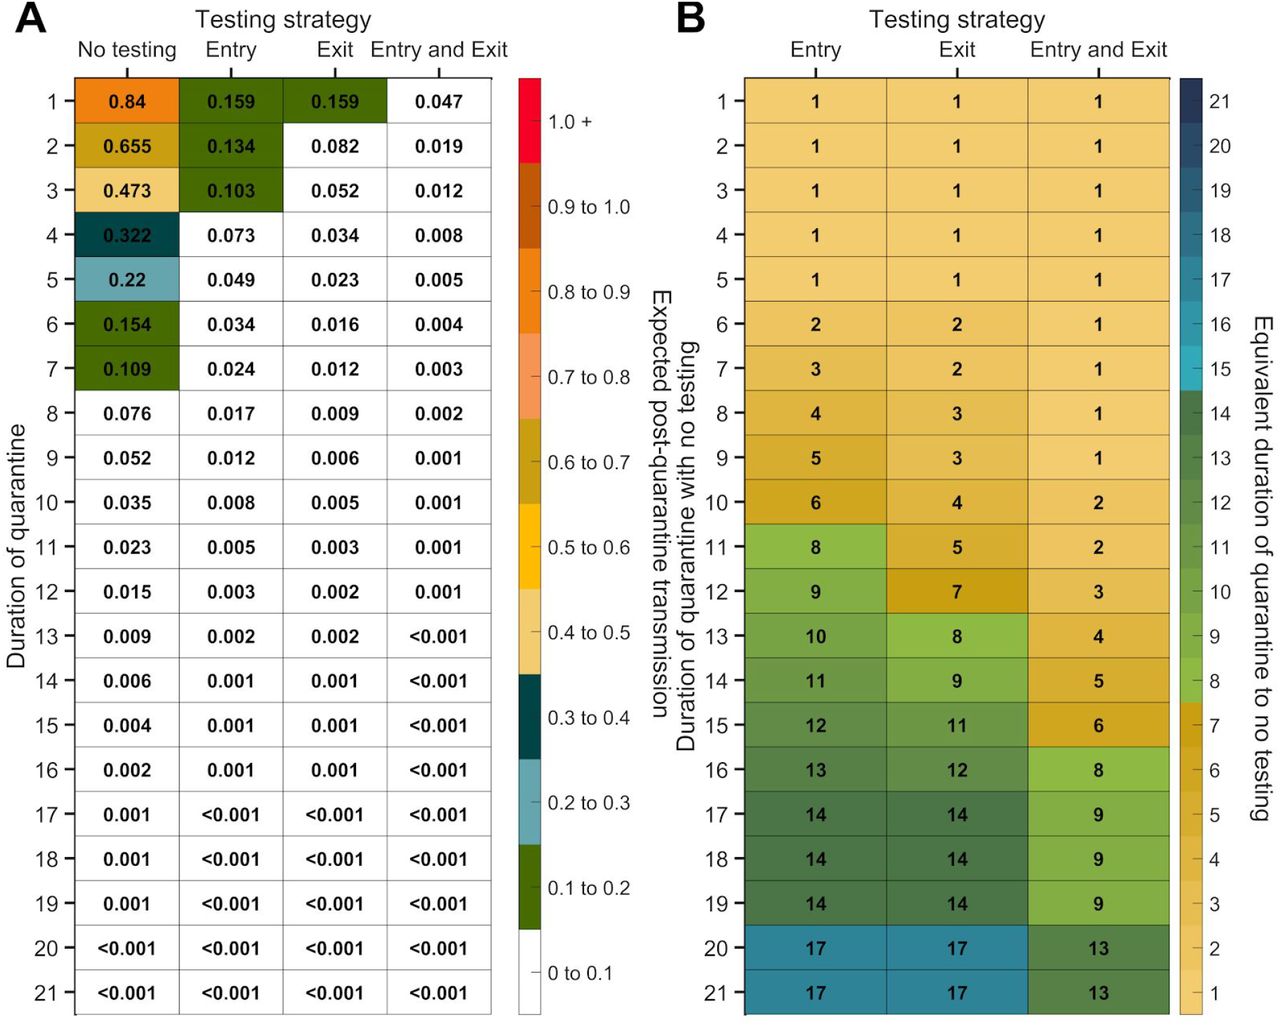