
Abstract
CO2 is co-exhaled with aerosols containing SARS-CoV-2 by COVID-19 infected people and can be used as a proxy of SARS-CoV-2 concentrations indoors. Indoor CO2 measurements by low-cost sensors hold promise for mass monitoring of indoor aerosol transmission risk for COVID-19 and other respiratory diseases. We derive analytical expressions of CO2-based risk proxies and apply them to various typical indoor environments. Contrary to some earlier recommendations setting a single indoor CO2 threshold, we show that the CO2 level corresponding to a given infection risk varies by over 2 orders of magnitude for different environments and activities. Although large uncertainties, mainly from virus exhalation rates, are still associated with our infection risk estimates, our study provides more specific and practical recommendations for low-cost CO2-based indoor infection risk monitoring.
One Sentence Summary Guidelines for indoor CO2 concentrations to reduce indoor COVID-19 infection risk need to account for environment and activity types.
Coronavirus disease 2019 (COVID-19) is currently sweeping the world and causing major losses of human lives (1). Lockdowns imposed to various extent worldwide for the COVID-19 transmission reduction are not supposed to be long-term measures, otherwise they would lead to unaffordable social and economic costs. On the other hand, resumption of social, educational, and business activities raises concerns about transmission resurgence.
In last few months, there has been rapidly mounting evidence for COVID-19 transmissions via aerosols (2, 3), i.e., severe acute respiratory syndrome coronavirus 2 (SARS-CoV-2)-containing particles with diameters of e.g., several µm that can float in the air for minutes to hours. Transmission is much easier indoors than outdoors, which is most consistent with aerosols (3–5). As humans spend most time in indoor environments, where air volumes are limited and virus-laden aerosols may easily accumulate, mitigation of indoor COVID-19 transmissions is a subject of high interest (6, 7) and is key to a successful societal and economic reopening. Practical, affordable, and widely applicable measures to monitor and limit indoor transmission risks are urgently needed.
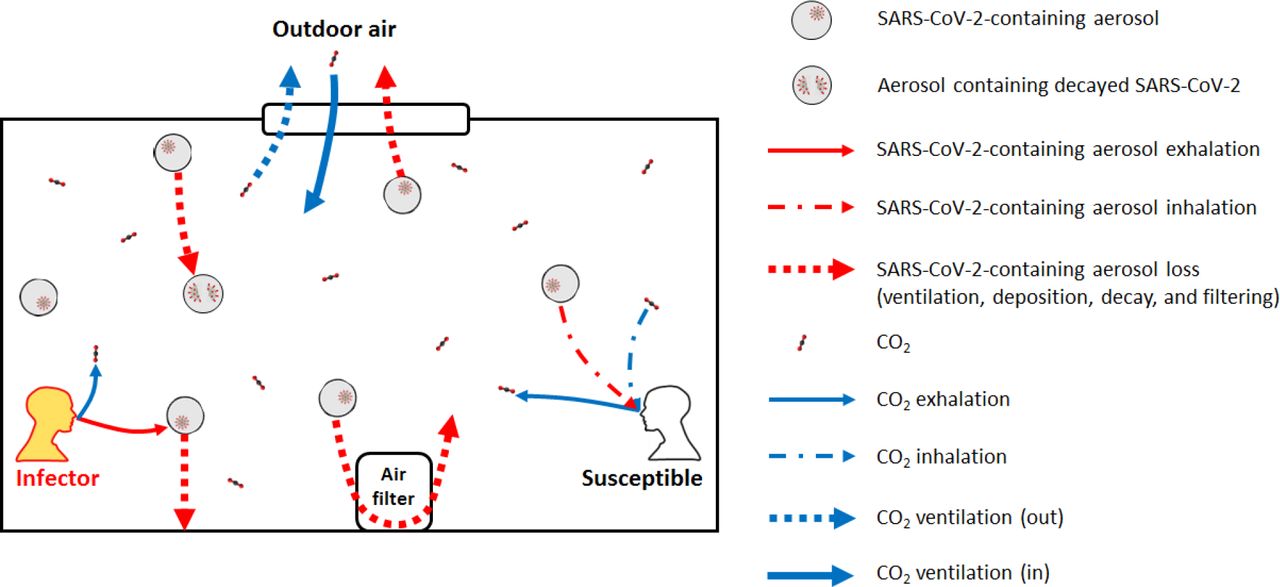
Indoor CO2 has been suggested as a practical proxy of respiratory infectious disease transmission risk (8), as pathogen-containing aerosols and CO2 are co-exhaled by those infected (Fig. 1). Since background (ambient) CO2 level is stable and indoor excess CO2 is usually only from human exhalation, measurements of indoor CO2 concentration by low-cost CO2 sensors can often be good indicators of infection risk and suitable for mass deployment (9, 10). However, the CO2 level corresponding to a given COVID-19 infection risk is largely unknown. A few guideline limit concentrations have been proposed, but without solid and quantitative basis (11,12). In particular, only a single CO2 threshold was recommended in each of these proposed guidelines. Whether a single CO2 concentration ensures low COVID-19 infection risk in all common indoor environments remains an open question, but is also critical for effective CO2-based mass risk monitoring.

Schematic illustrating the exhalation, inhalation, and other loss processes of SARS-CoV-2-containing aerosols and the exhalation, inhalation, and other source and sink of CO2 in an indoor environment.
In this study, we derive the analytical expressions of the probability of indoor COVID-19 infection through room-level aerosol transmission only (i.e., assuming social distance is kept so that close proximity aerosol and droplet pathways are eliminated; fomite transmission is not included), human-exhaled CO2 concentration, and subsequently a few CO2-based quantities as infection risk proxies. Based on available data, we apply these expressions to common indoor settings to answer the abovementioned open question.
To derive the SARS-CoV-2 aerosol concentration in indoor air, we assume well-mixed air (Fig. 1). SARS-CoV-2 is emitted by infectious person(s) only. Ventilation with outdoor air, virus decay and deposition onto surfaces, and additional control measures (e.g., air filtration and use of germicidal UV) result in losses of infective virus from indoor air. Other sources (e.g., virus-containing aerosol resuspension) and sinks (e.g., inhalation by humans and animals indoors) are assumed to be unable to significantly affect the SARS-CoV-2 concentration. The amount of the virus infectious doses (“quanta”) inhaled by a susceptible person (n) determines their probability of infection (P). According to the Wells-Riley model of aerosol infection (13),

One SARS-CoV-2 quantum corresponds to a probability of infection of 1-1/e (63%). The expected value of n (〈n〉) for an originally uninfected person corresponding to a given level of immunity in local population (probability of an occupant being immune, Pim), can be calculated as follows
 where cavg, B, D, and min are the average virus concentration (quanta m-3), breathing rate of the susceptible person (m3 h-1), duration of the event (h), and mask filtration efficiency for inhalation, respectively. (1 − Pim) is included since quanta inhaled by an immune uninfected individual will not lead to infection and should be excluded. Under the assumption of no occupants and no SARS-CoV-2 in the indoor air at the start of the event, the analytical expression of the expected value of cavg based on the prevalence of infectors in local population (probability of an occupant being infector, PI), <cavg>, is (see Materials and Methods for the derivation)
 where N is number of occupants, Ep is the SARS-CoV-2 exhalation rate by an infector (quanta h-1), mex mask filtration efficiency for exhalation, V indoor environment volume (m3), and λ first-order virus loss rate coefficient (h-1) that includes the ventilation with outdoor air and all other virus removal and deactivation processes.
If there are no other significant CO2 sources/sinks (e.g., gas/coal stove and pets/plants), i.e., if indoor excess CO2 (relative to the background outdoor level) production is only due to human exhalation and its loss is ventilation, similar quantities for CO2 can be expressed as follows (see Materials and Methods for the derivation)

 where nΔCO2,ΔCavg,CO2, and Ep,co2 are inhaled excess (human-exhaled) CO2 volume (m3), excess CO2 volume mixing ratio, and CO2 exhalation rate per person (m3 h-1), respectively, and λ0 is the ventilation rate (h-1).
When P is low, as it should be for a safe reopening, P ≈ n. As airborne SARS-CoV-2 and excess CO2 are co-exhaled and co-inhaled, in principle nΔCO2 can be a proxy of ‹n›, and thus P. The ratio nΔCO2 of to ‹n› (in m3 quantum-1),
 indicates the volume of inhaled excess CO2 corresponding to a unit inhaled quantum. However, this quantity, involving inhaled CO2 volume that is difficult to measure, is not practical for widespread transmission risk monitoring, which usually requires a fast decision-making process simply based on indoor CO2 concentration reading (usually in ppm) of a low-cost sensor. Therefore, we propose, as another proxy of the risk of an environment, with PI = 0.1%, the volume mixing ratio of the excess CO2 that an uninfected individual inhales for 1 h in that environment for
  .
.
This quantity is closely related to the excess CO2 level corresponding to the unity basic reproduction number (R0) (8) (see Materials and Methods for details), and can be directly and easily compared to CO2 sensor readings. The ratio of the sensor reading to  is that of the probability of infection of an originally uninfected person in that environment for 1 h to 0.01%. P = 0.01% being chosen as reference does not imply safety at this P in all situations, since when N and/or D are large, and/or the event is repeated many times (e.g., in school/university settings), the overall probability of infection for one susceptible person and/or total infections may still be significant.
 is a function of a number of variables. A priori, varying any of them can result in a different value of
  even for similar settings. As an example, we study a set of model cases for a typical university class. The cases are specified in Table S1. The
  and
and in these cases are shown in Fig. 2A and S1A, respectively.

Excess CO2 volume mixing ratio (ppm) that an uninfected individual inhales for 1 h for a probability of infection of 0.01%  and probability of infection per ppm excess CO2 inhaled for 1 hr (inversely proportional to
  ) for (A) variants of the university class case (see Table S1 for the case details), (B) various activities (see Table S2 for details of the activities), and (C) several indoor environments(see Table S3 for the case details).
In the base class case, the infector is assumed to be the instructor. Compared to the case with a student being infector,  in the base case is ∼1.5 orders of magnitude lower, just because the vocalization of the instructor, who usually speaks, greatly enhances Ep (14, 15), while virus exhalation by students, who are assumed here to speak little, is much less efficient. In the case of a physical education (PE) class in the same indoor environment, where occupants are assumed to be doing heavy exercise and no talking,
  is much lower than for the infected student case in a traditional lecture (Fig. 2A). Compared to sitting, heavy exercise increases both occupants’ virus and CO2 exhalation rates to similar extents (14–16), which does not significantly change
  . However, breathing rates of occupants doing intense activities are much higher than those sitting (17). Even if CO2 and SARS-CoV-2 concentrations are the same as in the infected student case, a susceptible person in the PE class case can still inhale a larger dose of SARS-CoV-2 and more excess CO2, and have a remarkably different P. As a result, a single recommendation of indoor CO2 threshold is not valid even for a series of school settings.
According to Eqs. 2 and 3, whether occupants wear masks and what masks they wear can make a substantial difference in infection risk through virus filtration in the same indoor setting. However, masks do not filter CO2. The base class case (with surgical masks), that with all occupants wearing N95 respirators, and that with no mask use have identical CO2 mixing ratios, but up to ∼2 orders of magnitude different P (Table S1) due to filtration of virus-containing particles by mask. Therefore, for the same P of 0.01%, the base class case has a corresponding excess CO2 level x∼30 lower than the case with all occupants wearing N95 respirators, but x∼2 higher than the case with no mask use (Fig. 2A).
PI is obviously another important factor governing the infection risk, as P proportional to it. Again, it has no impact on CO2. Compared to the base class case (PI = 0.001), the estimated situation of New York City in April (PI = 0.023) and of Boulder, CO in June (PI = 0.0003) have x∼20 higher and x∼2 lower P, respectively, (Table S1), and hence Δcco2(1 h,p = 0.01%) lower and higher to the respective extents (Fig. 2A). However, Pim usually cannot result in a difference in P greater than a factor of 2 under conditions of interest, since if Pim > 50%, the population has reached or is close to herd immunity (18) and widespread transmission risk monitoring is no longer needed.
According to Eq. 7, the other variables that can affect  are N, D, λ, and λ0.
  is generally not highly sensitive to them, although some of them (e.g., λ) can have a large impact on P. As long as occupants are not only a few,
  , where N plays a role in Eq. 7, is close to 1.
The fraction term involving D, λ, and λ0 (after the product sign) in Eq. 7 usually does not deviate from 1 substantially (Fig. S2). It is close to 1 when λD is very small, and λ/λ0 when λD is very large. As long as the indoor environment is not very poorly ventilated nor equipped with very strong virus removal setups (e.g., substantial filtering of recirculated air, portable HEPA filters, germicidal UV), λ/λ0 is relatively close to 1. Compared to the base classroom case (λ/λ0 ∼ 1.3), doubling the duration or ventilation brings minimal changes to  . Increasing λ/λ0 to ∼3 by additional virus control measures increases
  more significantly, as those measures do not remove CO2. But this change is still within a factor of 2 for the range of control measures in these examples (Fig. 2A).
As discussed above, occupants’ activities indoors, to which Ep, Ep,co2, and B are all related, are a major or dominant factor governing the infection risk. We thus compile the data of these parameters as a function of activity (intensity and vocalization degree) (Table S2). Note that this compilation has large uncertainties from Ep data (14, 15) and matching of activity categories, which are all classified differently for Ep, Ep,co2, and B (see Materials and Methods for details). Moreover, these uncertainties are currently impossible to quantify. However, the trends shown by the data are clear and thus able to reveal the relative risk of these activities with confidence. Simply, the stronger vocalization, the higher risk, and the more intense activity, the higher risk. We calculate  for these activities when N is large, D = 1 h, PI = 0.001, λ0 = 3 h−1, λ = 4 h−1, no mask is used (Fig. 2B), a setting similar to the class case. Three class cases, i.e., base, infected student, and PE cases, can be easily related to the activity categories of “Standing – loudly speaking”, “Resting – breathing”, and “Heavy exercise – breathing”, respectively. The related pairs have
  within x∼2 and their mask use setting and close but different Ep, Ep,co2, and B values can largely explain the differences in
 .
.
Then we apply this analysis to a range of real-world settings, in addition to the class case, i.e., the Skagit County choir superspreading event (19), a subway car, a supermarket (focused on a worker), and an event in a stadium, which, though outdoors, often has somewhat stagnant air allowing virus-laden aerosols to build up and thus can be treated similarly as an indoor environment (see Table S3 for the specifications of these cases). Figures 2C and S1B shows their  and
and , respectively. Again, these values span orders of magnitude. We can still relate these cases to the activity categories of “Standing – loudly speaking”, “Resting – breathing”, “Light exercise – breathing” (or “Light exercise – speaking”), and “Light exercise – speaking” (or “Light exercise – loudly speaking”), respectively.
For the actual choir case, its PI is an order of magnitude lower than 0.1% while the estimated Ep is an order of magnitude higher (19), resulting in a similar  to that of “Standing – loudly speaking” shown in Fig. 2B.
  in the stadium case is between those of “Light exercise – speaking” and “Light exercise – loudly speaking”, as both activities may happen in the event. The difference of
  between the supermarket case and its related activities shown in Fig. 2B is mainly due to the long duration of the event (8 h).
  of the supermarket case divided by D leads to the excess CO2 threshold for the worker to inhale over 8 h between those of “Light exercise – breathing” and “Light exercise – speaking”.
  of the subway case is ∼1/3 lower than that of “Resting – breathing” in Fig. 2B because of the short duration (0.33 h) and mask use (universal use of surgical masks or equivalent).
As shown above, the infection risk analysis for various settings can be based on the relevant activities with adjustments for PI, D, mask use etc. For policy-making concerning acceptable indoor CO2 level, we also recommend an activity-dependent approach. Reference excess CO2 levels for indoor environments with certain types of activities mainly involved can be found in Fig. 2B. Then this mixing ratio can be scaled for typical D (by multiplying it) and target P (by multiplying its ratio to 0.01%) to obtain an excess CO2 threshold, which may be relaxed a little further depending on the local mask policy. The sum of this value and the outdoor CO2 concentration, i.e., ∼410 ppm (20), is the final recommended indoor CO2 concentration threshold. This procedure is relatively easy to implement at local and even individual business levels but has a much stronger scientific basis than one-threshold-for-all approaches. Calculations for other scenarios can be easily performed with the online COVID-19 aerosol transmission estimator (21).
Data Availability
All data is available in the main text or the supplementary materials. The COVID-19 Aerosol Transmission Estimator, with which a large part of calculations in this study were done, is freely available at https://tinyurl.com/covid-estimator.
Funding
None.
Author contributions
J.L.J. conceived the study. Z.P. and J.L.J jointly designed and conducted the research. Z.P. wrote the paper with input from J.L.J.
Competing interests
Authors declare no competing interests.
Data and materials availability
All data is available in the main text or the supplementary materials. The COVID-19 Aerosol Transmission Estimator, with which a large part of calculations in this study were done, is freely available at https://tinyurl.com/covid-estimator.
Supplementary Materials
Materials and Methods
Figures S1-S3
Tables S1-S3
Acknowledgments
We thank Demetrios Pagonis and Bertrand Waucquez for useful discussions.
References


