
Abstract
Amyotrophic lateral sclerosis is a multifactorial and multisystem motor neuron disease with currently no effective treatment. There is an urgent need to identify biomarkers that can tackle the disease’s complexity and help in early diagnosis, prognosis, and therapy development. Extracellular vesicles (EVs) are nanostructures that are released by any cell type into body fluids. Their variable biophysical and biochemical characteristics reflect the parent cell’s physiological and pathological state and make them an attractive source of multidimensional data for patient classification and stratification. To test whether EVs could be exploited as diagnostic and prognostic biomarkers in ALS, we analyzed plasma-derived EVs of ALS patients and relative healthy and diseased controls. Using the nickel-based isolation, a recently developed EV purification method, we unmasked peculiar features in plasma EVs of ALS patients with a potential straightforward application in a clinical setting. We report that the number of particles is increased in the plasma of ALS patients and two mouse models of ALS while the average diameter is decreased. Proteins like HSP90 and phosphorylated TDP-43 are differentially represented in ALS patients and mice compared to the controls. In terms of disease progression, the levels of phosphorylated TDP-43 and cyclophilin A, along with the EV size distribution, discriminated fast and slow disease progressors suggesting a new means for patient stratification. Finally, we conceived an innovative mathematical model based on machine learning techniques that integrating EV size distribution data with biochemical EV parameters resulted in very high prediction rates for disease diagnosis and prognosis.
Introduction
Amyotrophic Lateral Sclerosis (ALS) is a rare and fatal neurodegenerative disorder with an incidence of 3.03 cases per 100,000 persons (1). ALS leads to a selective loss of upper and lower motor neurons resulting in progressive paralysis and death within a few years from onset. About 50% of patients also develop non-motor symptoms with cognitive and behavioral changes that may appear before or after motor impairment (2). ALS’s biggest challenge is identifying reproducible biochemical biomarkers that predict the disease in its prodromal phase and that change during the disease progression. These biomarkers should reveal the presence of an adaptive response to a toxic stimulus before the degeneration starts. For example, the prodromal stage of Alzheimer’s disease is well monitored by detecting the increase of the amyloid protein peptides in the brain up to ten years before the onset of the symptoms (3). In ALS, TDP-43 is a clear hallmark of the disease; it has been observed as highly post-translationally modified (cleaved and hyperphosphorylated) in protein inclusions in 97% of patients in the post mortem specimen, but its analysis in biofluids has been difficult to reproduce (4) and methods to detect TDP-43 pathology during patient lifetime are missing. Neurofilaments are promising biochemical biomarkers to diagnose ALS even before the onset of clinical symptoms (6-8). However, a drawback aspect is that neurofilaments are increased not only in ALS but also in other neurodegenerative conditions (9). Moreover, neurofilaments represent the end product of a degradative process in the axons. Their detection in the biofluids corresponds to damage that has been initiated probably many years before in the patients.
Extracellular vesicles are nano- or micro-sized membranous particles released by any cells and can be found in biological fluids. There are two types of EVs, namely exosomes, that originate from late endosome/multivesicular bodies and microvesicles that directly bud from the plasma membrane (10). Since circulating vesicles comprise both exosomes and microvesicles, it is now preferred the inclusive term extracellular vesicles (EVs) (11). EVs carry specific sets of lipids, nucleic acids, and proteins, some of which are common to all EVs, such as cytosolic proteins and chaperones, while others are unique and reflect specialized functions of the cell of origin (12). In neurodegenerative diseases, there is emerging evidence that EVs might be involved in the disease spreading since several pathogenic misfolded proteins are associated with plasma- or cerebral spinal fluid (CSF)-derived EVs as reviewed in Basso and Bonetto, 2016. The observation of alpha synuclein, prion protein, amyloid protein precursor, Superoxide dismutase 1 (SOD1) in EVs made them unusually attractive as a source of biomarkers.
Similarly, nearly all proteins linked to ALS have been detected in EVs derived from cell-conditioned media (14). In 2013, we found that astrocytes derived from transgenic mice expressing SOD1 with glycine 93 to alanine mutation (G93A) released more EVs in the culture media than controls (15). These EVs contained SOD1G93A and induced selective motor neuron death in an astrocytes-spinal neuron co-culture paradigm. More recently, TDP-43, FUS, and SOD1 have also been found in EVs isolated from ALS patients’ biological fluids (16). Because EVs are released by damaged cells in the central nervous system (CNS) and transported to the periphery (17), they bring CNS information to the blood. EVs may thus represent valuable biomarkers of ALS, notably, if their size distribution, number, and cargo could differentiate ALS patients from other conditions and stratify according to the disease progression rate, e.g., fast versus slow ALS progression. However, the purification of EVs from plasma remains a challenging task in the clinical setting. There is a lack of a consensus on a gold method to isolate pure EVs in clinics (18).
We used a novel EV purification protocol, namely nickel-based isolation (NBI), which allows for optimal purification yield compared to standard purification methods (19). With NBI, we unmasked peculiar features in plasma EVs of ALS patients with a potential straightforward application in a clinical setting. Our data indicate that EVs are indeed promising biomarkers, and their parameters can be used to predict the disease and the type of progression.
Materials and Methods
Participants and clinical characterization
The study was approved by the Ethical Committees of all the Centers involved in the study, Salvatore Maugeri Foundation IRCCS, Milan; NEuroMuscular Omnicentre (NEMO), Milan; Casa Cura Policlinico, Milan; and ‘Rita Levi Montalcini’ Department of Neuroscience, Università degli Studi di Torino, Turin; and written informed consent was obtained from all participating subjects. In this study we included 60 ALS patients and 56 controls (21 healthy subjects, 20 muscular dystrophies, 15 SBMA). The main demographic and clinical characteristics of the subjects are described in Table 1. ALS patients were divided into two groups according to the disease progression rate defined by the median of ΔALSFRS-R score (48 minus the ALSFRS-R score at sampling divided by the disease duration from onset to sampling): slow/intermediate-ALS with ΔALSFRS-R < 0.96 (slow-ALS) and fast-ALS with ΔALSFRS-R > 0.96. All cases were sporadic, and DNA was available from 54 of 60 ALS patients and screened for SOD1, C9orf72, TDP-43, and FUS gene mutations. Two patients carried C9orf72 GGGGCC-repeat expansions mutations. All blood draws were performed within 18 months from onset of the disease.
Animal model
Mice were maintained at a temperature of 21±1 °C with a relative humidity of 55%±10% and 12 hours of light. Food (standard pellets) and water were supplied ad libitum. All the procedures involving animals and their care carried out at the Mario Negri Institute for SOD1G93A mice and at the CIBIO University of Trento for TDP-43Q331K mice were conducted as described by the institutional guidelines that are in accordance with national (D.L. no. 116, G.U. suppl. 40, February 18, 1992, no. 8, G.U., 14 luglio 1994) and international laws and policies (EEC Council Directive 86/609, OJ L 358, December 12,1987; National Institutes of Health Guide for the Care and Use of Laboratory Animals, US National Research Council, 1996). The mice were bred in conventional mouse facilities free of specific pathogens.
The SOD1G93A mouse line on a homogeneous 129S2/SvHsd background derives from the B6SJL-TgNSOD-1-SOD1G93A-1Gur line originally obtained from The Jackson Laboratory (Bar Harbor, ME, USA), which expresses about 20 copies of mutant human SOD1G93A (20). The use of the SOD1G93A mice has been authorized in the protocol n° 657/2018-PR.
Prp-TDP-43Q331K transgenic line 103 mice (stock 17033) have expression of a myc-tagged, human TAR DNA binding protein carrying the ALS-linked Q331K mutation (huTDP-43Q331K) directed to brain and spinal cord by the mouse prion protein promoter on the C57BL/6NJ background. The expression of the protein is 1.5 time compared to the endogenous TDP-43 (21). The use of the Prp-TDP-43Q331K mice has been authorized in the protocol n° 603/2017-PR.
Mice were deeply anesthetized with ketamine hydrochloride (IMALGENE, 100 mg/kg; AlcyonItalia) and medetomidine hydrochloride (DOMITOR, 1 mg/kg; Alcyon Italia) by intraperitoneal injection and blood was drawn by avulsion of the eyeball and further centrifuged to isolate plasma, as described in ‘Blood sampling’. SOD1G93A female mice were analyzed at 10 and 16 weeks of age (controls=10; SOD1G93A 10 weeks=5; SOD1G93A 16 weeks=5), corresponding to the pre-symptomatic and symptomatic stage of disease. Male TDP-43Q331K mice were analyzed at 10 months, corresponding to the symptomatic stage of the disease (controls=8; TDP-43Q331K 10 months=8)(21).
The corresponding age-matched nontransgenic mice were used as controls for both SOD1G93A and TDP-43Q331K mice. Genotyping for SOD1G93A and TDP-43Q331K was done by standard PCR using primer sets designed by The Jackson Laboratory. The number of animals has been calculated based on set up experiments to reach a power of 0.8 and a minimum difference of 20% (α=0.05).
Blood sampling
Samples of peripheral venous blood from patients and controls were collected in EDTA pre-coated vials (BD Vacutainer K2EDTA). Blood was centrifuged at 3000 x g for 20 minutes to isolate plasma samples. For animal models, blood was collected in EDTA pre-coated vials and centrifuged at 3000 x g for 10 minutes to isolate plasma samples.
EV isolation
Ultracentrifugation (UC)
Plasma samples were diluted with equal volume of PBS and subjected to DC to remove cells, dead cells and cellular debris (10 min at 200 x g, 10 min at 1000 x g and 25 min at 20.000 x g at 4° C) (rotor type JA 25.50), as already reported (15). The final supernatant was then ultracentrifuged for 1 hour at 100.000 x g (rotor type 70i) at 4° C to pellet EVs. The pellet was washed twice by suspension in PBS and ultracentrifugation for 1 hour at 100.000 x g at 4° C to eliminate contaminating proteins.
Nickel-based isolation (NBI)
Human and mouse plasma were centrifuged to remove cells, dead cells and cellular debris (10 min at 2800 × g at RT) and the supernatant diluted in filtered PBS one and ten times, respectively. The diluted plasma was incubated with 25 μl/ml of activated charged agarose beads as reported (22) and placed in orbital shaking for 30 min. The beads and the bond EVs were centrifuged (5 min at 1000 x g at RT) and the supernatant was discarded. The elution buffer (22) (100 μl/ml) was added on the beads and incubated in a Thermomixer (10 min at 750 rpm at 28 °C). The beads were pelleted (1 min at 600-800 × g at RT) and the supernatant contained the eluted EV.
Transmission electron microscopy (TEM)
5 μl drop of isolated EVs in PBS were placed to dry at room temperature for 30 min on a 100 mesh formvar/carbon coated copper grid (EMS, Hatfield, PA, USA) and fixed with 4% paraformaldehyde and 2 % glutaraldehyde in 0.12 M phosphate buffer (pH 7.4) for 30 min. Subsequently, EVs were postfixed in OsO4 1% in 0,12 M cacodylate buffer (pH 7.4) for 30 min and then counterstained with uranyl acetate (oversatured solution) for 15 min. After dehydration by graduated scale of ethanols the grids were embedded in LR White and observed with an Energy Filter Transmission Electron Microscope (EFTEM, ZEISS LIBRA® 120) equipped with YAG scintillator slow scan CCD camera.
Nanotracking analysis (NTA)
NTA was carried out to reveal the size distribution and concentration of isolated EVs using a NanoSight NS300 (equipped with a sCMOS camera and 532 nm diode laser; Malvern scientific). Data were acquired and processed by two operators throughout the study, using NTA software version 3.00, based on the manufacture’s recommendations. Before starting with the analysis, samples were centrifuged at 10,000 xg for 5 min to remove remaining beads. Subsequently, human and mouse samples were diluted in filtered PBS respectively 100 and 50 times, to maintain 20–40 particles per field of view and 5 × 60 s videos recorded (at camera level 11-12); for analysis, at least 1,000 completed tracks were required per measurement. Analyses were always carried out at the same settings (detection limit 3). Moreover, to evaluate the quality of the analysis, for each sample we considered the ratio between the total particles tracks and the valid particles tracks. The analysis was considered valid when the ratio was less than 5. The quantification of EVs is described throughout per ml. NTA analysis was also used to provide the mean and the mode with 95% CI. The D10, D50 and D90, which are the size point below which 10%-50%-90% of the particles analyzed are contained, were also considered.
We stratified EV populations in small and big EVs on the basis of a cut-off at 130 nm, which is the D50 median value of all the samples analyzed in the study. For each sample a distribution curve with the row data of NTA was generated and set with the same x (from −2.0E+06 to 1.6E+07 n. of particles/ml) and y (from 0 to 400 nm) axis, and the same size (39.38 cm × 30.43 cm). The relative abundance of small versus big EVs was calculated from the area under the curve (AUC) of the size distribution curve, below and above the 130 nm cut-off. The AUC was measured by ImageJ software (23).
The sample extraction was randomized both for human and mouse plasma. The operators were blind during the analysis with NTA.
Tunable resistive pulse sensing (TRPS)
TRSP measurements were performed with a gold qNano instrument (Izon Ltd) mounting a polyurethane nanopore membrane NP200 (analysis range 85–500 nm) and NP400 (analysis range 185-1100nm) (Izon Ltd). Electrolyte solution was made of filtered PBS with the Primo Syringe Filters 30 mm-PES membrane- 0.22 μm.
Zeta potential
Z–potential measurements were performed at 25 °C with a Zeta Sizer instrument (Nano-ZS, Malvern Instruments). Samples were introduced in DTS1070 capillary cells (Malvern Panalytical) with the diffusion barrier technique, while data were analyzed with the Zetasizer Software. Phase Analysis Light Scattering (PALS) was used to determine the average zeta potential of vesicles dispersed in PBS. A fast measurement process (fast field reversal mode: FFR) was selected, because of the high ionic strength of the dispersing media (PBS). Size measurements were also performed both before and after the zeta potential measurements to check the sample had not changed because of the measurement.
EV-like liposomes
EV-like liposomes were prepared from a mixture composed of 20% mol egg phosphatidylcholine, 10% mol egg phosphatidylethanolamine, 15% mol dioleoylphosphatidylserine, 15% mol egg sphingomyelin, 40% mol cholesterol (adapted from (24,25)). All phospholipids were acquired from Avanti Polar Lipids. Lipid films were formed by removing the organic solvent (i.e. chloroform) from a lipid solution by rotary evaporation and vacuum drying for at least 30 min. Lipids at a final concentration of 1 mg/mL, were swollen in PBS and vortexed vigorously to give multilamellar liposomes, which were further exposed to 6 cycles of freezing and thawing. EV-like liposomes were obtained by extruding the suspension of multilamellar liposomes with a two-syringes extruder (LiposoFast Basic Unit, Avestin Inc.). Thirty-one passages were performed through two stacked polycarbonate filters (Millipore) with pores of 50 or 100 nm nominal average diameters. Finally, size and Z-potential of EV-like liposomes were measured with a Zeta Sizer instrument (Nano-ZS, Malvern Instruments).
Proteomics
Three aliquots (0.5 ml) of a pool of plasma samples from six healthy subjects were isolated independently by both UC (samples #1UC, #2UC, #3UC) and NBI (samples #1NBI, #2NBI, #3NBI) methods. EV proteins were extracted using RIPA buffer (150 mM NaCl, 1.0% Triton, 0.5% sodium deoxycholate, 0.1% SDS, 50 mM Tris, pH 8.0). Equal amount of proteins (9 μg) for each sample was separated by 1D 4-12% Nupage Novex Bis Tris Gel (Invitrogen), stained with Bio-Safe coomassie (Bio-Rad Laboratories) and digested with trypsin by using a published procedure (Brunelli et al., 2012). 2 μl of each samples were analysed on a Biobasic 18 column (150 × 0.18mm ID, particle size 5 μm, Thermo Scientific) coupled with an Q-Exactive (Thermo Scientific) via a DESI Omni Spray (Prosolia) used in nanospray mode. Peptides were eluted with a 240 min gradient of 5%–60% buffer B (80% ACN) at a flow rate of 2 μl/min. The Q-Exactive was operated in a data dependent mode with a survey scan range of 400-2000 m/z and a resolution of 70’000 in parallel with low-resolution MS/MS scans of the twenty most abundant precursor ions with a charge ≥ 2. Dynamic exclusion of sequenced peptides was set to 15 s to reduce the number of repeated sequences. Data were acquired using the Xcalibur software (Thermo Scientific). MaxQuant software (version 1.6.2.3) was used to analyze MS raw files (26). MS/MS spectra were searched against the human Uniprot FASTA database (Version 2016) and a common contaminants database (247 entries) by the Andromeda search engine (27). Cysteine carbamidomethylation was applied as fixed and methionine oxidation as variable modification. Enzyme specificity was set to trypsin with a maximum of two missed cleavages and a minimum peptide length of 7 amino acids. A false discovery rate (FDR) of 1% was required for peptides and proteins. Peptide identification was performed with an allowed initial precursor mass deviation of up to 7 ppm and an allowed fragment mass deviation of 20 ppm. Protein identification required at least 1 unique peptide. A minimum ratio count of 1 was required for valid quantification events via MaxQuant’s Label Free Quantification algorithm (MaxLFQ) (Cox and Mann, 2008). Data were filtered for common contaminants and peptides only identified by side modification were excluded from further analysis. Bioinformatic analysis was performed in the Perseus software environment (28). Protein abundance changes were computed on LFQ peak intensities. Statistical analysis was done by non-parametric Wilcoxon-Mann-Whitney test, using p-value < 0.05 as cut-off (JMP Pro13 statistical software) Functional enrichment analysis was performed via STRING (https://string-db.org/), using the Gene ID of the identified proteins. The whole mass spectrometry proteomics data have been deposited to the ProteomeXchange Consortium (http://proteomecentral.proteomexchange.org/cgi/GetDataset) via the PRIDE partner repository with the data set identifier PXD020629. All other data supporting the findings of this publication are available within the article and its supplemental information files.
Protein extraction for EVs
Proteins from EVs isolated by NBI were precipitated with three volumes of acetone for 2h at 4 °C in agitation, and finally centrifuged at 9,000 × g for 5 min at 4 °C. Pellets were suspended in 1% boiling SDS and analyzed by Western analyses. The pellet of EVs isolated by UC were suspended in 1% boiling SDS and analyzed. Proteins were quantified by the BCA protein assay (Pierce).
Antibodies
Antibodies for immunoblot (Western) were as follows: mouse monoclonal anti-cytochrome C (1:500 dilution; BD Biosciences; RRID: AB_396417); mouse monoclonal anti-calnexin (1:1000 dilution; Abcam; RRID: AB_11178981); rabbit monoclonal anti-syntenin (1:2500 dilution; Abcam; RRID: AB_11160262); rabbit monoclonal anti-GM130 (1:2500 dilution; Abcam; RRID:AB_880266); rabbit monoclonal anti-CD81 (1:1000 dilution; Cell Signaling; RRID: AB_2714207); mouse monoclonal anti-flotillin-1 (1:500 dilution; BD Transduction Laboratories; RRID: AB_398139); rabbit polyclonal anti-peptidyl-prolyl cis-trans isomerase A (PPIA) (1:5000 dilution; Proteintech; RRID: AB_2237516); rabbit polyclonal anti-HSP90 (1:1000; Enzo Life Sciences; RRID: AB_2039287); rabbit polyclonal anti-TDP-43 (1:2500 dilution; Proteintech; RRID: AB_2200505); rabbit polyclonal anti-TDP-43 (1:2500 dilution; Proteintech; RRID: AB_615042); mouse monoclonal anti-human phospho Ser409/410 TDP-43 antibody (pTDP-43) (1:2000, Cosmo Bio Co., LTD; RRID: AB_1961900); goat anti-mouse or anti-rabbit peroxidase-conjugated secondary antibodies (respectively 1:20000 and 1:10000, GE Healthcare).
Western blot (WB)
For WB, human and mouse samples (40 μg) were separated in 12% SDS-polyacrylamide gels and transferred to polyvinylidene difluoride membranes (Millipore). For protein characterization of human EVs, to minimize inter-assay variability, each blot was loaded to hold 1 healthy control, 3 ALS patients, 1 muscular dystrophy and 1 spinal bulbar muscular atrophy control, with a total of 20 blots for each protein. For mouse EVs protein analysis, to minimize inter-assay variability, each blot was loaded to hold a SOD1G93A sample at 10 and 16 weeks of age with the respective controls and a TDP-43Q331K sample with relative control, with a total of 6 blots for each protein. In addition, for both human and mouse EVs the respective internal standard (IS) was used for all the blots to favor inter-assay analysis. IS is a pool of human or mouse plasma EV samples. To minimize intra-assay variability, both human and mouse aliquots of samples were prepared the same day for all the proteins analyzed and samples were alternately loaded in the blot. WB membranes were blocked with 3% (w/v) BSA (Sigma-Aldrich) and 0.1% (v/v) Tween 20 in Tris-buffered saline, pH 7.5, and incubated with primary antibodies and then with peroxidase-conjugated secondary antibodies. Blots were developed with Luminata™ Forte Western Chemiluminescent HRP Substrate (Millipore) on the ChemiDoc™ Imaging System (Bio-Rad). Densitometry was done with Image Lab software 6.0. Immunoreactivity was normalized to the Red Ponceau staining (Fluka) and to the immunosignal of the IS of each membrane. Data are expressed as arbitrary units (A.U.). For phosphorylated TDP-43, censored data were substituted with L/√2, where L is the lowest value detected in all samples analyzed.
ELISA pNf-H
The level of pNf-H in human plasma was measured by ELISA kit for the human protein (EUROIMMUN #EQ-6561-9601) following manufacturer’s instructions. Censored data were substituted with L/√2, where L is the limit of detection of the assay.
Machine learning
Model training, internal validation and testing were performed on the NTA curve distributions and on the collected data on phosphorylated TDP-43, HSP90 and PPIA values for all the EV plasma analyzed. We used Python 3.7.4 downloaded at https://www.python.org/downloads/release/python-374/ running in a Windows 10 PC x64, with Intel(R) Core(TM) i5-4200M CPU with 2.5 GHz and 4 GB of RAM. To write this Python code we used PyCharm version 2019.2, an IDE (Integrated Development Environment) developed by JetBrains https://www.jetbrains.com/pycharm/download/other.html. We embedded some Scikit-learn tools into our software. Scikit-learn (https://scikit-learn.org/stable/) is a Python open source library that embeds simple and efficient tools for predictive data analysis and machine learning. We also developed a specific software library for the analysis of the NTA curve distributions (https://github.com/tety94/rbfn, tag v1.0.0).
Distribution Curve Compression
As a preliminary step, we normalized all the distribution curves (Supplementary Fig. 2F). Then we used machine learning tools to compress the signal. More specifically, we considered a distribution curve as a set of noisy samples picked from an unknown function, and we approximated it by a fixed number of Radial Basis Functions (RBFs) (29). We used 30 RBFs in the experiments. An example of an approximated curve is reported in Supplementary Fig. 2G. The reconstructed curve fits very well the original one. Since the coefficients related to the RBF model represent an implicit description of the approximated signal, we used them as the set of features that map the curve into a smaller dimensional space (30).
Data Preprocessing
Due to the limited number of samples and the presence of imbalanced classes, we built learning machines with original and oversampled data and compared their performances. We used a synthetic oversampling algorithm called MWMOTE (31) and a specific procedure to avoid overoptimistic predictions, similar to the one proposed in (32). When dealing with the dataset that includes the biomarkers, we had missing data. We hence replaced missing data with the feature average value when needed.
Classification models
The distribution curve features were used to feed a trained learning machine to discriminate ALS patients from others. Since our dataset consists of input-output samples, we used a supervised training approach in the analysis. Supervised learning techniques are indeed specific algorithms that train a predictor using data that consist of inputs paired with the correct outputs. In particular, we used Random Forests to build up our classification models. To compare ALS with the other diseases (HC, MD and SBMA), we used binary classification models. We also split ALS patients into two groups according to the disease progression rate (fast vs slow ALS) and built up classification models based on those data. In addition to the distribution curve features, we included specific biomarkers to check if there is any improvement in the performance of the classifiers. More specifically, we built models to compare ALS with one of the other classes based on plasma EV size distribution, HSP90 and phosphorylated TDP-43 amount. While we used EV size distribution, PPIA and phosphorylated TDP-43 amount to discriminate between fast and slow ALS.
K-fold cross validation
Cross validation is a resampling procedure used to evaluate machine learning models on limited data samples. The k refers to the number of groups that a given data sample is to be split into. In our tests, k = 5. A k-fold cross validation strategy was used to assess the performances of the different learning machines used in the classification (33). We chose a stratified algorithm; in this way the generated folds preserve the percentage of samples for each class.
Classification accuracy of prediction models
In order to evaluate the performances of our prediction models, we used two different measures, that is Precision (i.e., the fraction of relevant instances among the retrieved instances) and Recall (i.e., the fraction of the relevant instances that were actually retrieved). Precision-Recall curves were plotted to display performances of the different classifiers. Those curves show the tradeoff between precision and recall for different thresholds. Our target/positive class in the experiments is represented by ALS patients.
Statistical analyses
Different EV parameters were compared between ALS patients, DM, SBMA and HC, using the Kruskall-Wallis test. For the parameters showing a statistically significant (p<0.05) difference in the distribution among the 4 categories, pairwise comparisons were performed using the Wilcoxon-Mann-Whitney test, in order to identify the specific categories showing the difference. Pairwise comparisons were limited only to comparisons involving ALS patients (ALS versus DM, ALS versus SBMA, ALS versus HC). Significant and differentially expressed EV parameters between fast and slow progressing ALS patients were selected by performing Student’s t test, using p value < 0.05 as cut off. The same analyses were performed to compare the EV parameters in the two isolation procedures NBI and UC.
Data availability
All the data generated for this manuscript are available upon requests to the corresponding authors.
Results
High-yield isolation of intact, pure and polydisperse plasma EVs by NBI
To test whether ALS plasma EVs could be exploited as biomarkers of disease diagnosis and progression, we looked for EV isolation methods that could be fast, reproducible, and pure. We isolated plasma EVs by NBI, an innovative procedure that exploits the net charge of membrane vesicles in a physiological solution (19) (Fig. 1A) in a short turn-around time (<1 hour) compared to other methods (2-20 hours) (Van Deun et al., 2014). EVs were characterized according to the guidelines of the International Society of Extracellular Vesicles (Lotvall et al., 2014; Witwer et al., 2017). In particular, EV samples were analyzed by immunoblotting for the presence of three positive markers (flotillin-1, syntenin, and CD81) and the absence of three negative markers (GM130, calnexin, and cytochrome C). All positive markers were enriched in EV samples compared to EV-depleted plasma, while negative markers were not present (Fig. 1B). Isolation of EVs was confirmed by TEM that detected mostly round-shaped membrane particles in the 23-150 nm size range (Fig. 1C), and by the tunable resistive pulse sensing (TRPS) that analyzed concentration and diameter of the particles (Supplementary Fig. 1C-F). The size of EVs was heterogeneous, confirming that NBI purifies polydisperse particles (19).
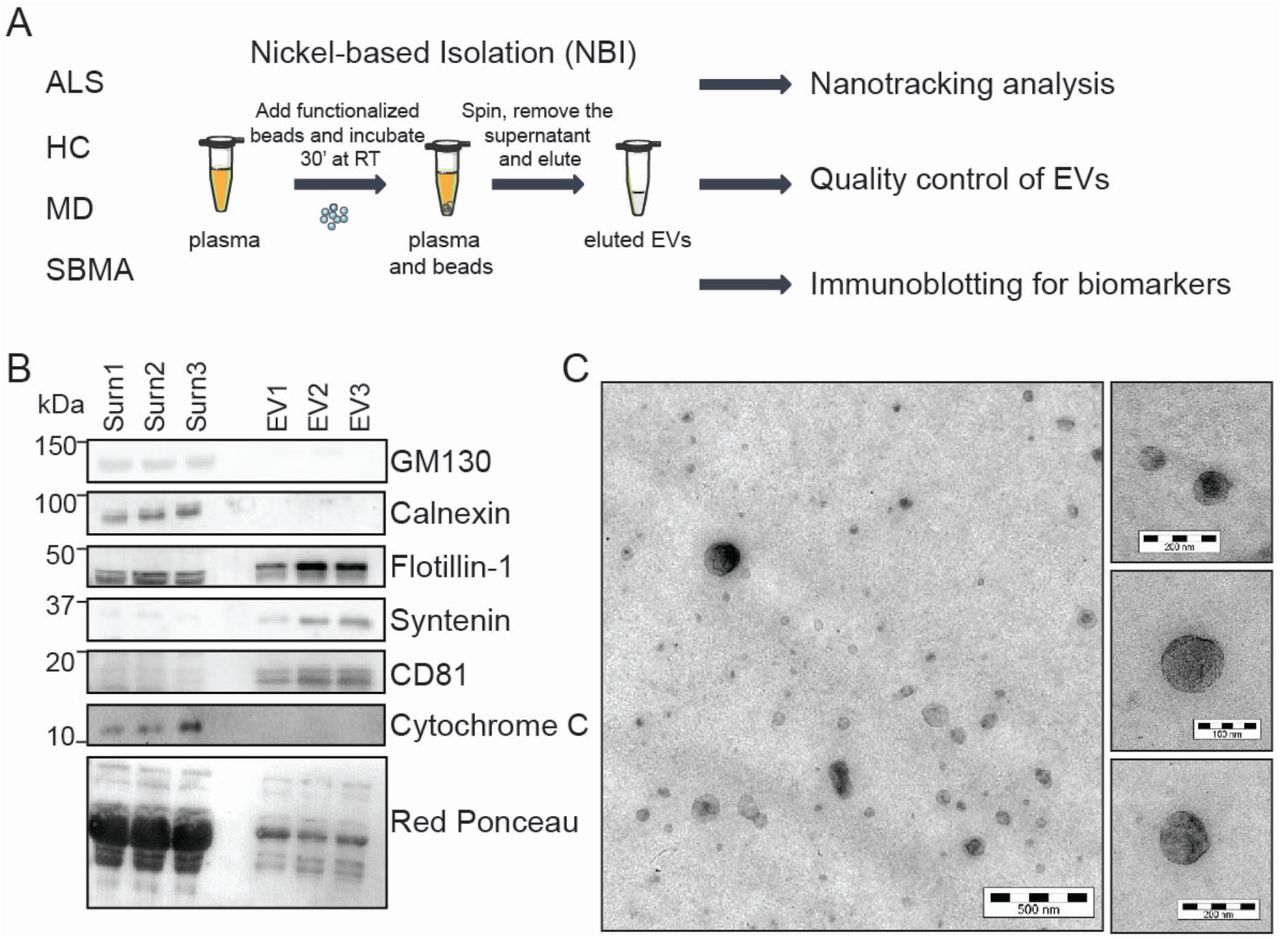
A) Schematics of the purification strategy and validation. B) Immunoblot for flotillin-1, synthenin, CD81 (markers of EVs) and GM130, calnexin and cytochrome C (contaminants of EVs) in plasma EV samples (EV1, EV2, EV3) isolated by NBI, and EV-depleted plasma (Surn1, Surn2, Surn3). Loading control represented by the Red Ponceau. C) Transmission electron microscopy (TEM) analysis of the plasma EV purified with NBI. Shown is one representative image from three independent experiments. Bar, 500 nm in the main panel; 200 nm, 100 nm, 200 nm in the insets from top to bottom.
We evaluated the performance of NBI in comparison with ultracentrifugation (UC), which is one of the most widely used methods to isolate EVs with relatively high yield and purity (Gardiner et al., 2016; Van Deun et al., 2014). For these experiments, we used an equal volume of plasma samples from fifteen subjects with ALS processed by both methods in parallel (Supplementary Fig. 1A-G). We evaluated the amount of particles/ml with the TRPS revealing that NBI recovered 4-fold and 1.5-fold more particles than UC when small and big vesicles were measured, respectively (NP200 revealed 5.1E+09 ± 6.3E+08 versus 1.2E+09 ± 1.5E+08 particles/ml; NP400 detected 8.8E+07 ± 1.2E+07 versus 5.7E+07 ± 1.1E+07) (Supplementary Fig. 1C-D). To estimate the level of protein contamination, we calculated the particles to μg of proteins ratio, and we observed that NBI showed a significantly higher value (123.2 ± 9.9 versus 51.8 ± 6.5), which is indicative of a lower level of protein contamination (Supplementary Fig. 1G) (Webber and Clayton, 2013). EVs isolated by NBI had on average a smaller diameter than those isolated by UC (NP200 recorded 82.4 nM ± 1.7 versus 100.6 nM± 1.6; NP400 registered 210.5 nM ± 3.8 versus 275.5 nM± 7.4) (Supplementary Fig. 1E-F). This could be due to a higher yield in the recovery of small vesicles by NBI and to a higher propensity for centrifugation-based procedures to cause vesicle coalescence and aggregation, as also reported by others (Nordin et al., 2015).
To test our hypothesis, we generated liposomes with an EV-like lipidic composition (EV-like liposomes), and we diluted 1.0E+10 particles/ml in one ml of EV-depleted plasma. We run three independent experiments in which we purified EV-like liposomes either by NBI or UC.
We quantified the amount and size of each replicate by TRPS. As shown in Supplementary Fig. 1H-I, the EV-like liposomes purified with NBI showed a similar size-distribution curve among replicates (CV=8.9%), not observed when the EV-like liposomes were purified by UC (CV=32.6%). The average mean and mode diameter was also smaller when the NBI was used compared to UC (the mean and mode diameter for NBI were 140 ± 11 and 102 ± 4 respectively, while the mean and mode diameter for UC were 175 ± 7 and 129 ± 0.2, respectively). In agreement with this, TEM detected particles in a higher size range (37-232 nm) in samples isolated by UC (Supplementary Fig. 1A-B)
To assess whether NBI was enriching for EVs, we performed label-free proteomic profiling, and we compared NBI and UC isolated EVs. We identified 107 proteins, among which 60 overlapped (~56% of the total) between NBI and UC samples (Supplementary Table 1 and Supplementary Fig. 1J). In both purification strategies, about 70% of identified proteins were annotated as extracellular vesicle components (GO cellular component, Supplemental Table 2). Twenty-four proteins were differentially enriched either in NBI or UC (p<0.05, Wilcoxon-Mann-Whitney test). Interestingly, seven out of the twenty-four differentially enriched proteins were apolipoproteins, that were enriched in UC. Lipoprotein particles are very abundant in blood and biophysically very similar to EVs; therefore they co-isolate by standard isolation procedures, and they are considered contaminants in the EV analysis (Yuana et al., 2014; Sódar et al., 2016; Simonsen, 2017). Specifically, we detected twelve apolipoproteins in the UC-EVs, while only Apo-AI, Apo-AII, and Apo B-100 in the NBI-EVs, whose presence was, however, significantly reduced compared to UC-EVs (Table 2). Overall, the NBI method resulted in an 86% reduction in apolipoprotein content, indicating that it minimizes the lipoprotein particle co-isolation issue. Heat shock cognate 71 kDa protein (HSC70) and Heat shock protein HSP 90-alpha (HSP90A), two EV luminal markers, were, instead, significantly higher in NBI-EVs confirming that NBI enriches for rather pure EVs (Supplementary Table 1).
We conclude that NBI is a fast, high-yield procedure to isolate highly pure, polydisperse circulating EVs with preserved biochemical and biophysical properties. Therefore, we implemented this procedure to isolate EVs from the plasma of our cohort of ALS patients and controls to identify possible biomarkers of disease.
The peculiar size distribution of polydisperse plasma EVs in ALS patients
Once we set up the purification protocol with NBI, we isolated EVs from the plasma of a cohort of sixty ALS patients and fifty-six control subjects (Table 1), healthy controls (HC) (n=21) and disease controls (n= 35): patients with muscular dystrophies (MD) (n=20) that generally do not imply nerve damage, and patients with SBMA, an ALS-mimic motor neuron disease (n=15). First, we investigated whether ALS patients could be distinguished from controls based on EV concentration and diameter. We calculated the zeta potential of EVs, which is the measure of the net charge of EVs membranes and transmembrane proteins, and we did not observe a significant difference among the groups (values between −7.8 and −9.8 mV; Supplementary Fig. 2A). To detect the EV number and size distribution, we took advantage of a clinically transferable nanotracking analysis (Nanosight, Malvern). We analyzed the size distribution of plasma EVs within the 50-300 nm range in ALS patients and controls (Fig. 2A). HC presented two peaks (blue line) that are not preserved in all three diseases analyzed (ALS, MD, and SBMA). The average curve of the SBMA patients revealed a higher peak in the distribution (green line), while the ALS and MD showed similar distribution.

A) Representative average curve on size distribution of ALS, HC, MD and SBMA. B) Box-plots representing the number of particles per ml (n. of particles/ml) of plasma EV in the four different groups; ALS, HC, MD, SBMA; one-way ANOVA, p=0.96. C) Box-plots showing the number of particles per ml below 130 nm; one-way ANOVA, p=0.029. D) Box-plots reporting the mean diameter (calculated in nm) of EVs in the four groups; one-way ANOVA, p=0.0028; post-hoc Wilcoxon-Mann-Whitney: *p=0.011 for ALS versus MD; *p=0.043 for ALS versus SBMA. ALS = amyotrophic lateral sclerosis plasma EVs; HC = healthy control plasma EVs; MD = muscle dystrophy plasma EVs; SBMA = spinal and bulbar muscular atrophy plasma EVs.A
By looking at the total amount of particles per ml, we did not observe a significant difference in EVs among the four groups, with an average amount comprised between 1.4E+10 and 1.7E+10 particles/ml (Fig. 2B). We wondered whether the number of small vesicles could distinguish the different groups. We considered the median value of all the samples analyzed (130 nm) as the cut-off between the smaller and bigger populations. We found that the number of particles/ml below a cut off of 130 nm was significantly different among the four groups with the samples from the two motor neuron diseases, ALS and SBMA, registering the highest number of EVs (3.0E+04 ± 3.2E+03 and 4.6E+04 ± 9.2E+03, respectively) (Fig. 2C). Finally, we compared the sizes of EVs and surprisingly observed that MD EVs had the highest mean diameter that is significantly different from those of the two motor neuron diseases (ALS EVs and SBMA EVs mean diameter is respectively 149 ± 3 nm and 135 ± 3 nm versus MD EVs mean diameter that is 173 ± 10 nm) (Fig. 2D). The D10, D50, and D90 are also higher in MD compared to ALS and SBMA (Supplementary Fig. 2C-D-E). Of note, ALS mean diameter, D10, D50 and D90 of ALS EVs were significantly bigger than SBMA EVs, showing that SBMA EVs were the smallest among the different tested conditions (Fig. 2D). A similar trend was also observed for the mode diameter (Supplementary Fig. 2B).
The distinctive size distribution of polydisperse plasma EVs in two ALS mouse models
To test whether the changes in size and amount observed in ALS plasma EVs were recapitulated in experimental models, we analyzed the plasma-derived EVs purified from two transgenic ALS mouse models expressing either SOD1G93A (Marino et al., 2015) or TDP-43Q331K (Arnold et al., 2013). SOD1G93A mice show early symptoms at ten weeks of age, and they become symptomatic with loss of body weight, muscular weakness, and motor impairment at sixteen weeks. TDP-43Q331K mice present a 30% loss of L5 motor axons and 30-45% loss of lower motor neurons by ten months of age. We analyzed the number of particles per ml and the mean diameter in control and transgenic mice at different ages. As shown in Fig. 3A and C, the number of particles significantly increased of 1.7-fold in symptomatic mice either expressing SOD1G93A or TDP-43Q331K, suggesting a similar alteration of EV production or in the rate of elimination in both genetic models and sporadic patients. Interestingly, a tendency to an increase in particle number is observed already at a presymptomatic stage of the disease (Fig. 3A). The mean diameter was also reduced in ALS mouse models with a decrease of 11% in symptomatic SOD1G93A mice and 14% in the TDP-43Q331K mice (Fig. 3B and D), further confirming a possible association of this parameter with motor neuron degeneration and denervation.

A) Box-plot representing the number of particles per ml in plasma of SOD1G93A mice at 10 and 16 weeks, compared to controls. One-way ANOVA, p=0.029; Wilcoxon-Mann-Whitney post hoc, *p=0.040 between SOD1G93A 16 weeks and controls (controls=10; SOD1G93A 10 weeks=5; SOD1G93A 16 weeks=5). B) Box-plot showing the mean diameter of plasma EVs of SOD1G93A EVs at 10 and 16 weeks compared to controls. No statistically significant differences were noted. C) Box-plot representing the number of particles per ml in plasma of TDP-43Q331K mice at 10 months compared to controls. Student t-test, **p=0.006, (controls=8; TDP-43Q331K=8) D) Box-plot showing the mean diameter of plasma EVs of TDP-43Q331K EVs at 10 months compared to controls. Student t-test, *p=0.039.
Together, these results suggest that the amount of the particles along with the mean size of ALS EVs in two in vivo models of the pathology and in patients are parameters that can be used to differentially diagnose ALS from other conditions, possibly already at an early stage of the disease.
Analysis of a panel of EV-associated proteins in ALS patients and mouse models
To determine whether specific proteins, previously associated with ALS, are differentially enriched in plasma-derived EVs of ALS patients compared to the other groups, we set up the immunoblotting for three candidate proteins: human and mouse HSP90, cyclophilin A, also known as peptidylprolyl isomerase A (PPIA), and TDP-43 or phosphorylated TDP-43 (Supplementary Fig. 3 and 4).
HSP90 is a highly abundant and ubiquitous molecular chaperone that supports protein folding. In ALS, it has been detected in protein inclusions in SOD1G93A mice and sporadic patients (Basso et al., 2009), with a consequent decrease in the soluble fraction, and it was also unusually low in ALS patients and mouse model with early disease onset and a severe phenotype (Filareti et al., 2017). It is also known to be present in EVs, but its levels have never been analyzed in plasma-derived EVs of ALS patients. Interestingly, HSP90 is significantly less present (30% decrease) in the plasma-derived EVs of ALS patients compared to HC and SBMA (Fig. 4A). HSP90 is also decreased in plasma-derived EVs of symptomatic SOD1G93A (40% loss) and TDP-43Q331K (73% decrease) mice (Fig. 4E-F), suggesting that low levels of HSP90 in plasma EVs characterize all forms of ALS, sporadic and genetic, independently from the specific gene mutation.
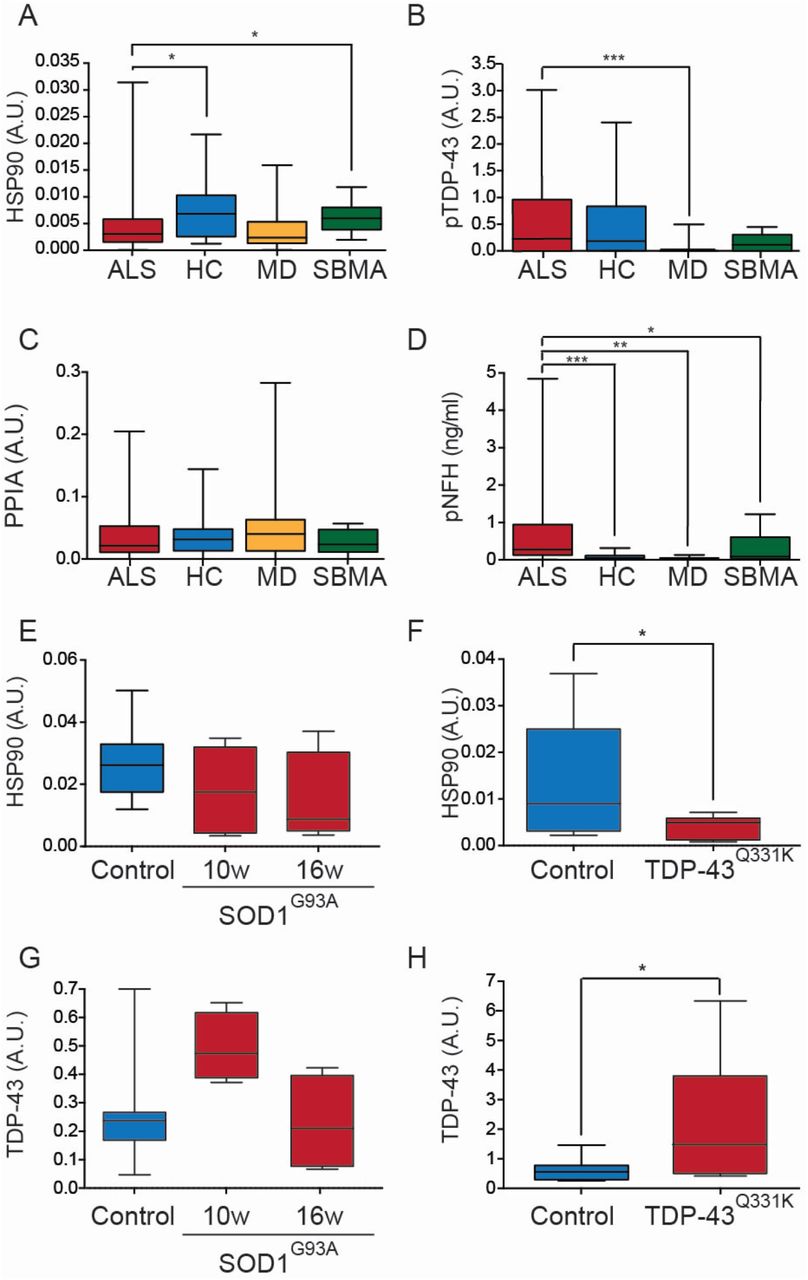
A) Box-plot reporting the levels of HSP90 in the plasma EVs of ALS, HC, MD and SBMA. One-way ANOVA, p=0.008; Wilcoxon-Mann-Whitney post hoc, *p=0.016 ALS versus HC; *=0.035 ALS versus SBMA. B) Box-plot presenting the levels of phosphorylated TDP-43 (pTDP-43) in the plasma EVs of ALS, HC, MD and SBMA.One-way ANOVA, p=0.0006; Wilcoxon-Mann-Whitney post hoc, ***p=0.0004 ALS versus MD. C) Box-plot showing the levels of PPIA in the plasma EVs of ALS, HC, MD and SBMA. One-way ANOVA, p=0.66. D) Plasma levels of phosphorylated neurofilament H (pNFH) in ALS, HC, MD and SBMA. One-way ANOVA, p=0.0002; Wilcoxon-Mann-Whitney post hoc, ***p=0.0009 ALS versus HC, **p=0.0033 ALS versus MD; *p=0.0469 ALS versus SBMA. E) Box-plot reporting the levels of HSP90 in the SOD1G93A plasma EVs at 10 and 16 weeks of age compared to controls. One-way ANOVA, p=0.295. F) Box-plot showing the levels of HSP90 in the TDP-43Q331K plasma EVs at 10 months of age compared to controls. Student t-test, *p=0.037. G) Box-plots reporting the levels of TDP-43 in the SOD1G93A plasma EVs at 10 and 16 weeks of age compared to controls. One-way ANOVA, p=0.105. H) Box-plots revealing the levels of TDP-43 in the TDP-43Q331K plasma EVs at 10 months of age compared to controls. Student t-test, *p=0.020. A.U. stands for arbitrary units.
We investigated whether TDP-43, the hallmark of ALS, is detectable in plasma-derived EVs. Previous reports showed insoluble TDP-43 in plasma-derived EVs (Sproviero et al., 2018). We detected a meager amount of TDP-43 in human plasma-derived EVs, as revealed by two different antibodies directed toward the N or the C terminus of the protein, which in these conditions strongly cross-react with plasma protein contaminants, immunoglobulins, and albumin (Supplementary Fig. 4A and B). We decided to test whether the anti-phosphorylated TDP-43 antibody would be a better option to analyze TDP-43 in EVs. Surprisingly, the antibody revealed a specific and distinct doublet at 45 kDa (Supplementary Fig. 4C), and when tested in our human plasma-derived EVs, it showed a 7-fold increase in ALS samples compared to controls, which is significant versus MD (Fig. 4B). TDP-43 was variable in SOD1G93A plasma-derived EVs with an increase at ten weeks (1.9-fold increase) that was not maintained at 16 weeks of age (Fig. 4G). TDP-43 was highly accumulated (4.5-fold increase) in TDP-43Q331K plasma-derived EVs (Fig. 4H). Several TDP-43-related immunoblotting bands were observed in these EVs (Supplementary Fig. 4), indicating that post-translationally modified and truncated forms of TDP-43 are loaded in EVs of cells expressing mutant TDP-43.
We looked at PPIA, a highly abundant and ubiquitous foldase and chaperone involved in TDP-43 trafficking and function (Lauranzano et al., 2015). We have previously shown that PPIA is enriched in protein inclusions in SOD1G93A mice and patients (Basso et al., 2009). Soluble PPIA is particularly low in ALS patients compared to healthy individuals and subjects with other neurological diseases (Luotti et al., 2020). However, in contrast with HSP90, PPIA levels did not change among groups, indicating that EV-enriched PPIA may not be useful to differentially diagnose ALS from other diseases (Fig. 4C).
Finally, to better characterize our patients’ cohorts, we also measured phosphorylated neurofilament H (pNFH) plasma levels. As expected, we found that pNFH was substantially higher in ALS than in all other experimental groups, especially in fast-progressing patients (Fig. 4D-6G, Table 1). We attempted to measure pNFH in EVs, but we failed to detect a reliable signal (data not shown), suggesting that pNFH is not loaded in EVs, and purely reflects axonal damage.
We conclude that HSP90 and phosphorylated TDP-43 are differentially represented in ALS EVs than other diseases and can be used in a panel of markers to define the fingerprint of ALS plasma-derived EVs.
Evaluation of the discriminant ability of EV parameters alone and in combinations to distinguish ALS from MD, SBMA and healthy controls
To test whether the parameters that we analyzed can be used to distinguish ALS patients from other groups, we took advantage of the machine learning techniques. First, we tested whether the size distribution of plasma EVs can discriminate ALS patients from others. As a preliminary step, we normalized all the distribution curves (Supplementary Fig. 2F). Then, we used machine learning tools to compress the signal (29,30) (Supplementary Fig. 2G), and used those compressed data to build a machine learning model based on Random Forests (RF) (Roscoe et al., 2019). We evaluated the model’s ability to discriminate ALS patients from all the others (HC, MD, and SBMA). The Precision-recall curves provided the area under the curve (AUC) values ranging between 0.82 and 0.93 (Fig. 5A). We oversampled our datasets with MWMOTE (Barua et al., 2014) and observed an increased prediction ranging between 0.88 and 0.95 (Fig. 5B).
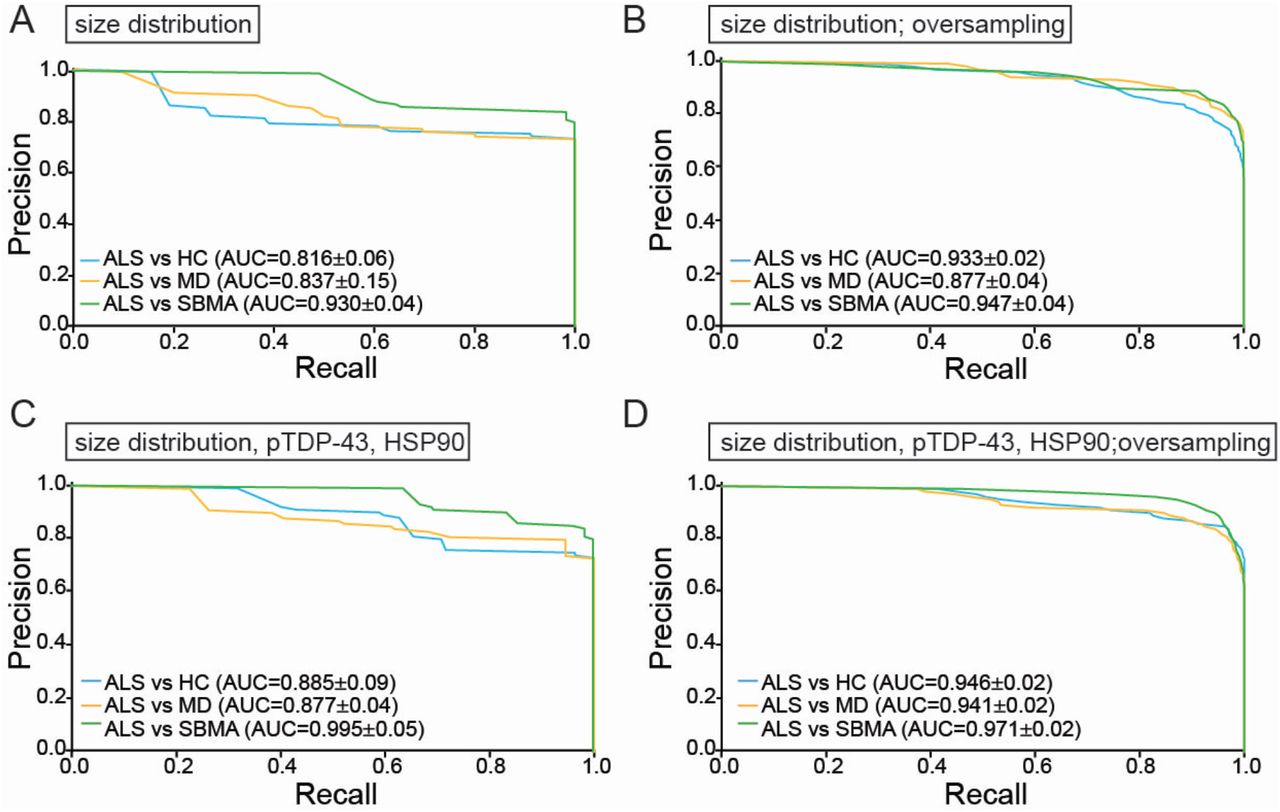
A) Precision-recall curves on size distribution for a binary comparison. B) Precision-recall curves on oversampled data on size distribution for a binary comparison. C) Precision-recall curves on size distribution, phosphorylated TDP-43 (pTDP-43), and HSP-90 for a binary comparison. D) Precision-recall curves on oversampled data on size distribution, phosphorylated TDP-43 (pTDP-43), and HSP-90 for a binary comparison.slow ALS fast ALS
We wondered whether the combination of the size distribution parameters with the values obtained for phosphorylated TDP-43 and HSP90 in the EVs could improve the disease classification. The new models showed an AUC of 0.89 for ALS versus HC, 0.88 for ALS compared to MD, and 0.99 for ALS compared to SBMA. Of note, the oversampling enhanced only the classification of ALS when tested with MD (AUC=0.94 vs. 0.88) (Fig. 5D).
The machine learning approach indicates that the size distribution of EVs can be used to classify patients and controls with a relatively high prediction. As expected, the oversampling ameliorated the AUC in all comparisons. The models combining the size distribution and the proteins cargos, i.e., HSP90 and phosphorylated TDP-43, reached excellent AUC values in particular in distinguishing ALS from SBMA.
Specific parameters like number of particles, size, p-TDP-43 and PPIA discriminate between fast and slow patients
We wondered whether the parameters that we analyzed could vary according to the rate of disease progression in ALS patients (slow-ALS and fast-ALS). The plot of the average size distribution showed a difference in the peaks (Fig. 6A).

A) Representative average curve on size distribution of slow and fast ALS. B) Data representing the number of particles per ml divided in fast and slow ALS; Student t-test, *p=0.046. C) Data reporting the number of particles per ml below 130nm divided in fast and slow ALS; Student t-test, **p=0.0016. D) Data showing the levels of HSP90 divided in fast and slow ALS; Student t-test, p=0.405. E) Data representing the levels of phosphorylated TDP-43 (pTDP-43) divided in fast and slow ALS; Student t-test, *p=0.017. F) Data showing the levels of PPIA divided in fast and slow ALS; Student t-test, *p=0.022. A.U. stands for arbitrary units. G) Plasma levels of phosphorylated neurofilament H (pNFH) in slow and fast ALS; Student t-test, p=0.09. H) Precision-recall curves on stratified data for ALS progression showing the AUC for each specific comparison.
We stratified the data on EV particles/ml, the particles sized below 130 nm, HSP90, phosphorylated TDP-43, and PPIA. The stratification revealed that slow-ALS patients have a significantly 1.3-fold increase in EV particles/ml than fast-ALS, indicating that average EV concentration could be a selective biomarker of slow-ALS (Fig. 6B). This was also confirmed when particles sized below 130 nm were analyzed (1.5-fold increase) (Fig. 6C). We then decided to test whether HSP90, phosphorylated TDP-43, and PPIA could be differentially enriched in slow-ALS versus fast-ALS plasma-derived EVs. HSP90 did not show any difference, suggesting that its protein level is a useful marker for distinguishing ALS from other diseases, but does not change according to the ALS rate of progression (Fig. 6D). Phosphorylated TDP-43 showed a 2-fold increase in fast-ALS EVs, confirming that in plasma-derived EVs, the phosphorylated TDP-43 levels correlate with greater damage (Fig. 6E). Finally, while PPIA did not change across different diseases (Fig. 4C), it showed a 41% decrease in fast-ALS compared to slow-ALS, confirming our previous data where we observed that patients with a lower amount of PPIA present an earlier onset and a faster progression of the disease (Filareti et al., 2017; Luotti et al., 2020) (Fig. 6F). Interestingly, fast-progressing patients had a high pNFH plasma level but not significantly different from slow-progressing patients, indicating that at least in our cohort of patients, pNFH cannot differentiate between the fast and slow progression of the disease (Fig. 6G).
We built a new mathematical model with the stratified data according to the ALS rate of progression for size distribution, phosphorylated TDP-43, and PPIA. We oversampled the data and observed that the AUC for fast and slow ALS ranged between 0.95 and 0.96, suggesting that these three parameters could be exploited for a correct ALS prognosis (Fig. 6H).
Discussion
Several approaches have been reported to successfully purify EVs from plasma, like ultracentrifugation, filtration, precipitation, chromatography, immunocapture, microfluidics, but there is still no consensus on which techniques provide the best results (Ayala-Mar et al., 2019). In the clinical setting, fast, reproducible, easy protocols are preferred. Here we showed that the use of NBI, a recently established purification method requiring fast and simple procedures, allows the recovery of a higher number of plasma-derived EVs than UC, which is the most commonly used isolation method for EV purification (Gardiner et al., 2016). Plasma EVs are contaminated by the highly abundant plasma proteins, especially lipoproteins (HDL, LDL, VLDL, and chylomicrons), which are much more abundant than EVs and biophysically very similar in terms of density and size (Simonsen, 2017), affecting substantially downstream analysis. Combined isolation approaches are generally used to guarantee the purity of EVs, but the continuous sample’s manipulation may compromise EVs’ integrity and their biophysical features (Karimi et al., 2018). Here we report that EVs purified with NBI had minimal contamination of lipoproteins, offering a new strategy for plasma EV purification and analysis. We also showed that EV-like liposomes retained their mean and mode diameter when isolated with NBI, while their size increased when the particles underwent UC. It is probably essential to use a technique that preserves EV integrity, minimizing EV aggregation (Notarangelo et al., 2019). This observation strengthens the differences we observed in terms of mean diameter, mode, D10, D50, and D90 between ALS and MD samples.
We did not different plasma-EV subpopulations, so we can only speculate that a different proportion of EV subclasses, deriving from different organs or cell populations, may be present in ALS samples compared to the other conditions, resulting in a decrease in mean diameter and an increase in particles amount in human and mouse plasma EVs. Furthermore, the actual EV size depends not only on the type of membrane phospholipids but also on the presence or absence of particular membrane proteins (Margolis and Sadovsky, 2019). EVs are highly heterogeneous in molecular composition, and their surface proteins bear characteristics of their tissues of origin (Wu et al., 2019), suggesting that in each pathological condition, plasma EVs released from the damaged tissue may have a specific size distribution. For example, brain-derived EVs in plasma have been already reported in Alzheimer’s disease patients up to ten years before the onset of the disease (Goetzl et al., 2015) even if a specific characterization of their mean size has not been analyzed yet. Similarly, muscle-derived EVs have been studied for their contribution to MD (Rome et al., 2019), but no direct comparison between brain and muscle degenerative condition has been provided yet in terms of their specific contribution to plasma EVs. Here we show that the EVs in ALS are substantially different from MD patients. SBMA is a neuromuscular disease with early muscle degeneration and motor neuron loss. Interestingly, it presents EV features that are similar to ALS EVs but not wholly different from the MD.
Another crucial aspect of EVs is the proteomic and genomic material present in the lumen. EVs have been considered as means of intercellular disease spreading both in cancer and in neurodegenerative diseases where they have been shown to contribute to the formation of metastasis and the seeding of protein inclusions, respectively (Asai et al., 2015; Becker et al., 2016). Proteins directly involved in ALS, like TDP-43, SOD1, FUS and the dipeptide repeat proteins derived from C9orf72 aberrant repeats were detected in EVs derived from in vitro and in vivo models, but a functional role in the disease spreading in vivo has not been provided yet (Basso et al., 2013a; Feiler et al., 2015; Iguchi et al., 2016; Kamelgarn et al., 2016; Westergard et al., 2016; Ferrara et al., 2018). Nevertheless, insoluble mutant proteins were observed in plasma-derived microvesicles of ALS patients suggesting that ALS-associated proteins may be detected in plasma-derived EVs (Sproviero et al., 2018). In our work, we report that phosphorylated TDP-43 is present in EVs, and its levels are significantly higher in ALS compared to MD. Furthermore, phosphorylated TDP-43 is accumulated in fast progressor ALS patients, reflecting the fact that a more severe progression of the disease corresponds to increased accumulation of phosphorylated TDP-43 in several cells and tissues of the body, including muscles, and as a consequence, in the EVs that these cells and tissues release in the bloodstream (Mori et al., 2019).
TDP-43 analyses in biofluids are not reliable due to the lack of highly sensitive methods, especially for the phosphorylated form (37). Quite surprisingly, we detected a clear-cut signal for phosphorylated TDP-43 in plasma EVs using a phosphorylation-dependent antibody that stains pathological ubiquitin-positive inclusions in ALS and frontotemporal lobar degeneration (FTLD) patients (38). In our analysis, the signal for the phosphoprotein was high also when TDP-43 was hardly detected by two pan antibodies, suggesting that there is a selective loading of hyperphosphorylated TDP-43 in EVs and that phosphorylation may be an EV sorting signal for the cells. Indeed, a significant and selective enrichment in phospho-tau relative to total CSF tau in EVs isolated from CSF of Alzheimer’s disease patients has been detected (39). Thus, EVs are a promising source of pathological TDP-43 in the patients during the lifetime, as already suggested by Feneberg et al. that detected TDP-43 by mass spectrometry in EVs from CSF of ALS and FTLD patients (40). Validation studies in CSF EVs and comparative studies with plasma EVs using our methodological approach are now planned.
HSP90, one of the most critical molecular chaperones of the protein quality control complex (Moran Luengo et al., 2019), is significantly decreased in ALS EVs in the patients and two genetic ALS mouse models. This is in agreement with our previous findings, where we showed that HSP90 is entrapped in insoluble proteins in the spinal cord of sporadic patients and late symptomatic SOD1G93A mice (Basso et al., 2009). We also observed decreased levels of HSP90 in SOD1G93A astrocytes (Basso et al., 2013b) and PBMCs, along with ALS sporadic patients (Filareti et al., 2017), suggesting that HSP90 could be measured in plasma-derived EVs to distinguish ALS patients from other conditions involving motor neurons like SBMA.
Interestingly, the levels of PPIA did not change across diseases, but there was a significant decrease in fast-ALS compared to slow progressors. PPIA, also known as cyclophilin A, is a multifunctional protein with foldase and molecular chaperone activities and is one of the most commonly identified proteins in EVs (Basso and Bonetto, 2016). PPIA is also an interacting partner of TDP-43 and regulates its trafficking and function (Lauranzano et al., 2015). Previous studies indicated that PPIA is significantly enriched in the insoluble fraction of spinal cords of ALS patients and mice (Basso et al., 2009), and its soluble form is reduced in PBMC of sporadic ALS patients (Filareti et al., 2017). Therefore, it is not surprising that, in fast-ALS, in a severe condition associated with diffuse TDP-43 pathology, PPIA is less present in EVs, possibly stacked intracellularly while contrasting protein aggregation. We have recently shown that low PPIA soluble levels in ALS PBMC were associated with six months earlier death (Luotti et al., 2020), indicating that EVs reflect pathological intracellular alterations and supporting the relevance of plasma-derived EVs as promising predictors of ALS disease progression.
Neurofilaments are generally increased in acute and chronic neurodegenerative conditions (Gaetani et al., 2019). They are released into the biofluids as the final event that leads to the degeneration of motor neurons. Their levels correlate well with the severity of the axonal degeneration, presenting a lower increase in motor neuron diseases with a milder phenotype like SBMA (Lombardi et al., 2020). Regardless of their lack of specificity, they are considered the best biomarkers to diagnose and predict ALS progression (Lu et al., 2015; Verde et al., 2019). We measured pNFH in the plasma of all our samples and confirmed a significant increase in ALS compared to all the other diseases and HC, confirming its value as a diagnostic biomarker. However, when we stratified our samples, while EV concentration and size, PPIA, HSP90, and phosphorylated TDP-43 significantly discriminate fast- and slow-ALS, pNFH did not. There was only a trend towards increasing of pNFH in fast ALS, indicating that plasma pNFH is not a robust prognostic biomarker. This has been very recently confirmed in a large longitudinal study in which, in contrast with neurofilament light, pNFH has shown little prognostic value (Benatar et al., 2020). We did not detect neurofilaments in EVs, further confirming that plasma neurofilaments principally reflect axonal damage and are not players in spreading the disease.
Machine Learning models offer unprecedented opportunities to evaluate the potentiality of specific targets as biomarkers, even with considerable sample size limitations. Machine learning techniques have already been applied to ALS clinical and imaging data sets and resulted in promising diagnosis and prognosis models (Grollemund et al., 2019). They have been exploited for ALS progression and survival ranking (41-43), the prediction of the outcome of specific treatments (e.g., riluzole) based on the patient characteristics (44), and the use of candidate proteins’ amount in the CSF as pharmacodynamics biomarkers (45,46). Here we describe the first model built on EV biophysical parameters that shows a great potentiality in differential diagnosis of ALS compared to MD and SBMA. We also report that including the amount of plasma EVs HSP90, phosphorylated TDP-43, and PPIA, in the mathematical model increases the prediction power. ALS is clinically, genetically, and neuropathologically highly heterogeneous, and this makes it difficult to understand the mechanisms at the basis of the disease and develop effective therapies (47). We show that our mathematical model is promising also in classifying patients with variable disease progression confirming the considerable potentiality of machine learning techniques in the patient stratification that could improve clinical trial design toward the development of personalized therapies (48).
In conclusion, the EV biophysical parameters and the protein cargos can be exploited for ALS diagnosis and prediction. The combination of EV size distribution and protein levels, such as phosphorylated TDP-43 and HSP90, further ameliorated the AUC of the prediction-recall curves, encouraging further validations. The analytical procedure that has been here set up is suitable for large and complex clinical studies in which multiple outcomes are measured since up to 500 μl of plasma per subject is necessary to perform the downstream analysis of the EV features here described.
Data Availability
Data availability All the data generated for this manuscript are available upon requests to the corresponding authors. Proteomics The whole mass spectrometry proteomics data have been deposited to the ProteomeXchange Consortium (http://proteomecentral.proteomexchange.org/cgi/GetDataset) via the PRIDE partner repository with the data set identifier PXD020629
Funding
This project has received funding from the European Union’s Horizon 2020 research and innovation programme under the Marie Sklodowska-Curie grant agreement No 752470 (to M.B.); by grants from the Italian Ministry of Health (GR-2016-02361552 to M.B.), from Intesa San Paolo S.p.A., project no. B/2018/0061 (to V.B.), INnovazione, nuovi modelli TEcnologici e Reti per curare la SLA - ID 1157625 (Regione Lombardia “BANDO Call HUB Ricerca e Innovazione”) to V.B., M.C., M.Ch. The study has received funding by the Italian Ministry of Education, University and Research (Progetti di Ricerca di Rilevante Interesse Nazionale, PRIN, grant 2017SNW5MB) (to A.Ch.), the Joint Programme - Neurodegenerative Disease Research (Strength and Brain-Mend projects), granted by Italian Ministry of Education, University and Research (to A.Ch.). This study was performed under the Department of Excellence grant of the Italian Ministry of Education, University and Research to the ‘Rita Levi Montalcini’ Department of Neuroscience, University of Turin, Italy.
Competing interests
VDA and AQ declare competing interests for the patent application of the NBI procedure (WO2019122003).
- Abbreviations
- (EV)
- Extracellular vesicles
- (ALS)
- Amyotrophic Lateral Sclerosis
- (NBI)
- Nickel-based isolation
- (TEM)
- Transmission electron microscopy
- (NTA)
- Nanotracking analysis
- (TRPS)
- Tunable resistive pulse sensing
- (HSP90)
- Heat shock protein-90
- (HC)
- Healthy controls
- (SBMA)
- Spinal and bulbar muscle atrophy
- (MD)
- Muscular dystrophies
- (pNFH)
- phosphorylated neurofilament H
- (SOD1)
- Superoxide dismutase 1
Acknowledgements
We would like to thank Francesca Baldelli Bombelli for the initial discussion on sample analysis. We are grateful to Cinzia Bertolin for collecting the SBMA plasma.
Footnotes
Correct list of authors online
References


