
Abstract
Background Several parameters driving the transmission of severe acute respiratory syndrome coronavirus 2 (SARS-CoV-2) remain unclear, including age-specific differences in infectivity and susceptibility, and the contribution of inapparent infections to transmission. Robust estimates of key time-to-event distributions remain scarce as well.
Methods We collected individual records for 1,178 SARS-CoV-2 infected individuals and their 15,648 contacts identified by contact tracing and monitoring over the period from January 13 to April 02, 2020 in Hunan Province, China. We provide descriptive statistics of the characteristics of cases and their close contacts; we fitted distributions to time-to-key-events distributions and infectiousness profile over time; and we used generalized linear mixed model to estimate risk factors for susceptibility and transmissibility of SARS-CoV-2.
Results We estimated the mean serial interval at 5.5 days (95%CI −5.0, 19.9) and the mean generation time at 5.5 days (95%CI 1.7, 11.6). The infectiousness was estimated to peak 1.8 days before symptom onset, with 95% of transmission events occurring between 7.6 days before and 7.3 days after the date of symptom onset. The proportion of pre-symptomatic transmission was estimated to be 62.5%. We estimated that at least 3.5% of cases were generated asymptomatic individuals. SARS-CoV-2 transmissibility was not significantly different between working-age adults (15-59 years old) and other age groups (0-14 years old: p-value=0.16; 60 years and over: p-value=0.33), whilst susceptibility to SARS-CoV-2 infection was estimated to increase with age (p-value=0.03). In addition, transmission risk was higher for household contacts (p-value<0.001), decreased for higher generations within a cluster (second generation: odds ratio=0.13, p-value<0.001; generations 3-4: odds ratio=0.05, p-value<0.001, relative to generation 1), and decreased for infectors with a larger number of contacts (p-value=0.04).
Interpretation Our findings warn of the possible relevant contribution of children to SARS-CoV-2 transmission. When lockdown interventions are in place, we found that odds of transmission are highest in the household setting but, with the relaxation of interventions, other settings (including schools) could bear a higher risk of transmission. Moreover, the estimated relevant fraction of pre-symptomatic and asymptomatic transmission highlight the importance of large-scale testing, contact tracing activities, and the use of personnel protective equipment during the COVID-19 pandemic.
Introduction
The outbreak of coronavirus disease 2019 (COVID-19) started in December 2009 in Wuhan, China 1. The outbreak, caused by the SARS-CoV-2 virus, quickly spread globally, leading WHO to declare a pandemic on March 11, 20202. Despite more than 18.4 million SARS-CoV-2 infected individuals confirmed worldwide as of August 06, 20203, there are still many unknowns in the epidemiology and natural history of COVID-19.
A key question under debate is whether the infectivity of individuals with, and susceptibility to, SARS-CoV-2 infection differs by age. In particular, the role of children in SARS-CoV-2 transmission has yet to be fully understood. Schools were closed in the early months of the pandemic in most countries 4,5 so that the low proportion of cases notified in young individuals 6 could be attributed to a low probability of developing symptoms 7,8, a low susceptibility to infection 9-11, and/or few contact opportunities relative to other age groups. The importance of each of these factors has been difficult thus far to disentangle. A related question is the probability of asymptomatic transmission from young individuals. In fact, it is often argued that the COVID-19 pandemic has been difficult to tackle because of the importance of pre-symptomatic and asymptomatic transmission. Evidence from confined settings such households, homeless shelters, and nursing facilities, supports the role of pre-symptomatic and asymptomatic transmission 10,12-16. Yet, a quantification of the contribution of asymptomatic and pre-symptomatic transmission in large populations is still lacking.
A full understanding of SARS-CoV-2 transmission patterns and risk factors is crucial to plan targeted COVID-19 responses, especially as countries relax costly lockdown policies and move towards case-based interventions (e.g., case isolation, quarantine of contacts, contact tracing). To define the temporal characteristics of the response strategies (e.g., duration of the quarantine and isolation period, definition of contacts to be traced) it is crucial to understand the age profile of infectiousness and to have robust estimates of key time-to-event distributions such as the generation time. These distributions were estimated in the early days of the pandemic based on the very first few clusters of cases and are thus subject to high uncertainty and variability between different studies 1,15,17 It is important to update these estimates using large-scale and harmonized epidemiological datasets.
In this study, we analyze 1,178 SARS-CoV-2 infected individuals and their 15,648 contacts identified by contact tracing operations carried out in the Hunan Province of China over the period from January 13-April 02, 2020. This comprehensive and detailed dataset compiled by the Hunan Provincial CDC sheds light on SARS-CoV-2 transmission patterns, risk factors, and the distribution of key time-to-event parameters.
Methods
COVID-19 surveillance system, field epidemiological investigations, and contact tracing
In response to the COVID-19 outbreak, in late December 2019, the Chinese Center for Disease Control and Prevention (China CDC) launched a new surveillance system for COVID-19 cases. A description of the surveillance system is reported elsewhere 1. On January 21, 2020, the first COVID-19 case was confirmed in Hunan Province. Since then, active field epidemiological investigations of suspected or confirmed SARS-CoV-2 infections as well as their contacts have been initiated.
The definition of suspected and confirmed COVID-19 cases (i.e., symptomatic individuals), as well as subjects with asymptomatic SARS-CoV-2 infections (i.e., asymptomatic subjects) was based on the New Coronavirus Pneumonia Prevention and Control Program published by the National Health Commission (NHC) of China and the World Health Organization (WHO) 18. A suspected COVID-19 case was defined as a person who met one or more clinical criteria and had an epidemiological link to SARS-CoV-2 positive individuals or history of travel to/from regions reporting widespread SARS-CoV-2 transmission (Appendix p2). A confirmed COVID-19 case was defined as a suspected case with positive real-time RT-PCR results, while an asymptomatic subject was defined as an individual with laboratory confirmation of SARS-CoV-2 infection, but without any clinical symptom (e.g., no fever or cough). Confirmed COVID-19 cases were categorized by clinical severity, including mild, moderate, severe and critical illnesses (as defined in Appendix, Tab. S1).
Once a suspected or confirmed COVID-19 case was identified, a field epidemiology investigation was undertaken by the local CDC. Data were collected on demographic characteristics, clinical symptoms, and activity patterns starting 14 days before symptom onset and until confirmation or isolation in the hospital. All cases detected between January 16 and April 02, 2020 were interviewed using a standardized questionnaire. In addition, each individual with suspected or confirmed SARS-CoV-2 infection was asked to provide a list of locations she/he visited (e.g., workplace, health-care facilities) and her/his contacts. On the basis of this list, active contact tracing was then initiated by the investigation team. Screening interviews, checking of travel records based on public security cameras and traffic system, and digital health records were also collected to assess whether an individual met the definition of close contact. Once a close contact was identified and traced, she/he was quarantined at a designated place (e.g., hotel room) or at home and followed up for 14 days 18. Close contacts were interviewed using a standardized form before they were quarantined. The form comprised basic demographic information (e.g., age and sex), and detailed a record of the timing, frequency, and type of exposures to the case(s) who triggered the investigation.
Specimen collection and laboratory testing
Upper respiratory specimens (nasopharyngeal and oropharyngeal swabs) were collected from all suspected cases as well as their close contacts. Before February 7, 2020 specimens were collected for testing from each close contact if she/he developed symptoms during quarantine period. After February 7, 2020, specimens were collected at least once during quarantine, regardless of symptoms. After January 27, the designated hospitals and local CDCs were approved to conduct real-time RT-PCR assay for diagnosis of COVID-19 using a standardized laboratory testing procedure according to the “Novel coronavirus pneumonia Diagnosis and Treatment Program” released by NHC of China. The assays were performed in laboratory equipped with BSL-2 facilities (Appendix p3-4).
Close contacts, sporadic cases, and clusters
Close contacts were defined as individuals who had close-proximity interactions (within 1 meter) with clinically suspected and laboratory-confirmed SARS-CoV-2 cases, for the period from 2 days before, to 14 days after, the potential infector’s symptom onset. For those exposed to asymptomatic subjects, the contact period was from 2 days before, to 14 days after, a respiratory sample was taken for real-time RT-PCR testing. Close contacts included, but were not limited to, household contacts (i.e., household members regularly living with the case), relatives (i.e., family members who had close contacts with the case but did not live with the case), social contacts (i.e., a work colleague or classmate), and other close contacts (i.e., caregivers and patients in the same ward, persons sharing a vehicle, and those providing a service in public places, such as restaurants or movie theatres).
A cluster of SARS-CoV-2 infections was defined as a group of two or more confirmed cases or asymptomatic subjects with an epidemiologic link (Appendix p3). Epidemiologically linked cases were classified according to the generation time of SARS-CoV-2 transmission and the setting where exposure took place, with primary cases considered as first generation. A sporadic case was defined as a confirmed case of SARS-CoV-2 infection (either symptomatic or asymptomatic) who did not belong to any of the reported clusters.
We define pre-symptomatic transmission as a direct transmission event that takes place before the date of symptom onset of the infector, while asymptomatic transmission is a transmission event from a person who never developed symptoms.
Ethical approval statement
This study was approved by the ethic committee of the Hunan CDC with a waiver of informed consent due to a public health outbreak investigation (IRB No. 2020005).
Role of the funding source
The funders had no role in the design and conduct of the study; collection, management, analysis, and interpretation of the data; preparation, review, or approval of the manuscript; and decision to submit the manuscript for publication.
Statistical analysis
We provide descriptive statistics of the characteristics of cases and their close contacts, including demographic factors and exposures (Appendix p5-p7). We estimated the incubation period (i.e., the time delay from infection to illness onset), the serial interval (i.e., the time interval between the onset of symptoms in a primary case and in her/his secondary cases), the generation time (i.e., the time interval between infection of the primary case and of her/his secondary cases), and the infectiousness profile (i.e., the daily distribution of the probability of transmission since the date of symptom onset; see 15,19 and Appendix p7-p10 for methods). We also estimated the interval from symptom onset to the sampling date of first PCR by using a maximum likelihood estimator and fitting three distributions (Weibull, gamma, and lognormal) (Appendix p10). The goodness of fit was assessed using Akaike information criterion (AIC). We restrict the estimation of incubation period to 268 locally acquired infections with information on both the date(s) of exposure and generation of SARS-CoV-2 transmission in the cluster.
We rely on the contact tracing data to describe the age-specific contact matrices for SARS-CoV-2 infectors and their contacts (Appendix p11). Additionally, generalized linear mixed-effects model, GLMM, for binary data with logit link were built to quantify the effects of potential drivers of susceptibility and infectivity of the SARS-CoV-2 virus (i.e., odds ratio and marginal effect), based on 8,159 individual records of contacts who were exposed to locally transmitted cases (see appendix p11-12). These risk factors include age and gender of infectors/contacts, type of contact, generation of SARS-CoV-2 transmission in a cluster, as well as the number of contacts of an infector. Statistical analyses were performed using the R software, version 3.5.0.
Results
Sample description
Between January 23, 2020 and April 02, 2020, 1,019 symptomatic cases and 159 asymptomatic subjects were reported and screened for inclusion (Fig. S1 and Tab. 1). Through active contacts tracing, a total of 15,648 close contacts were identified, of whom 471 contacts were positive for SARS-CoV-2 infection. Among 1,178 SARS-CoV-2 infections, we identified 831 epidemiologically linked cases in 210 clusters. Of these clusters, 499 SARS-CoV-2 infections in 123 clusters had a clear epidemiological link to a previous SARS-CoV-2 infected individual. From 15,648 close contacts, 6,412 were identified by forward contact tracing and resulted in the identification of 285 symptomatic cases and 63 asymptomatic SARS-CoV-2 positive subjects. The remaining 9,236 close contacts were identified through backward contact tracing. The distribution of the cases and close contacts in time and space is presented in Fig. 1 and Fig. S2. Overall, the median age of symptomatic cases and asymptomatic subjects, and their close contacts were 45 (IQR: 34-55), 36 (IQR: 19-52) and 40 (IQR: 27-52) years, respectively (Tab. 1). Cases aged 0-19 years presented milder or no clinical symptoms, while patients aged 40 years and older had more severe illness (P<0.001).

(A) Daily number of new SARS-CoV-2 infected individuals (date of symptom onset) by source of infection. (B) Geographical distribution of SARS-CoV-2 infected individuals in Hunan Province, and geo-locations of Hubei and Hunan provinces. (C) Geographical distribution of SARS-CoV-2 clusters. (F) Geographical distribution of sporadic and clustered individuals with SARS-CoV-2 infections. (E) Geographical distribution of SARS-CoV-2 symptomatic and asymptomatic infected individuals by source of infection. (F) Geographical distribution of close contacts of SARS-CoV-2 symptomatic and asymptomatic infected individuals. (G) Age distribution of SARS-CoV-2 symptomatic and asymptomatic infected individuals.
Time-to-key-event distributions
We analyzed 268 locally-acquired confirmed cases belonging to 114 clusters, with information on both the date(s) of exposure and transmission generation in the cluster. We found that the best fitting distribution of incubation period was a Weibull distribution with a mean of 6.4 days (95% CI: 0.7, 16.6 days) (Tab. S3). We performed a sensitivity analysis excluding cases having only exposure end date (17 individuals) and we obtained similar estimates (Appendix, Tab. S3). Symptom onset dates were available for 245 transmission pairs; the resulting serial interval was estimated to have a mean of 5.5 days (95%CI: −5.0, 19.9 days) and a median of 4.8 days, based on a fitted gamma distribution. By considering only pairs with a single identified infector, we find that 14.0 % (31/221) of the empirical serial intervals were negative. The mean time interval from symptom onset to the sampling date of first PCR was estimated to be 4.7 days (95% CI: −2.9, 14.7 days) using the best fitting gamma distribution, based on 531 PCR positive individuals. The generation time was estimated to be 5.5 days (95% CI: 1.7, 11.6 days). The estimated distributions of the incubation period and of the generation time show stark similarities (Fig. 2B).
Pre-symptomatic transmission
Infectiousness was estimated to peak 1.8 days before symptom onset (Fig. 2A). We estimated the proportion of pre-symptomatic transmission (area under the curve, Fig. 2A) at 62.5%, with 95% of transmission events occurring between −7.6 days and 7.3 days of the date of symptom onset, under the intensive contact tracing and isolation strategy undertaken by the Hunan Province. From the analysis of the transmission chains reconstructed by field investigations, 43 pre-symptomatic transmission events were recorded in 23 clusters. A subset of those clusters is shown in Fig. 3A.

(A) Estimated distribution of the serial interval and of the infectiousness profile by gamma distributions. (B) Estimated distribution of the incubation period by Weibull distributions and of the generation time by gamma distributions.

(A) Transmission chain in 8 randomly selected clusters with pre-symptomatic SARS-CoV-2 transmission. (B) Transmission chain in all the clusters showing evidence of asymptomatic SARS-CoV-2 transmission. Square symbols indicate symptomatic cases and circular symbols indicate asymptomatic subjects. Age, sex and generation in a cluster are shown for each SARS-CoV-2 infected individual (left panels), with information on date of illness onset for symptomatic cases and date of diagnosis to the first RT-PCR positive for asymptomatic subjects. Timeline of events (right panels).
Asymptomatic transmission
From the analysis of contact tracing records, we identified 8 clusters with evidence of asymptomatic transmission. There were 11 asymptomatic infectors (5 primary and 6 secondary infections) associated with 15 of 25 local transmission events (10 secondary and 5 tertiary, Fig. 3B).
SARS-CoV-2 risk factors
We first explored differences in the age of SARS-CoV-2 infectors and infectees through the construction of age-specific transmission matrices (Fig. S4). The results suggest that people aged 15-59 years generated a larger mean number of cases than younger (0-14 years old) and older (60+ years old) individuals. Moreover, individuals over 60 years were infected more often, suggesting increased susceptibility. Next, to account for the possible effect of multiple confounding factors on the probability of transmission, we performed a multivariate regression analysis. We found that the age of the contact, the contact setting, and the generation of the infector in a cluster were important risk factors for transmission (Tab. 2). Infectiousness was not significantly different between working-age adults (15-59 years old) and other age groups (0-14 years old: p-value=0.162; 60 years and over: p-value=0.332]); in contrast, susceptibility to SARS-CoV-2 infection increased with age (p-value=0.028, Model 2 in Tab. 2). Further, household contacts were associated with a significantly larger risk of SARS-CoV-2 infection than other types of contact. The GLMM model suggests two other statistically significant risk factors: the generation in the transmission chain and the number of contacts identified for an infector (Tab. 2). In particular, the transmission risk in the first generation was significantly higher than the later generations, possibly due to improved case isolation and contacts quarantine that deplete the number of susceptible individuals in the cluster. We also found a slight but significant decrease in transmission risk from cases who reported more contacts. The inclusion of other potential risk factors, such as the gender of infectors/contacts and clinical severity of an infector were not statistically significant, did not modify the estimated odds ratios for the other variables, and did not improve the fit of the model (Tab. S6, Tab. S7, and Fig. S5). In particular, this analysis indicates no statistically significant difference in transmissibility between symptomatic and asymptomatic individuals.
Discussion
This analysis of SARS-CoV-2 transmission patterns and risk factors in Hunan, China, is based on the largest contact tracing dataset considered thus far. We found no difference in infectiousness by age, while susceptibility to SARS-CoV-2 infection increased with age. We provide evidence of both pre-symptomatic and asymptomatic SARS-CoV-2 transmission, with the former potentially accounting for up to 62.5% of all transmission events in this dataset. In addition, we estimate that SARS-CoV-2 transmission in households is responsible for most of secondary and tertiary infections. Further, within a cluster, individuals who were exposed to primary cases experienced a significantly higher risk of SARS-CoV-2 infection than those exposed to later cases.
The exposure history data used in this study were collected from in-depth epidemiological investigations, allowing us to provide robust estimation of several key time-to-event distributions. Previous estimates of the serial interval and incubation period were obtained from a limited number of infector-infectee pairs or from different data sources, thus suffering of large uncertainty 20,21. This may explain the large variability of the estimates, ranging from 4.0 days to 7.8 days for the serial interval 1,15,21-24 and from 4.8 days to 8.0 days for the incubation period 1,23,25-29 Our estimates fall within these intervals. Unlike the serial interval and the incubation period, only a few studies 30,31 provide estimates of the generation time, which is hard to directly infer from field investigations, as it requires knowledge of the infection date of both the infector and her/his infectees. Here, following an approach similar to He, et al 15, we estimate the mean generation time at 5.5 days, in general agreement with Ferretti, et al 31.
Previous studies show a relatively high proportion of pre-symptomatic transmission, but estimates vary significantly, ranging between 13-62% 15,31,32 Our estimate (62.5%) is on the high end of the range found in the literature. This is may be due to two main factors. First, the fraction of pre-symptomatic transmission heavily depends on the intensity of contact tracing and isolation strategy (e.g., whether cases are promptly isolated in dedicated facilities at the time of symptom onset or are isolated at home). Second, the depth of the contact tracing investigation may determine the rate of ascertainment of index cases. Our analysis suggests a key role of interventions (e.g., contact tracing and case isolation) in decreasing the risk of infection, as the risk of infection decreased with the number of the generations in the transmission chain.
We found evidence of asymptomatic transmission in several clusters, with 15 secondary cases linked to asymptomatic infectors. Other studies provide evidence of asymptomatic infection 12,32,33, but do not quantify its contribution to transmission. In our study, we cannot provide a point estimate, as a fraction of asymptomatic infections may have been missed despite extensive PCR testing performed by the Hunan CDC. In fact, testing of contacts only focused on symptomatic individuals before February 7, 2020, while all contacts were tested afterwards. Therefore, our finding cannot be used to quantitatively estimate the percentage of asymptomatic infections. However, we can provide a lower bound of the share of transmission events associated with asymptomatic infectors. We estimated this share to be at least 3.5% (15/432) of transmission events, in agreement with Chen, et al (4.5% (6/132), p=0.602) 34 and Liu, et al (2.6% (24/914), p=0.402) 35.
In agreement with previous studies, we found that the risk of infection from a household member is larger than those resulting from other contacts 10,36. This may be explained by the duration, type, and frequency of contacts between household members as well as the impact of interventions (such as household quarantine) on household contacts. Consistent with the transmissibility of H1N1pdm influenza during the 2009 pandemic in the US 37, we found that SARS-CoV-2 transmissibility decreased with the number of contacts, although the effect is small. Further studies are needed to explain this connection.
Despite the challenges of reporting a low number of infections among children and the complexity of establishing epidemiologic links between children and adults within households 23, we assessed the effects of infector and infectee demographics and other characteristics on SARS-CoV-2 susceptibility and infectivity. We found that the odds of infecting for first-generation infectors was significantly higher than the ones for the later generation infectors. Together with a small number of infectious children in the first generation, this contributed to observing a lower total number of infections generated by children (see Tab. S9). However, when accounting for all confounding factors, including the generation, we found no statistical evidence of differential transmissibility by age group (Tab. 2). Moreover, comparing with the mean of number of reported contacts (range: 18.2-22.3) before COVID-19 epidemic in China and other countries 9,38-40, the number of individual contacts of each infectious child in contact tracing was considerably lower (mean: 7.72) during the outbreak in Hunan. This implies that caution should be applied when evaluating policies that increase the number of contacts among children, such as re-opening of schools or summer camps. In addition, our findings suggest that the risk of acquiring SARS-CoV-2 infection steadily increases with age (in agreement with Zhang, et al. 9,11).
Our study is not without limitations. First, it suffers from the classic limitations of any epidemiological field investigation. Despite the longitudinal and in-depth investigation of each case and her/his contacts, we could not always accurately reconstruct the entire transmission chain and avoid recall bias in individual records. Moreover, we cannot rule out the possibility of indirect exposures (e.g., contaminated surfaces), which may affect the identification of epidemiological links. Second, our sample size did not allow us to distinguish between different time periods of the pandemic in Hunan, while controlling for all the other covariates. Changes in population awareness and reactive behavioral response to the outbreak may affect the estimates provided in this study.
In conclusion, the evidence of pre-symptomatic and asymptomatic SARS-CoV-2 transmission shown in this study underlines the key role of undetectable SARS-CoV-2 transmission that can hinder control efforts. Control measures should thus be tailored accordingly, especially contact tracing, testing, and isolation. Our findings that transmission can occur up to 7 days before symptoms onset lends support to personal precautions such as mask wearing. In addition, school reopening, and the consequent increase in the number of daily contacts among children and teenagers, is expected to increase the contribution of children to SARS-CoV-2 transmission. School outbreaks have already been reported in several occasions 5,41-43; time will tell whether schools can become a major foci of transmission in the coming months.
Data Availability
Individual-based data on 1,178 SARS-CoV-2 infected individuals and their 15,648 contacts identified by contact tracing monitoring over the period from January 13-April 02, 2020 were extracted from the notifiable infectious diseases reporting system in Hunan Province, China. Demographic characteristics, severity classification, exposure and travel history, and key clinical timelines were retrieved.
Author contributions
S. Hu, W. Wang, Y. Wang, L. Gao, and H. Yu had full access to all of the data in the study and take responsibility for the integrity of the data and the accuracy of the data analysis. L. Gao, M. Ajelli, and H. Yu were responsible for its conception and design. K. Luo, L. Ren, Q. Sun, X. Chen, G. Zeng, J. Li, L. Liang, Z. Deng, W. Zheng, M. Li, H. Yang, J. Guo, K. Wang, X. Chen, Z. Liu, H. Yan, H. Shi, Z. Chen, and Y. Zhou were responsible for the acquisition, analysis, or interpretation of data. S. Hu, W. Wang, M. Litvinova, M. Ajelli and H. Yu drafted the manuscript. K. Sun, A. Vespignani, C. Viboud, L. Gao, M. Ajelli, H. Yu made critical revision of the manuscript for important intellectual content. W. Wang, Y. Wang, M. Litvinova, and M. Ajelli did the data analysis. K. Luo, Q. Sun, G. Zeng, Z. Deng, H. Yang, Z. Liu, and K. Sun provided administrative, technical, or material support.
Conflicts of Interest Disclosures
Hongjie Yu has received research funding from Sanofi Pasteur, GlaxoSmithKline, Yichang HEC Changjiang Pharmaceutical Company, and Shanghai Roche Pharmaceutical Company. None of those research funding is related to COVID-19. All other authors report no competing interests.
Funding
National Science Fund for Distinguished Young Scholars (No. 81525023), National Science and Technology Major Project of China (No. 2017ZX10103009-005, No. 2018ZX10713001-007, No. 2018ZX10201001-010), and Hunan Provincial Innovative Construction Special Fund: Emergency response to COVID-19 outbreak (No. 2020SK3012).
Supporting information
Contents
Definitions of cases of SARS-CoV-2 infection 2
Specimen collection and laboratory testing 5
Overview of COVID-19 epidemics in Hunan Province, China 5
Characteristics of clusters of COVID-19 7
Incubation period 7
Serial interval 8
Infectiousness profile over time 9
Generation time 10
Interval from symptom onset to the sampling date of first PCR 10
Total and mean number of infections by age of infector and of infectee 11
Quantifying the impact of potential drivers on the susceptibility and infectivity of SARS-CoV-2 13
References 26
Definitions of cases of SARS-CoV-2 infection
Suspected COVID-19 cases
A suspected COVID-19 case is defined as a person who meets three clinical criteria OR two clinical criteria and one of epidemiological criteria:
Clinical criteria: i) acute respiratory illness; ii) radiographic evidence of COVID-19 viral pneumonia; iii) normal or decreased white blood cells count in the early stage of the disease and normal or decreased lymphocyte count.
Epidemiological criteria: i) history of travel to or residence in Wuhan or domestic location reporting community transmission or countries/territories/areas/overseas reporting widespread SARS-CoV-2 transmission during the 14 days prior to symptom onset; ii) contact with any confirmed cases during the 14 days prior to symptom onset; iii) cluster of contact with COVID-19 patients (nucleic acids amplification test positive) within 14 days before symptom onset or to individuals with fever and/or symptoms of respiratory infection within 14 days.
Clinical severity of COVID-19 confirmed cases
We categorized confirmed COVID-19 cases according to their clinical severity, i.e., mild, moderate, severe, and critical case-patients. The details are presented in Tab. S1.
Definitions of clinical severity of COVID-19 cases.1
Epidemiologically-linked COVID-19 cases
An individual with an epidemiologic link is a SARS-CoV-2 infected individual who has either been exposed to a symptomatic or an asymptomatic individual, or had the same exposure as the SARS-CoV-2 infected individuals. Generally, epidemiologically-linked cases include, but are not limited to SARS-CoV-2 infected individuals’ household contacts (i.e., household members regularly living with the case), relatives (i.e., family members who had close contacts with the case but did not live with the case), social contacts (i.e., a work colleague or classmate), and other close contacts (i.e., caregivers and patients in the same ward, persons sharing a vehicle, and those providing a service for the case in public places) who have been close-proximity interactions (within 1 meter) with index case-patient and have acquired SARS-CoV-2 infections.
The flowchart describing the selection criteria of the analyzed subjects is shown in Fig. S1.

Flowchart describing the COVID-19 symptomatic cases, individual with asymptomatic infections, close contacts, and clusters with human-to-human transmission.
Specimen collection and laboratory testing
Since January 27, the designated hospitals and local Centers for Diseases Prevention and Controls (CDC) were approved to conduct real-time RT-PCR assay for diagnosis of COVID-19 using uniform laboratory testing procedures established by the World Health Organization (WHO). Total RNA was extracted using automated Nucleic Acid Extraction System 9600E (Xi’an TianLong Science and Technology Co., Ltd., Xi’an, China). Real-time reverse transcription polymerase chain reaction (RT-PCR) assay for SARS-CoV-2 was performed using a SARS-CoV-2 ORF1ab/N gene detection kit (Biogerm Medical Biotechnology Co., Ltd, Shanghai, China), a product based on the recommendation of the National Institute for Viral Disease Control and Prevention, Chinese Center for Disease Control and Prevention. The open reading frame 1ab gene (ORF1ab) and nucleocapsid gene (N) were amplified and tested. Results were reported positive when both the ORF1ab gene and N gene were positive. Specimens tested as Ct-value of >=35 and <39.2 were retested for confirmation, a retest Ct-value of >=39.2 was treated as positive, otherwise negative.
Overview of COVID-19 epidemics in Hunan Province, China
Overall, the dynamics of the epidemic in Hunan followed an exponential growth before January 23, 2020, and a decrease in the number of cases after February 1, 2020 (Fig. S2). Age descriptive statistics by other covariates are shown in Fig. S3.

Epidemic curve of sporadic COVID-19 cases, individuals with asymptomatic SARS-COV-2 infections, and clustering COVID-19 cases in Hunan, China.

Age distribution of COVID-19 symptomatic cases, asymptomatic subjects as well as their close contacts. (A) Age and sex distribution of COVID-19 symptomatic cases. (B) Age distributions of travel related COVID-19 cases and locally acquired COVID-19 cases. (C) Age distributions of sporadic cases, index cases and successively transmitted cases in clusters. (D) Age distribution by clinical severity. (E) Age distribution of contacts. (F) Age distributions of COVID-19 cases by type of exposure.
Characteristics of clusters of COVID-19
Cluster size was defined as the total number of COVID-19 symptomatic cases and asymptomatic individuals in a cluster. We characterized 123 clusters with clear evidence of human-to-human transmission, which includes 499 of the COVID-19 cases presented in Tab. S2. Cluster size distribution was bimodal, with most clusters were between 2 and 4 cases (94/123, corresponding to 76.4%). The largest cluster included 20 cases. The median cluster size was 3 (Tab. S2).
Characteristics of cluster with human-to-human transmission COVID-19 identified in Hunan province, China.
Incubation period
We estimated the time from infection to symptom onset (i.e., the incubation period) based on information about the likely exposure of confirmed COVID-19 cases. Exposure was ascertained for cases without a history of travel to Wuhan/Hubei. The exposure information was provided in the form of a time interval bounded by the dates of the first and last possible exposure. If the exposure start date of the case was missing or before that of the first infector, it was replaced by the exposure start date of the first infector. For the rest cases without dates of first exposure, they were imputed by the random numbers generated from a gamma distribution that best fitted the data of time intervals between the first and last exposure. We also performed a sensitivity analysis excluding these cases. We estimated the distribution of interval-censored exposure data by using maximum likelihood and compared three distributions (Weibull, gamma, and lognormal). The goodness of fit was assessed using Akaike information criterion (AIC). Results are presented in Tab. S3.
Estimates of the incubation period based on the analysis of 114 clusters and 268 cases.
Serial interval
We analyzed clusters of COVID-19 cases with known epidemiological links and no travel history to Wuhan/Hubei to estimate the interval between onset of symptoms in primary (index) cases and the onset of symptoms in secondary cases generated by these primary cases (i.e., the serial intervals). For cases with several possible infectors, a time interval bounded by the symptom-onset dates of the first and last possible infectors was provided as the symptom onset interval of primary cases. We fitted a gamma distribution of interval-censored data by maximum likelihood to estimate the serial interval distribution, using dates of symptom onsets for consecutive generations of cases within clusters. Results are shown in the main text.
Infectiousness profile over time
Following the approach similar to He, et al 2, and accounting for the correction proposed by Ashcroft, et al 3, the infectiousness profile (i.e., transmission probability from primary cases to a secondary case) was inferred using the serial intervals from confirmed transmission pairs combined with the incubation period distribution fitted in our analysis. Assuming that the infectiousness profile βc(tI − tS1) follows a gamma distribution with a time shift c to allow for start of infectiousness (tI) c days prior to the date of symptom onset (tS1). The serial intervals distribution f(tS2- tS1) would be the convolution between the infectiousness profile and incubation period distribution g(tS2-tI), where tS2 is the date when secondary case shows symptoms. The parameter vector θ, which includes shape and scale of the gamma distribution and the time shift c, were estimated using maximum likelihood based on the convolution of serial interval and incubation period. Allowing for the start of infectiousness to be around symptom onset and taking into account the window of symptom onset (tS1l, tS1u), the likelihood function was given by
The results of the estimation are presented in the main text.
Generation time
Generation time - that is the time interval between infection of the primary case (tI1) and infection of the secondary cases (tI2) generated by such primary case - was inferred using the data of incubation period combined with infectiousness profile estimated in our analysis. We considered that infected cases would show symptoms at certain time (tS) before or after onset of infectiousness. Assuming that the distribution of generation time follows a gamma distribution φ(tI2 - tI1), the observed distribution of incubation period g(tS - tI1) can be inferred as the convolution between the infectiousness profile βc(tI2- tS) and the generation time distribution. We constructed a likelihood function based on the convolution, which was fitted to the observed incubation period, with tI1 provided in the form of a time interval bounded by the dates of the first and last possible exposure (tE1, tE2), given by
Shape parameter (α) and rate parameter (β) of the gamma distribution of generation time were estimated using maximum likelihood and presented in the main text.
Interval from symptom onset to the sampling date of first PCR
We estimated the time interval from symptom onset to the sampling date of first PCR based on information of PCR positive individuals. Individuals with information on both the date of symptom onset and the date of first PCR sampling were included. We estimated the distribution of the interval by using maximum likelihood and compared three distributions (Weibull, gamma, and lognormal). The goodness of fit was assessed using Akaike information criterion (AIC).
As described above, the infectiousness profile peaked before the day of symptom onset. This may be driven by the control measures like isolation of infectors. We estimated the distribution of interval from symptom onset to the sampling date of first PCR to evaluate the timing of identification and isolation of infectious individuals. Results are presented in the main text.
Total and mean number of infections by age of infector and of infectee
From 254 certain transmission pairs, we estimate the total (Fig. S4A) and mean (Fig. S4B) number of infections by age. These matrices are descriptive and do not account for confounding factors other than age. Therefore, they cannot be used to estimate susceptibility and infectivity by age group. For example, the lower mean number of infections generated by children (0-14 years old) with respect to adults is the joint effect of several factors. According to our regression analysis, one of these factors is the generation of infection. Infected individuals in generation one have much higher odds of transmitting the infection, probably due to the case isolation and quarantine of close contacts that increase with the generation. Coupled with the low proportion of children in the first generation as compared to adults (we remind that the schools were closed during the entire study period and close community management policies were in place), this may have contributed to lower number of infections generated by children. The summary tables by age and generation are reported in Tab. S4 and Tab. S5.

Number of infections by age of infector and of infectee. Each cell in the matrices refers to the total number of infections (A) and the mean number of infections (B) caused by an infector of a given age.
Summary of contact tracing data by age of infectors and generation of transmission.
Summary of contact tracing data by age of contacts and generation of transmission.
Quantifying the impact of potential drivers on the susceptibility and infectivity of SARS-CoV-2
We analyzed the odds ratio of SARS-CoV-2 transmission given the characteristics of the infectors and their contacts. To consider the clustering effect of an infector and a cluster, mixed effect logit models (i.e., generalized linear mixed-effect model, GLMM, for binary data with the logit link) were used to explore potential drivers of the susceptibility and infectivity of SARS-CoV-2 virus. The specifications of the GLMM models are defined as follows:
Where:
g is a logit link function;
α is the intersect
Age-infectori is the fixed effects of the age group of the infector in the successful (1) or unsuccessful (0) transmission event i;
Age_contacti is the age group of the contact (potential infectee) in the successful/unsuccessful transmission event i;
Contact_typei is the type of contact occurred in the successful/unsuccessful transmission event i;
Generation_infectori is the generation of the successful/unsuccessful transmission event i;
Exposure_leveli is the number of close contacts of the infector involved in the successful/unsuccessful transmission event i;
Gender_infectori is the gender of the infector in the successful/unsuccessful transmission event i;
Gender_contacti is the gender of contact in the successful/unsuccessful transmission event i;
Case_typei is the clinical severity of the infector (i.e., asymptomatic subjects, mild case, moderate case, severe and critical cases of SARS-CoV-2 virus) involved in the successful/unsuccessful transmission event i;
u0 and u1 are random effects attributed to an infector and a cluster, respectively. ui = E[Y|(u0,u1)] is the mean of the response variable Yi of a given value of the random effects.
The random effects of the GLMM are presented in Table S6. The results for fixed effects, including 3 age groups for infector’s and infectee’s age, are presented in the Table S7 and Figure S6. To evaluate the disaggregated effects of age, we also used transformed (log) continuous age variables (i.e., age of infectors and contacts) (Tab. S8). The goodness-of-fit evaluation was based on the estimates provided in the Table S9. Model diagnostic measures and residuals plots (Fig. S5) were evaluated by DHARMa residual diagnostics for hierarchical models 4.
To further explore how the probability of SARS-COV-2 infections changes with a change in each covariate, the average marginal effects of age of infector and contacts, type of contact between infector and contact were estimated across all contacts, holding the effect of other covariate constant (Fig. S7).
In addition, to explore possible non-linearity in the connection of age and of the number of contacts with SARS-CoV-2 transmission, we used generalized additive mixed models (GAMM). We used the same specifications as in the GLMM models presented in the main text. The summary of the results of the GAMM models is shown in Fig. S8 and in Tab. S10. The obtained results suggest that the risk of SARS-CoV-2 transmission monotonically increase with the age of contacts and with the number of infector’s contacts. This is consistent with the patterns that have been shown in GLMM models.
Random effect of infectors and clusters in generalized linear mixed model with categorized age of infectors and contacts.
Stepwise regression analysis of factors associated with the probability of acquiring SARS-CoV-2 infections in generalized linear mixed models with categorized age of infectors and contacts.
Stepwise regression analysis of factors associated with the probability of acquiring SARS-CoV-2 infections in generalized linear mixed models with log-transformed age of infectors and contacts.
Assessing the fit of generalized linear mixed model with categorized age of infectors and contacts.
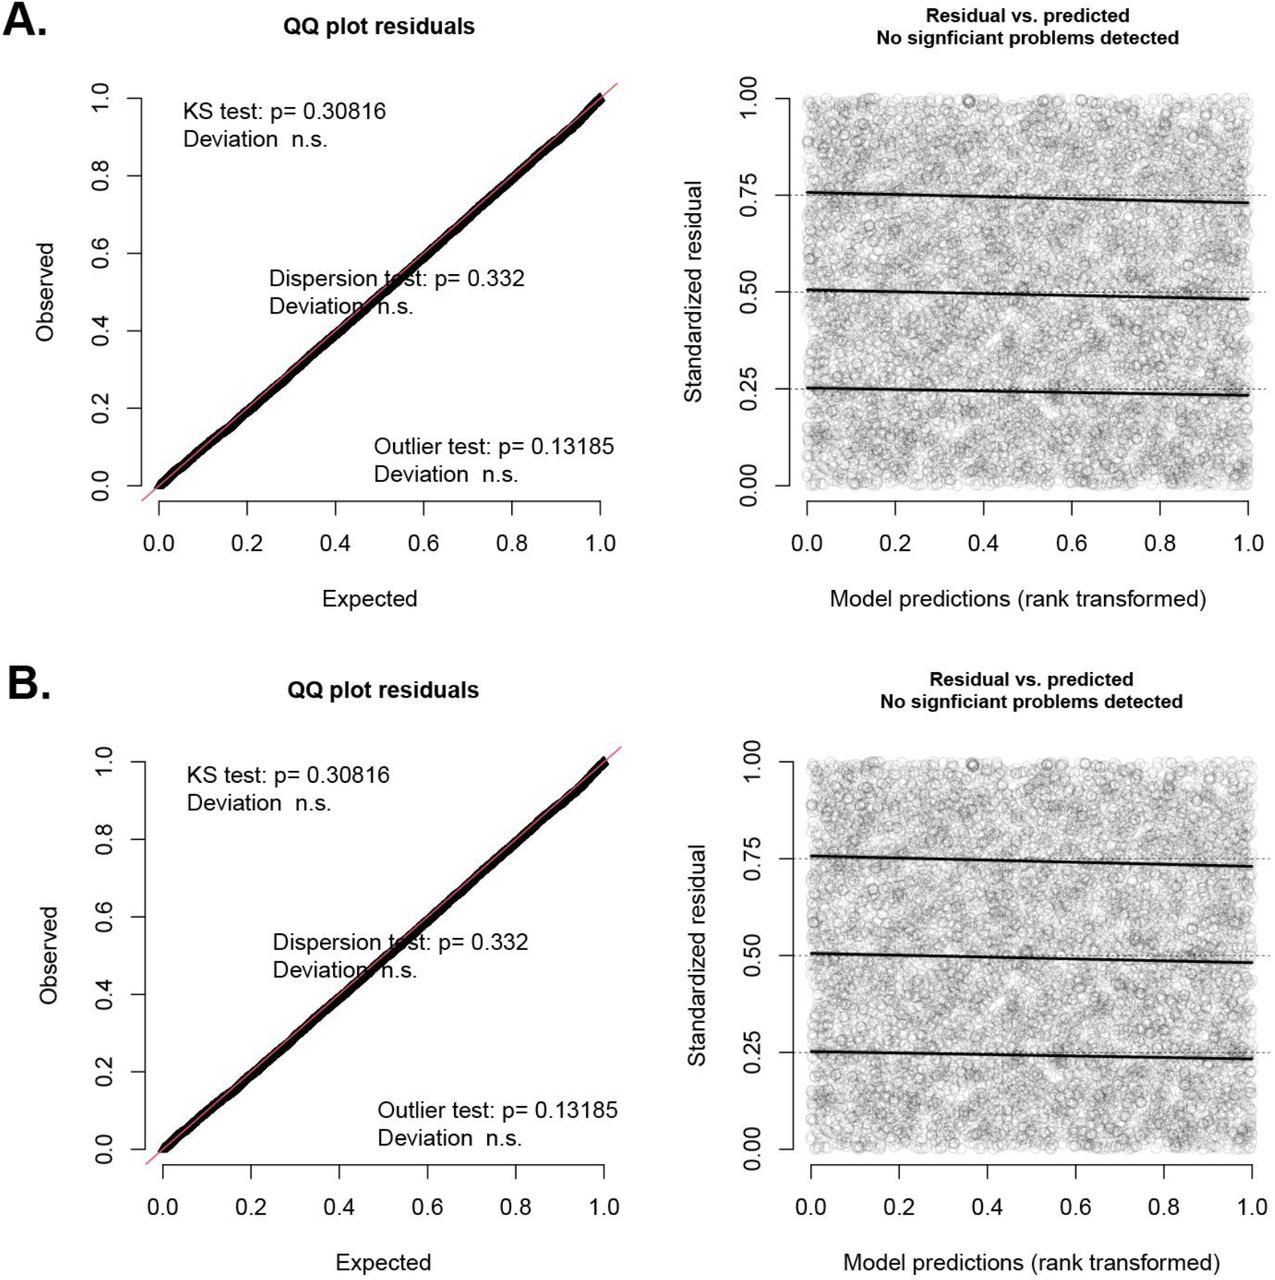
DHARMa residual diagnostics for GLMM models. A: DHARMa residual diagnostics for model 1. B: DHARMa residual diagnostics for model 2.

Potential drivers of COVID-19 transmissions in Hunan Province, China. (A) The relative susceptibility of contacts who were younger than 15 years of age and of those who were older than 65 years of age (the reference group [red lines] was contacts who were 15-64 years of age); (B) The relative risk of SARS-CoV-2 infections among contacts with different type of exposures to an infector (the reference group [red lines] was contacts who were exposed to an infector in households); (C) The relative risk of SARS-CoV-2 infections among contacts with exposures to infectors with different generations of COVID-19 transmission (the reference group [red lines] was contacts who were exposed to an index case-patients); (D) The probability of SARS-CoV-2 infections at a given age of contacts in a specific setting.

The marginal effects of various covariates in GLMM model. The smoothed lines and shared areas represent the point estimates and 95% confidence interval for the probability of SARS-CoV-2 infections, respectively.
Stepwise regression analysis of factors associated with the probability of acquiring SARS-CoV-2 infections in generalized additive mixed models with splines for age of infectors and contacts, as well as number of contacts.

GAMM-predicted non-linear 3-knot splines for age of infector, age of contacts, and the number of contacts. A. model 4-1; B to D. model 4-2. The shaded area delimits the 95% confidence intervals of the spline functions.
Footnotes
Supplemental files updated.
Reference


