
Abstract
Background Body mass index (BMI) and waist-hip-ratio (WHR) are measures of adiposity, the former being a good marker for overall total body fat, the latter describing regional adiposity. Higher adiposity has been associated with the increased prevalence of many chronic diseases and a positive association between BMI and increased hospital admissions has previously been established. The aim of this study was to estimate the causal relationship between BMI, WHR and WHR adjusted for BMI (WHRadjBMI) and yearly hospital admission rates.
Methods and Findings Mendelian randomization (MR) approaches were used to test the causal effect of BMI, WHR and WHRadjBMI on yearly hospital admission rates. Using data on 310,471 participants of White-British ancestry from the UK Biobank, we performed one-sample and two-sample MR analyses on the exposures individually and in a multivariable setting. MR analyses supported a causal role of adiposity on hospital admissions, with consistency across one- and two-sample MR methods. Primarily, one-sample MR analyses estimated fold-increases in yearly hospital admission rates of 1.13 (95% CI: 1.02, 1.27), 1.26 (95% CI: 1.00, 1.58) and 1.22 (95% CI: 1.01, 1.47) per SD for BMI, WHR and WHRadjBMI, respectively. A multivariable approach yielded estimates of 1.04 (95% CI: 0.99, 1.03) for BMI and 1.31 (95% CI: 1.04, 1.67) for WHR, while adjusting for WHR and BMI, respectively.
Conclusions The results support a causal role of higher BMI and WHR in increasing the yearly hospital admission rate. The attenuation of the BMI effect, when adjusting for WHR in the multivariable MR analyses, suggested that an adverse fat distribution, rather than a higher BMI itself, may drive the relationship between adiposity and increased risk of hospital admission.
Introduction
The body stores fat in the form of energy in adipose tissue. Adiposity can be measured by body mass index (BMI, in kg/m2) and by waist hip ratio (WHR), among others, the former being a good marker for overall total body fat, the latter describing regional adiposity. Both measures have been shown to be associated with increased incidence of various diseases [1-8] and all-cause and cause-specific mortality [8-10] Over the last 40 years, global increases in the mean and variance of BMI have occurred [11-13], with the 2016 World Health Organization statistics identifying 39% of men and 40% of women as overweight (BMI>25kg/m2) and 11% of men and 15% of women as obese (BMI>30kg/m2) worldwide [14].
The increased incidence and prevalence of many adiposity-related chronic diseases has implications for the sustainability of healthcare systems. A positive observational association between BMI and rates of hospital admission [15] and related outcomes such as healthcare costs has been shown [16-22]. However, causality in these associations is unclear. Establishing the causal impact of BMI and related measures on hospital admissions and related outcomes is an important step in understanding the impacts of adverse weight profiles on the health system.
Traditional observational analyses may be subject to unobserved confounding and reverse causation, precluding accurate causal inference. Mendelian randomization (MR) is an instrumental variable (IV) approach that allows for the robust estimation of the causal effect of a given exposure (e.g., BMI) on a given outcome (e.g., hospital admission rates) by using quasi- random allocation of genetic variants at conception [23,24]. MR reduces problems of confounding and various types of biases frequently encountered in traditional epidemiological studies. For example, MR can avoid biases due to measurement error in BMI and WHR (e.g., when individuals knowingly or unknowingly misreport their own weight). MR can rule out reverse causation, since germline variants are established at conception, and, in principle, should not be affected by confounding from unmeasured or incorrectly modelled variables, given the random allocation of variants at conception.
This paper models the causal effect of adiposity on inpatient hospital admission rates in a MR approach, using data from over 300,000 adults aged between 39 and 72 and with over 550,000 in-patient hospital admissions in the UK Biobank. We considered three related exposures: BMI, WHR and WHR adjusted for BMI (WHRadjBMI). The effect of the exposures on yearly hospital admission rate was investigated using one-sample MR and two-sample summary MR methods, in both a univariable and multivariable setting. A variety of estimators was employed with the purpose of testing the robustness of our conclusions, including pleiotropy-robust methods and principled identification of outlying variants.
Data
UK Biobank data
The UK Biobank study is a unique resource of phenotypic, genetic, electronic health record and death registry data, collected from over 500,000 individuals, collected from 2006 to 2010 [25-27]. Participants were aged 39-72 years at recruitment and were predominantly of White British ancestry [27]. The UK Biobank received ethical approval from the North West-Haydock Research Ethics Committee (reference 11/NW/0382).
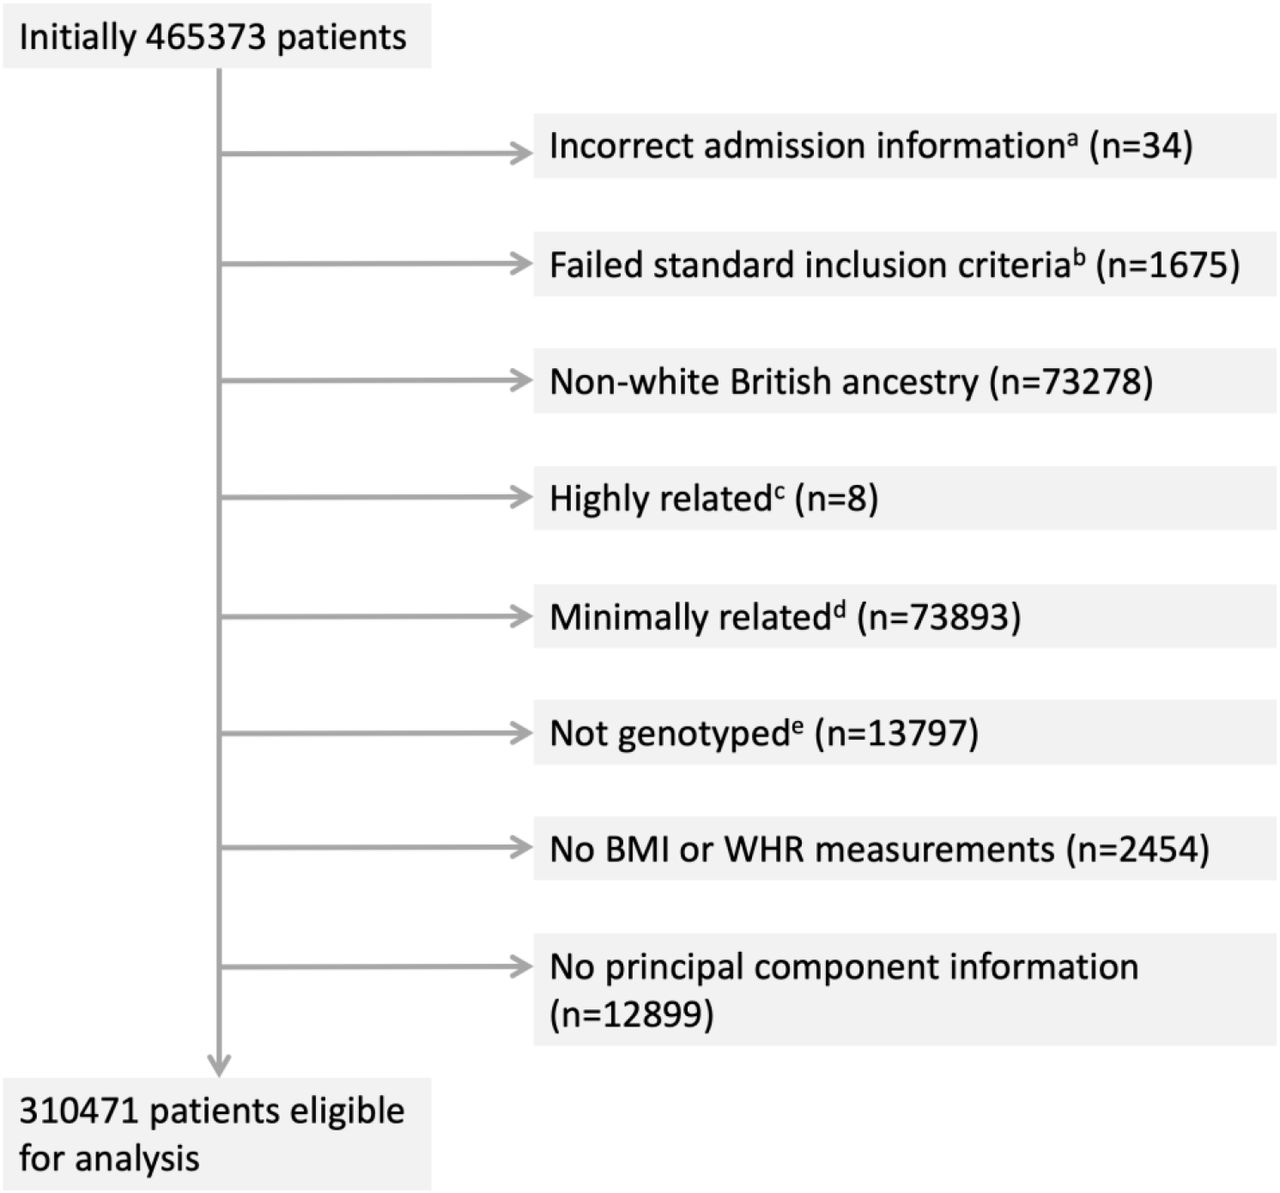
For 465,373 participants, information on hospital inpatient admissions was available through linked Hospital Episode Statistics (HES) data. From this set, 34 participants were removed on grounds of incorrect admission information (hospital admissions prior to study start date, after study censoring date, after recorded death date or recorded death data prior to study start). A further number of participants were removed for factors related to the genetic data according to a documented in-house quality control procedure (Figure 1, Table S1) [28]. Specifically, 1,675 participants failed the standard inclusion criteria (mismatch between genetically inferred and reported gender, sex chromosome types putatively different from XX/XY, outliers in heterozygosity and missing rate), 73,278 had non-white British ancestry, 73,893 were ineligible on grounds of relatedness, 13,797 participants had no genetic data available for the relevant single nucleotide polymorphisms (SNPs) and 12,899 had no genetic principal component information.

Participant inclusion diagram. Eight exclusion categories are shown with the corresponding numbers of participants per category. On removal of duplicates a total of 154902 unique participants are considered ineligible for analysis. a) admissions prior to study start date, post death/censoring date or registered death prior to study start; b) individuals that have a mismatch between genetically inferred and reported gender, individuals with sex chromosome types putatively different from XX or XY and individuals that are outliers in heterozygosity and missing rate; c) individuals related to more than 200 other participants; d) on exclusion a maximal set of unrelated individuals is retained; e) not genotyped for the exposures of interest (BMI, WHR, WHRadjBMI)
For 2,454 individuals, no BMI and/or WHR measurements were reported. Participants matching one or more of the exclusion criteria were removed (N=154,902). An overview of all relevant exclusion criteria is provided in the participant exclusion diagram in Figure 1, with Table S1 providing a cross-table overview of participant overlap for any two exclusion criteria. A total of 310,471 participants were considered eligible for analysis, with the same set of participants used for all analyses for a relevant comparison between estimates from the observational analyses and the MR analyses.
Patient demographics and missingness per covariate are summarized in Table S2.
Adiposity measures
Measures on weight, bio-impedance, height, waist circumference and hip circumference were collected at the initial assessment at baseline. Weight and bio-impedance were measured using the Tanita BC-418MA body composition analyzer, which accurately measures body weight to within 0.1 kg. Standing height was measured using a Seca 202 height measure. BMI was calculated as weight divided by height squared (kg/m2), with a second measure of BMI obtained using electrical impedance. When the first measure was unavailable, values were supplemented with the latter. WHR was calculated by dividing waist circumference by hip circumference, both of which were measured with a Wessex non-stretchable spurring tape measure [29].
Hospital admission counts
Study participants were considered from their time of assessment to ensure that hospital admissions could be appropriately related to baseline covariate measurements. Hospital admission count was derived using electronic health records linked to the UK Biobank study. In the UK healthcare system, hospital admissions are registered as episodes. For a given hospital admission, a patient may have multiple episodes. Admissions were defined where an individual had episodes starting on separate dates, excluding incomplete episodes, episodes with inconsistent or overlapping start and end dates and accounting for patient transfers. Code to define the admissions variable is available from https://github.com/pdixon-econ/admissions-biobank. Approximately half of the participants (47%) experienced no hospital admissions, while 81% of the remaining patients had four admissions or less during the time they were observed on study.
Genetic variants
Estimates for 77 genetic variants associated with BMI at a genome-wide significance level (p<5×10⁻⁸) in the largest genome-wide association study meta-analysis of a combined number of up to 322,154 individuals of European descent (not including UK Biobank) were obtained from the Genetic Investigation of Anthropometric Traits (GIANT) consortium [30]. Individual-level genetic data of sufficient quality [28] was available from UK Biobank for 76 of these 77 SNPs, and were used to construct a genetic risk score (GRS), weighted with the exposure coefficients from the GIANT consortium. Genetic variants associated with WHR were also obtained from the GIANT consortium, with 39 SNPs identified in relation to unadjusted WHR at p<5×10⁻⁸ in a meta-analysis of up to 210,088 individuals [31]. A second set of 48 SNPS was identified as being associated with WHRadjBMI at p<5×10−8.30
Methods
Multivariable observational analyses
Observational estimates were obtained by regressing each exposure directly on the outcome in a Poisson regression with time in UK Biobank as the offset. Unadjusted estimates were obtained alongside estimates adjusted for age at study entry, sex and an additional set of five categorical variables: alcohol frequency (ranging from never to daily or almost daily), days of exercise per week (ranging from 0 days to 7 days), educational/professional qualifications, employment, and material deprivation as measured by the Townsend deprivation index (divided into quintiles, with higher values indicating a greater degree of deprivation). In order to make full use of the available data, we imputed missing values in a 10-fold imputation approach and pooled the resulting coefficients and standard errors pooled using Rubin’s rules [32].
Mendelian randomization
We conducted both one- and two-sample MR analyses. In a one-sample framework, individual-level genetic data is used to obtain estimates of both the gene-exposure association (βexp) and the gene-outcome association (βout), in a single sample using a linear regression for the former, and typically a linear or logistic regression for the latter for continuous and binary outcomes, respectively. Taking the ratio of the coefficients will give the causal IV estimate  . Equivalently, the fitted values obtained from the regression of the exposure on genetic variant can be regressed on the outcome. The former is referred to as the Wald ratio approach, the latter as the two-stage least squares (2SLS) approach. In a two-sample MR framework, Wald ratio-based methods are used to obtain the IV estimate with the exposure and outcome coefficients obtained from similar but separate populations [25].
In order to obtain a valid causal IV estimate in either framework, three main assumptions need to be satisfied: the genetic variant or variants must be correlated with the exposure, be independent of any unobserved confounders, and only affect the outcome through the exposure. Violation of this last assumption is known as horizontal pleiotropy – where a variant influences the outcome through a pathway other than via the exposure of interest. When multiple genetic variants are considered, heterogeneity amongst the Wald ratios may indicate that one or more SNPs are exhibiting horizontal pleiotropy [33,34].
Poisson regression
Both one and two-sample MR methods are traditionally applied to continuous or binary outcome data. While the use of MR in the context of different outcomes is less well-established, extensions to the traditional framework need to be considered for outcomes that cannot be accurately represented through linear or logistic models. Count data is frequently modeled using Poisson regression, which applies a generalized linear model with a logarithmic link function and can be used to obtain estimates of covariate effects on the absolute count or the count adjusted for a given measurement unit. Here, the outcome was given by hospital admission counts for subjects that were observed for varying lengths of time.
We employed a model that corrected for time at an individual level, with the yearly hospital admission rate as the outcome, and time for each individual defined as the observation time in years from study start to study censoring/death. The Poisson model assumes an outcome distribution such that the outcome mean is equal to the outcome variance. This stringent assumption may be relaxed by employing a quasi-Poisson model, which allows the variance to vary as a linear function of the mean. As the hospital admission count variance (55.3) is greater than the mean hospital admission count (1.89), we elected to use a quasi-Poisson model [35].
As the Poisson model is linear on the logarithmic scale, the second stage of the MR regression that estimates the gene-outcome association can be replaced by a Poisson regression. To obtain the causal IV estimate, the ratio of the βout and βexp coefficients is taken, with the βout coefficient on the log scale, and subsequently exponentiated to yield an estimate of the rate coefficient:  . Then, for a given exposure of interest, the coefficient βIV is the factor by which the yearly hospital admission rate increases for each unit of exposure, with values >1 indicating an increase in admission rate and values <1 indicating a decrease. Standard errors for the causal IV estimates were estimated using Taylor series expansions [36]. A more extensive description of the Poisson regression in general and in MR context is given in Appendix A.
One-sample Mendelian randomization
Weighted GRSs were constructed for the exposures of interest - BMI (76 SNPs) [30], WHR (39 SNPs) [31] and WHRadjBMI (48 SNPs) [31]. To ensure a meaningful interpretation of the score, the exposure-increasing allele for each genetic variant was chosen as the effect allele [9]. For each study participant, the dosage for each relevant genetic variant was extracted from the UK Biobank genetic data and weighted with the effect size reported by the GIANT consortium. Following this, the weighted dosages were summed and divided by the sum of all effect sizes, giving a GRS representing an estimate for the average number of exposure-increasing alleles. Estimates were adjusted for age, sex and the first 40 genetic principal components (PCAs).
To estimate the effect of WHRadjBMI on hospital admissions, we generated the residuals of a regression of WHR on BMI as an exposure, which gives an estimate for the predictive performance of the WHR component that cannot be linearly predicted by BMI.
We also considered the effects of BMI and WHR when estimated in a joint model, using a multivariable MR approach. Multivariable MR (MVMR) aims to estimate the causal effect of multiple exposures simultaneously. In contrast to univariable MR, which estimates the total effect of an exposure on the outcome, MVMR estimates the direct effect of each exposure conditioning on the causal effects of the SNPs on the other exposure [37]. Here, BMI and WHR were separately regressed on the full combined set of SNPs and the fitted values of both were regressed on hospital admission count in a Poisson regression with time as the offset. Standard errors were obtained through a 10,000-fold full-sample bootstrap [38].
For BMI, estimates of hospital admission rates per year were obtained per BMI unit (1 kg/m2) and per BMI standard deviation (SD). For WHR, WHRadjBMI, and the WHR residuals, estimates were obtained per 0.1 WHR unit and per WHR SD. The relevant SDs were calculated directly from the UK Biobank data, yielding SDs of 4.74 kg/m2 and 0.090 for BMI and WHR, respectively.
Two-sample summary Mendelian randomization
Gene-exposure association coefficients for the two-sample MR analyses were obtained from the GIANT consortium [30,31] and gene-outcome association coefficients from the UK Biobank data. A range of two-sample MR methods was applied for each exposure: 1) the regression-dilution bias robust random effects exact weights inverse-variance weighted (IVW) estimator [39]; 2) the pleiotropy robust random effects MR-Egger estimator [40]; 3) the pleiotropy-robust penalized median estimator [41]; and 4) the pleiotropy-robust weighted mode estimator [42]. The consistency of the obtained estimates was evaluated across these four approaches. Each estimator is subject to different assumptions and methods of interpretation. Heterogeneity between the IV estimates of each genetic variant was investigated using the IVW-based Cochran’s-Q and the MR-Egger based Rucker’s Q [43]. Further detail on the methods and on assessing heterogeneity is provided in Appendix B.
Similar to one-sample MR analyses, two-sample MR estimates were obtained for BMI, WHR and WHRadjBMI individually and for BMI and WHR jointly in a multivariable two-sample MR analysis [37]. For BMI, estimates of hospital admission rates per year were obtained per BMI unit (1 kg/m2) and SD. For WHR and WHRadjBMI estimates were obtained per 0.1 WHR unit and SD. SDs were calculated by taking the median SD across all studies used to obtain the summary measures, giving SDs of 4.6 kg/m2 and 0.070 for BMI and WHR, respectively.
To satisfy the assumption of independent instruments, a threshold of R2<0.001 reflecting linkage disequilibrium (LD) was employed for the two-sample MR analyses. Post LD-correction, 64, 34 and 45 SNPs were retained for BMI, WHR and WHRadjBMI, respectively. For the multivariable two-sample MR analysis, 70 SNPS were retained after a joint LD adjustment for BMI and WHR.
All analyses were performed in R version 3.6.1 [44]. R packages TwoSampleMR [45], RadialMR [43], and MVMR [37] were used for the two-sample summary MR analyses and Amelia [46] was used for the multiple imputation performed in the conventional multivariable analyses. An R code appendix is provided in the supplementary materials.
Results
Descriptives
The 310,471 participants included in the analysis sample had an average age of 57.4 years (SD: 7.99) with a BMI of 27.4kg/m2 (SD: 4.74) and WHR of 0.87 (SD: 0.09). Of these participants, 53.7% were female. Average follow-up time was 6.05 years (SD: 0.91). BMI, WHR, sex and age distributions were comparable across the UK Biobank and the GIANT consortium populations [27,30,31]. Demographics for the UK Biobank participants are given in Table S2. For the 310,471 participants, a total of 588,147 in-patient hospital admissions was recorded, with 79% of participants admitted twice or less and 47% without a single admission. Table S3 gives an overview of hospital admission counts across BMI categories, WHR quantiles, age quantiles and gender.
In order to facilitate comparisons of magnitude across the exposures, estimates of associations were obtained per exposure SD in addition to the standard per unit measures (with 0.1 units for WHR). Estimates per SD are reported in-text and in the summary figures (Figures 2-3), while estimates per SD and unit both are given in the supplementary tables (Tables S4, S5, S7 and S8).

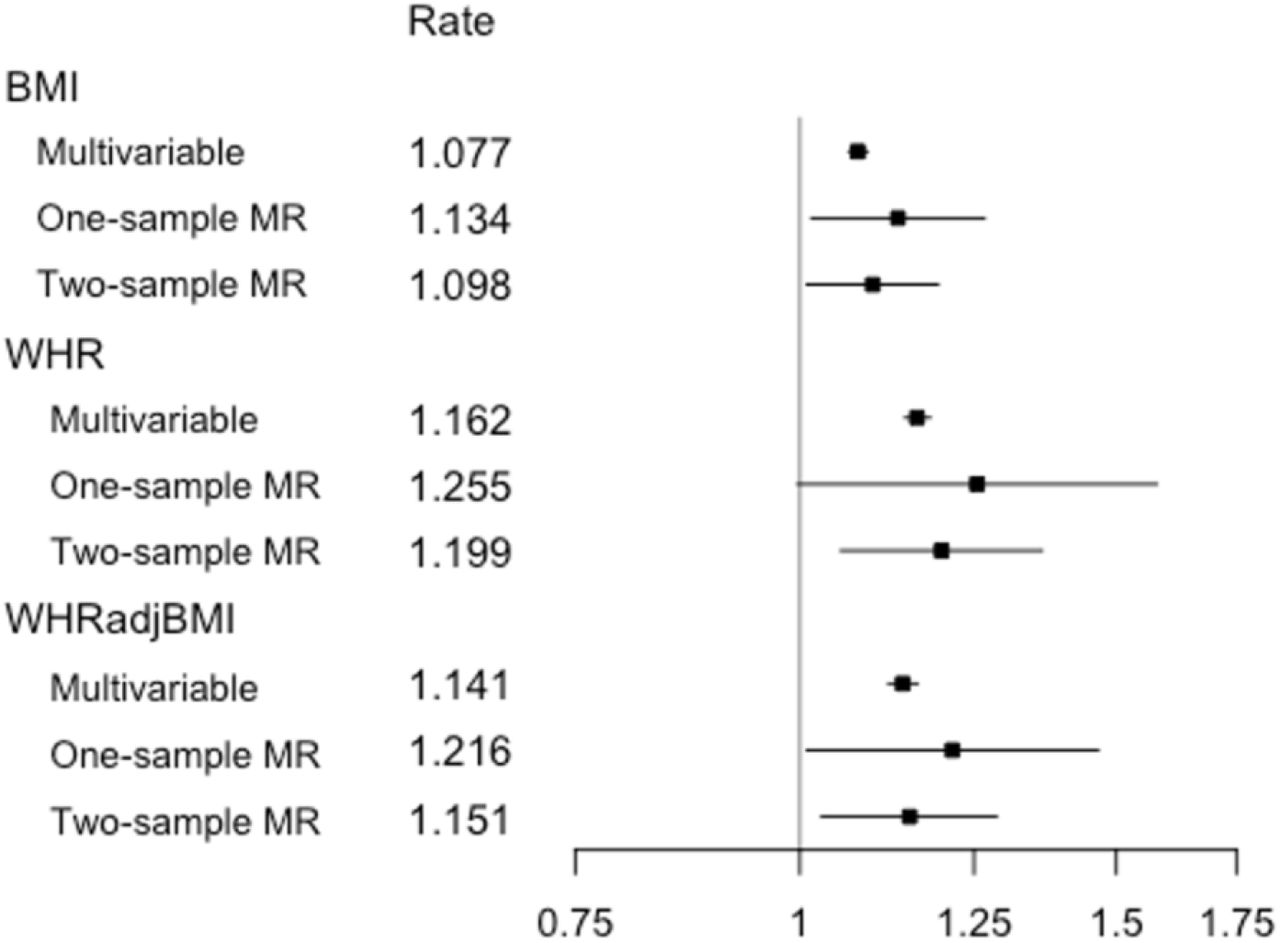
Estimates from multivariable observational analyses, one-sample MR analyses and two-sample MR IVW analyses for exposures BMI, WHR and WHRadjBMI per SD unit. Shown are point estimates alongside 95% CIs for the effect of exposure on yearly hospital admission rate, given on the log scale. Rate estimates and x-axis values are given on the exponential scale. All MR analyses were adjusted for age, sex and the first 40 genetic PCAs. The multivariable observational analyses were adjusted for a range of baseline patient characteristics (Table S2).
Observational multivariable analyses
Poisson multivariable regression models provided evidence that BMI and WHR were associated with an increase in yearly hospital admission rate (Table S4, Figure 2). The adjusted regressions for the multivariable observational models yielded a 1.08-fold increase per BMI SD (95% CI: 1.07, 1.09) and a 1.16-fold increase per WHR SD (95% CI: 1.14, 1.18). Adjusting for BMI in the WHR regression resulted in a slightly attenuated association, with a 1.14-fold increase per WHR SD (95% CI: 1.12, 1.16).
Observational analyses regressing the outcome on both exposures simultaneously resulted in attenuated associations compared to the single exposure models, with a 1.03-fold increase per BMI SD (95% CI: 1.02, 1.04) and a 1.14-fold increase (95% CI: 1.12, 1.16) per WHR SD, respectively (Table S5, Figure 3). For all exposures, the estimates derived from adjusted models were lower than those derived from the unadjusted models, but with overlapping confidence intervals.
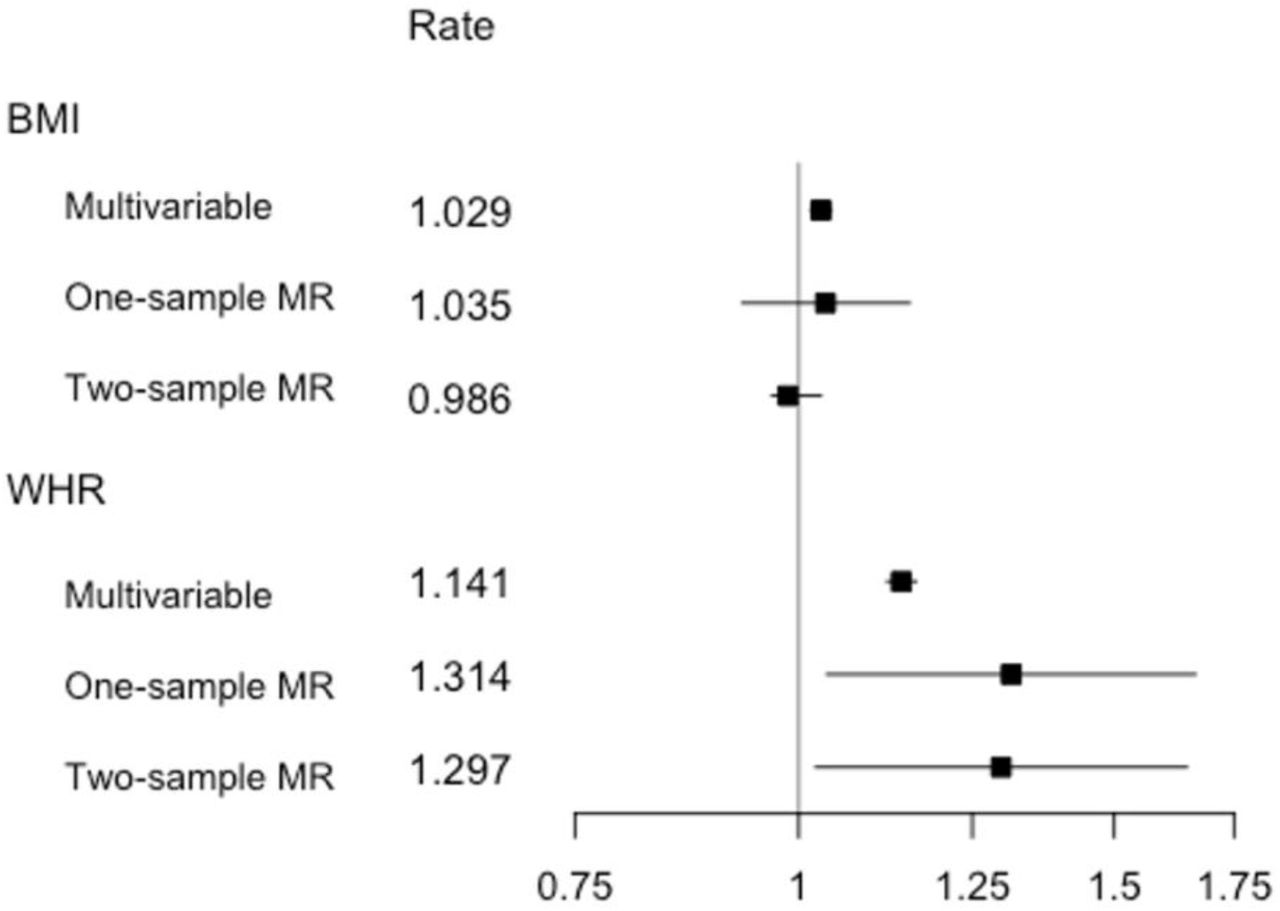
Estimates from multivariable observational analyses, multivariable one-sample MR analyses and multivariable two-sample MR analyses for exposures BMI and WHR per SD unit. Shown are point estimates alongside 95% CIs for the effect of exposure on yearly hospital admission rate, given on the log scale. Rate estimates and x-axis values are given on the exponential scale. MR analyses were adjusted for age, sex and the first 40 genetic PCAs. The multivariable observational analyses were adjusted for a range of baseline patient characteristics (Table S2), with the BMI estimate adjusted for WHR and vice versa.
Association between GRS and exposures
Table S6 shows the associations between BMI and WHR and the three GRSs - the BMI GRS (comprising 76 SNPs), the WHR GRS (comprising 39 SNPs) and the WHRadjBMI GRS (comprising 48 SNPs). In UK Biobank participants of White British ancestry, each unit increase in BMI GRS was associated with a 0.11kg/m2 higher BMI (95% CI: 0.11, 0.12), with the GRS explaining 1.69% of the variance. Each unit increase in WHR GRS was associated with a 0.01 higher WHR on the 0.1 unit scale (95% CI: 0.01, 0.01), explaining 0.41% of the variance, while each unit increase in WHRadjBMI GRS was associated with a 0.01 increase in WHR on the 0.1 unit scale (95% CI: 0.01, 0.02), explaining slightly more of the variance at 0.47%. F-statistics indicated that each GRS was a strong instrument for MR analyses (Table S6), with all F-statistics > 1267.
One-sample MR analyses
One-sample MR estimates of the effect of BMI, WHR and WHRadjBMI on hospital admission rates were obtained per exposure SD and unit (Table S4, Figure 2). The IV regressions, adjusted for age, sex and the first 40 genetic PCAs, yielded a 1.13-fold increase per BMI SD (95% CI: 1.02, 1.27) and a 1.26-fold increase per WHR SD (95% CI: 1.00, 1.58). Using the WHRadjBMI SNPs, a fold increase of 1.22 was observed WHR SD (95% CI: 1.01, 1.47). Adjusting for BMI in the WHR regression, by using the residuals from a linear regression of WHR on BMI as an exposure, resulted in a reduced effect of 1.16 (95% CI: 0.97, 1.39) per SD.
The multivariable one-sample MR analysis (Table S5, Figure 3), adjusted for age, sex and the first 40 genetic PCs, showed no strong evidence for an independent effect of BMI on hospital admissions, with a fold increase of 1.04 (95% CI: 0.93, 1.15) per BMI SD, when controlling for WHR. Conversely, there was evidence for an independent effect of WHR on hospital admissions, with a fold increase of 1.31 (95% CI: 1.04, 1.67) per WHR SD, yielding a considerably higher estimate than observed for both the WHR and WHRadjBMI univariable analyses (Table S4); however, confidence intervals of these results all overlapped. Instrument strength, as assessed using the conditional Sanderson-Windmeijer F-statistic [37], was sufficient for the multivariable MR analysis, with F-statistics of 38.50 and 22.89 for BMI and WHR, respectively.
Two-sample MR analyses
The IVW estimator showed evidence for a causal effect of all three exposures on hospital admissions (Table S7, Figure 2), at magnitudes consistent with one-sample MR results. For BMI, we observed a fold increase of 1.10 (95% CI: 1.01, 1.19) per SD, for WHR a fold increase of 1.20 (95% CI: 1.05, 1.36) per SD and for WHRadjBMI a fold increase of 1.15 (95% CI: 1.03, 1.29) per SD. The penalized weighted median and weighted mode yielded near identical point estimates, paired with wider confidence intervals, now including the null. The widest confidence intervals were observed for the MR-Egger estimates, as is usually the case given the lower power of this estimator. While, for WHR, the MR-Egger point estimate was comparable to those of the previous estimators, it was markedly lower for BMI and WHRadjBMI. The MR-Egger intercept indicated no directional pleiotropy.
Limited heterogeneity as measured by Rücker’s Q (QR) and Cochran’s Q (QC) was observed. For all three exposures, the Q-statistics smaller than the number of SNPs used for estimation (QR,BMI=51.29, QC,BMI=52.06, QR,WHR=28.64, QC,WHR=28.92, QR,WHRadj=43.80, QC,WHRadj=44.01).Despite the lack of substantial heterogeneity, we performed a sensitivity analysis to investigate the potential presence of pleiotropy driven by outlying SNPs. Individual SNPs were identified in a visual inspection of leave-one-out plots (Figures S1-S3) and removed, with 3, 4 and 4 SNPs excluded for BMI, WHR, and WHRadjBMI, respectively. The two-sample MR analyses were repeated using the reduced set of SNPs, yielding comparable point estimates and confidence intervals overlapping with those from the original analyses (Table S8).
A multivariable two-sample analysis of the BMI and WHR simultaneously (Table S9, Figure 3) yielded no strong evidence for an association of BMI and the yearly hospital admission rate, with a fold increase of 0.99 per BMI SD (95% CI: 0.85, 1.14). Mirroring the pattern observed in the multivariable one-sample analysis, the multivariable two-sample analysis provided evidence for an association between WHR and hospital admission rate and had higher point estimates than the WHR and WHRadjBMI univariable two-sample analyses, with a fold increase of 1.30 per WHR SD (95% CI: 1.02, 1.65) (Table S9).
The gene-exposure associations and gene-outcome associations for the univariable two-sample MR analyses are given in Supplementary Tables S10, S11 and S12 for BMI, WHR, and WHRadjBMI, respectively. The same quantities are provided for the multivariable two-sample analysis in Supplementary Table S13.
Comparison across methods
Figure 2 summarizes the effect of each exposure on yearly hospital admission rate, as estimated from traditional multivariable analyses, and both one- and two-sample MR analyses. For all exposures, we observed a higher point estimate for the one-sample MR analyses when compared to the traditional multivariable analyses, more so for WHR and WHRadjBMI than for BMI. On the whole, the estimates of the effect of all three exposures on yearly hospital admission rate were consistent across estimators, with overlapping confidence intervals, and comparatively wider confidence intervals for WHR and WHRadjBMI. A similar pattern is observed in Figure 3, which provides a comparable summary for the multivariable estimators. Once more, the confidence intervals for both exposures overlapped, but with the BMI point estimates grouped more closely. In contrast to the univariable analyses summarized in Figure 2, the one- and two-sample BMI estimate confidence intervals now included the null, while for WHR the null was excluded for both the multivariable one-sample and two-sample analyses.
Discussion
Our results, based on the first MR analysis of more than 550,000 hospital admissions measured in over 300,000 UK Biobank participants, supported the presence of causal effect of a higher BMI, WHR and WHRadjBMI on an increased hospital admission risk using one- and two-sample MR methods, in both a univariable and multivariable MR framework.
When evaluating the point estimates per exposure SD unit, WHR and WHRadjBMI had comparatively larger effect sizes than BMI for all estimators. In the multivariable one-sample and two-sample MR analyses, no strong evidence for an association was observed for BMI, while a strong positive association was measured between WHR and the yearly hospital admission rate. This suggests that the relationship between adiposity and hospital admissions may be driven by a detrimental distribution of fat and adipose tissue rather than by BMI itself.
In previous research, an observational study of approximately 1.3 million UK women found a yearly hospital admission rate increase of 1.12 (95% CI: 1.12, 1.13) for every 5kg/m2 increase in BMI [15]. In just over 300,000 individuals, we observed estimates amounting to rate coefficients of 1.025 = 1.08 (95% CI: 1.07, 1.10), 1.14 (95% CI: 1.02, 1.28) and 1.10 (95% CI: 1.01, 1.21) from the multivariable observational, one-sample MR and two-sample MR analyses, respectively, giving effect estimates of a magnitude comparable to those observed previously in UK women. Another multivariable study, examining the association between BMI and hospital admissions in 451,320 UK Biobank participants, found increases in yearly hospital admission rates, measured per 2kg/m2 BMI, of 1.06 (95% CI: 1.05, 1.07) and 1.06 (95% CI: 1.05, 1.07) for male and female never-smokers, respectively [47]. We observed comparable estimates, with increases across both genders, per 2kg/m2 BMI, of 1.022=1.03 (95% CI: 1.03, 1.04), 1.05 (95% CI: 1.01, 1.11), and 1.04 (95% CI: 1.00, 1.08), for the multivariable observational, one-sample MR and two-sample MR analyses, respectively.
While the effect of BMI/WHR on hospital admission rate has not previously been studied in an MR framework, the effect of BMI on hospital cost was examined in a two-sample MR analysis, using data from UK Biobank, which largely overlaps with our own study population [20]. A positive causal effect of BMI on hospital cost was found, in line with our own observation of increased hospital admissions for higher BMI.
We show the causal role of higher BMI and WHR in increasing the risk of hospital admission, using a large high-quality dataset. While a positive association of BMI and hospital admissions has previously been shown [15,47], this is the first time hospital admissions have been modeled using MR methods – the MR framework allowing us to obtain estimates of causal effects less sensitive to confounding and bias problems present in traditional epidemiological studies [23,24]. Our results further emphasize the necessity of increasing efforts towards the development of policies to combat the global rise in adiposity.
In addition to BMI, we also investigated the causal role of WHR on hospital admissions. WHR has not been investigated previously in the context of hospital admissions or health care costs. Importantly, we show here, through multivariable one-sample and two-sample MR analyses, that the observed effect of BMI on hospital admissions may actually be driven by abdominal adiposity, for which WHR is a more direct measure than BMI, the latter quantifying both overall adiposity and lean muscle mass.
Additionally, we demonstrate in this study that a non-standard outcome like hospital admission counts can be successfully modeled using MR methods, both in a one-sample and two-sample framework, by replacing the linear or logistic component (linear for continuous outcomes, logistic for binary ones) modeling the gene-outcome association with a Poisson regression.
Limitations
MR methods make it possible to avoid certain biases common to traditional epidemiological studies, but also face several limitations, both in terms of interpretation and in terms of potential alternative sources of bias sources. When interpreting the results, it should be noted that MR does not estimate an average treatment effect, but rather a local average treatment effect (LATE) instead, under the assumption that the effect of IV on treatment for all IVs is in the same direction for all subjects – the condition of monotonicity [48]. In context of this particular study, this means that we estimate the effect of WHR and BMI in those subjects whose WHR/BMI exposure values differ on varying the levels of the respective IVs, under the condition that the change occurs in the same direction for all participants.
As the IVs are comprised of genetic markers, which are ‘assigned’ at conception, the estimated LATE is a measure of the effects of a lifelong exposure to BMI-increasing alleles/WHR-increasing alleles. Additionally, we should note that, for all three exposures, a relatively modest percentage of variance is explained by the genetic variants, reducing statistical power for detecting the effect of a change in BMI/WHR and consequently less precise estimates [23].
A key interpretive assumption of MR is that of gene-environment equivalence: that genetically influenced BMI and WHR will have the same effect on hospital admission risk as, for example, adiposity modified by diet and/or exercise. The included SNPs, however, may not meet the stable unit treatment assumption (SUTVA) [49] and as such, our estimates of the effect of BMI and WHR will not necessarily be representative of the increase or reduction in hospital admission rate when adiposity is altered through interventions.
We were limited to inpatient hospital admissions as the source of hospital data linked to UK Biobank at the time of writing. It is possible that other forms of hospital and primary care may substitute for inpatient care, in which case our estimates may overstate the effect of adiposity on overall healthcare admissions and care episodes. On the other hand, if inpatient care is complementary to other forms of care, then we may have understated these episodes. In practice, both effects may be present, and we do not have data to definitively parameterize the relative balance of each effect. Our results are best interpreted in relation to our outcome of inpatient admissions.
While UK Biobank is a unique and high-quality source, the underlying demographic structure of the data imposes various restrictions in terms of generalizability. The UK Biobank sample is healthier and wealthier than the population from which it is drawn and consequently is likely to not be representative of the wider UK. Indeed, we observed lower rates of mortality than in the general population [25], better health-related behaviour and a higher level of education [50]. As less healthy individuals are less likely to participate in the study, the observed sample may be subject to selection bias [51-53], which will impact the estimates obtained from both conventional multivariable analyses and MR analyses – where estimates obtained may even be an underestimation of the effect of adiposity on hospital admissions in the general population. It should also be noted that current analyses have been limited to individuals of White British ancestry, and as such the results will not necessarily generalize to other ancestral groups.
A potential further limitation is the possibility of cohort effects. UK Biobank participants are aged 39-72 years, giving rise to range of birth cohorts in our data sample. There is some evidence from other sources to suggest that SNPs exert a greater influence on BMI for those born in more recent decades, possibly because of an increasingly obesogenic environment [55,56].
Additional sources of bias that should be considered in the context of MR and the UK Biobank data are assortative mating [56-59], confounding due to population stratification bias [59-62] and the presence of dynastic effects [59,61,63], which have all be implicated with respect to BMI previously. While we attempted to minimize the impact of population stratification with the inclusion of 40 genetic principle components, latent data structure may still exist for some exposures such as BMI [60]. Within-family analysis may address some of these issues [61,64], although statistical power for this form of modelling is currently limited given relatively modest available sample sizes of related individuals in UK Biobank [65].
Conclusion
This study describes the first MR analysis to estimate the causal effect of BMI, WHR and WHRadjBMI on yearly hospital admission rates. Results supported the causal role of greater adiposity in increasing the risk of hospital admissions. Multivariable MR analyses suggested that the effect of BMI on hospital admission rates may be mediated by WHR and that an unfavourable fat distribution may drive the relationship between increased adiposity and higher hospital admission rates.
In applying robust causal inference methods that are able to account for biases common to conventional epidemiological analyses, we have obtained results that highlight the negative effect of adverse weight profiles on the health system, further emphasizing the necessity of developing policies to combat the global rise in adiposity.
Data Availability
All data used is available from UK biobank. The outcome of interest, hospital admission count, was derived using electronic health records linked to the UK Biobank study. Code to define the admissions variable is available from https://github.com/pdixon-econ/admissions-biobank.
Declarations
Funding statement
AH, RCR, KHW and PD are members of the MRC Integrative Epidemiology Unit at the University of Bristol which is supported by the Medical Research Council and the University of Bristol (MC_UU_12013/1, MC_UU_12013/9). PD acknowledges support from a Medical Research Council Skills Development Fellowship (MR/P014259/1). RCR is a de Pass Vice Chancellor’s Research Fellow at the University of Bristol. KHW was supported by the Elizabeth Blackwell Institute for Health Research, University of Bristol and the Wellcome Trust Institutional Strategic Support Fund (204813/Z/16/Z) and works within a group funded by the Wellcome Trust Investigator Award (202802/Z/16/Z).
Conflict of interest statement
The authors declare no conflicts of interest.
Acknowledgments
This research has been conducted using the UK Biobank Resource as part of application numbers 16391 and 29294.
References


