
Abstract
Current models for flu-like epidemics insufficiently explain multi-cycle seasonality. Meteorological factors alone do not predict seasonality, given substantial climate differences between countries that are subject to flu-like epidemics or COVID-19. Pollen is documented to be antiviral and allergenic, play a role in immuno-activation, and seems to create a bio-aerosol lowering the reproduction number of flu-like viruses. Therefore, we hypothesize that pollen may explain the seasonality of flu-like epidemics including COVID-19.
We tested the Pollen-Flu Seasonality Theory for 2016–2020 flu-like seasons, including COVID-19, in The Netherlands with its 17 million inhabitants. We combined changes in flu-like incidence per 100K/Dutch citizens (code: ILI) with weekly pollen counts and meteorological data for the same period. Finally, a discrete, predictive model is tested using pollen and meteorological threshold values displaying inhibitory effects on flu-like incidence.
We found a highly significant inverse association of r(224) = –.38 between pollen and changes in flu-like incidence corrected for incubation period, confirming our expectations for the 2019/2020 COVID-19 season. We found that our predictive model has the highest inverse correlation with changes in flu-like incidence of r(222) = –.48 (p < .001) when pollen thresholds of 610 total pollen grains/m3 per week, 120 allergenic pollen grains/m3 per week, and a solar radiation threshold of 510 J/cm2 are passed. The passing of at least the pollen thresholds, preludes the beginning and end of flu-like seasons. Solar radiation is a supportive factor, temperature makes no difference, and relative humidity associates even with flu-like incidence increases.
We conclude that pollen is a predictor for the inverse seasonality of flu-like epidemics including COVID-19, and solar radiation is a co-inhibitor. The observed seasonality of COVID-19 during Spring, suggests that COVID-19 may revive in The Netherlands after week 33, the start being preceded by the relative absence of pollen, and follows standard pollen-flu seasonality patterns.
Introduction
Current models for flu-like epidemics insufficiently explain multi-cycle seasonality. Meteorological factors alone do not predict the seasonality of flu-like epidemics (Tamerius et al., 2011) or COVID-19 (Yao et al, 2020). Pollen is documented to be antiviral (Ghanem et al., 2015; Palmer-Young et al.,2017; Wachsman et al, 2000), anti-influenza (Chen, 2016), allergenic (Klemens et al, 2007; Rosenwasser, 2011; Howarth, 2000), and plays a role in immuno-activation (Brandelius et al, 2020).
Recently, we identified pollen bio-aerosol as a discrete seasonal factor in inhibiting flu-like epidemics for the period 2016 to 2019 in The Netherlands (Hoogeveen, 2020). In this epidemiological study, we found strong inverse associations between allergenic pollen counts and hay fever on the one hand, and flu-like incidence on the other hand. The study was based on the persistent observation that pollen and flu season predictably alternate each other in moderate climate zones, and the absence of sufficient meteorological explanations (Tamerius et al., 2011). We further observed that the passing of pollen impact threshold values of around 100 allergenic pollen grains/m3 per week, reliably mark the onset and decline of moderate flu-like epidemic lifecycles, and thus can be used as predictor.
The seasonality of respirational viral diseases has already been recognized for thousands of years in temperate regions (Moriyama et al., 2020). More in detail, virologists observed that the cold, and flu-like epidemics (e.g., influenza and corona caused) “go away in May” in the Northern Hemisphere, while emerging in the Southern Hemisphere with its opposite seasonality, to re-emerge in the Northern Hemisphere during its next Autumn and Winter in a slightly mutated form. Furthermore, all new flu-like pandemics since 1889 typically emerged in the Northern Hemisphere at the tail-end of respective flu-seasons (Fox et al., 2017), whereby the current COVID-19 pandemic is clearly no exception. Fox et al. showed that most flu-like pandemics are multi-wave, whereby the initial wave at the tail-end of flu season is typically short-lived. This gives rise to the suspicion that COVID-19 is subject to such multi-wave seasonality as well (Kissler et al., 2020).
Numerous studies try to explain flu-like seasonality from meteorological factors such as UV radiation (Schuit et al., 2020), temperature and humidity (Chong et al., 2020; Shaman et al, 2011). However, Postnikov (2016) concluded that ambient temperature is not a good predictor for influenza seasonality in The Netherlands, and the association of humidity to influenza is inconsistent (Soebiyanto et al., 2014). Although UV light is detrimental for flu-like viruses under laboratory conditions, and associated with immuno-activation (Abhimanyu & Coussens, 2017; Tan & Ruegiger, 2020) and circadian rhythms regulating lung immunity (Nosal et al., 2020), the early onset of flu season, halfway August in The Netherlands, coincides with an annual peak in hot, sunny days. Also for the decrease of COVID-19 infections, nor high UV nor high temperature are good predictors (Yao et al, 2020). Nevertheless, these meteorological variables are known factors in the ripening and dispersion of pollen.
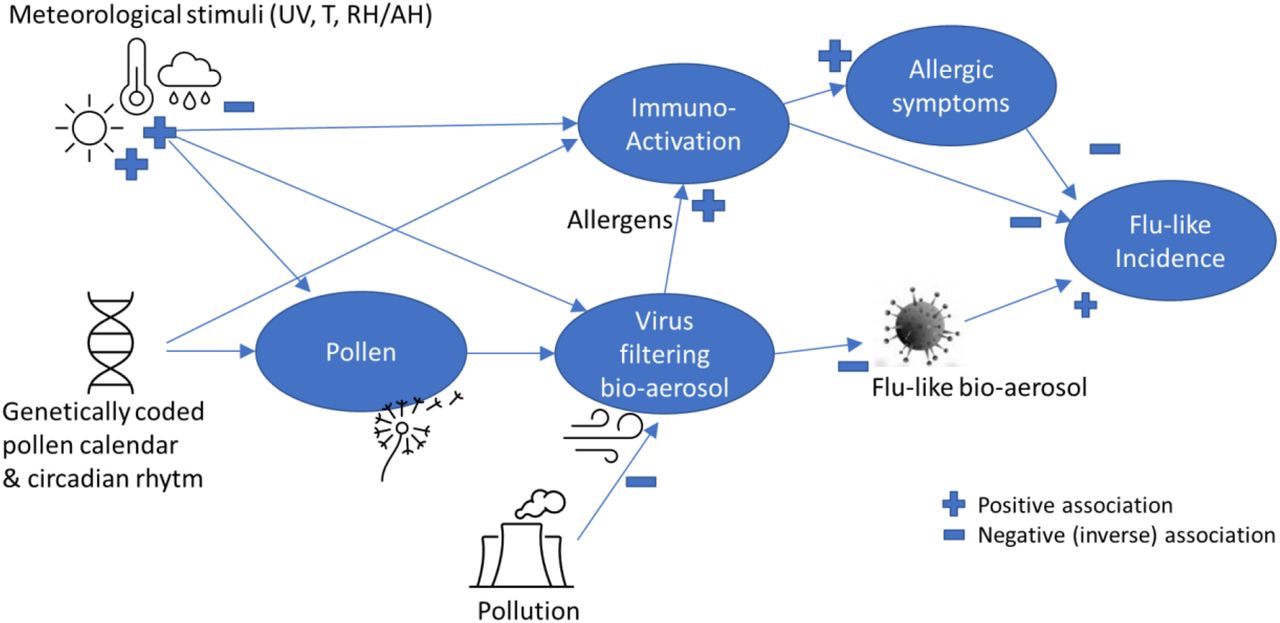
We hypothesize that there is an inverse direct or indirect effect of pollen bio-aerosol on flu-like incidence and COVID-19 (Hoogeveen, 2020) (See Fig. 1).

a simplified theoretic model explaining pollen-flu inverse seasonality, whereby pollen might have a direct (I) “anti-viral”, indirect allergenic (II) and/or immune triggering (III) function, inhibiting flu-like epidemic incidence in combination with meteorological conditions and triggers.
To further understand the impact of pollen as an environmental factor influencing the life cycle of flu-like epidemics, the objective of this study is to falsify the hypothesis that there are no inverse associations between allergenic and non-allergenic pollen counts, and flu-like epidemic life cycles and incidence in The Netherlands, including COVID-19, and develop a simple, discrete model helping to predict pollen-flu seasonality switches.
Method
To study the relation between pollen and flu-like incidence in The Netherlands, we used the public data sets of Elkerliek Hospital (Elkerliek.nl) about the weekly allergenic, non-allergenic and total pollen counts in The Netherlands in grains/m3. Total pollen count is the combination of allergenic and non-allergenic pollen counts. Further, we use the data from the Dutch State Institute for Public Health (RIVM.nl) gathered by Nivel (Nivel.nl) about weekly flu-like incidence (WHO code “ILI”) reports at the primary medical care, per 100,000 citizens in The Netherlands with a population of currently 17.4 million. ILI (influenza like illnesses) is defined as a combination of a measured fever of ≥ 38 °C, and cough, with an onset within the last 10 days. The flu-like incidence metric is based on a representative group of 40 primary care units, and calculated using the number of influenza-like reports per primary care unit divided by the number of patients registered at that unit, averaged for all primary care units, and next extrapolated to the complete population. Compared to our previous study (Hoogeveen, 2020), we have expanded the datasets with 42 weeks so that it now runs from week 1 of 2016 till week 18 of 2020 (n = 226 data points) to include the recent COVID-19 pandemic in the tail-end of flu season. Further, we have added the non-allergenic pollen counts to the allergenic ones as it does not matter for the bio-aerosol filter function whether pollen is allergenic or not.
Further, we added the meteorological datasets form the Royal Dutch Meteorological Institute (KNMI.nl), including relative humidity/day, average temperature/day and global solar radiation in J/cm2 per day as an indicator of UV radiation, from its centrally located De Bilt weather station, and calculated the weekly averages for the same period.
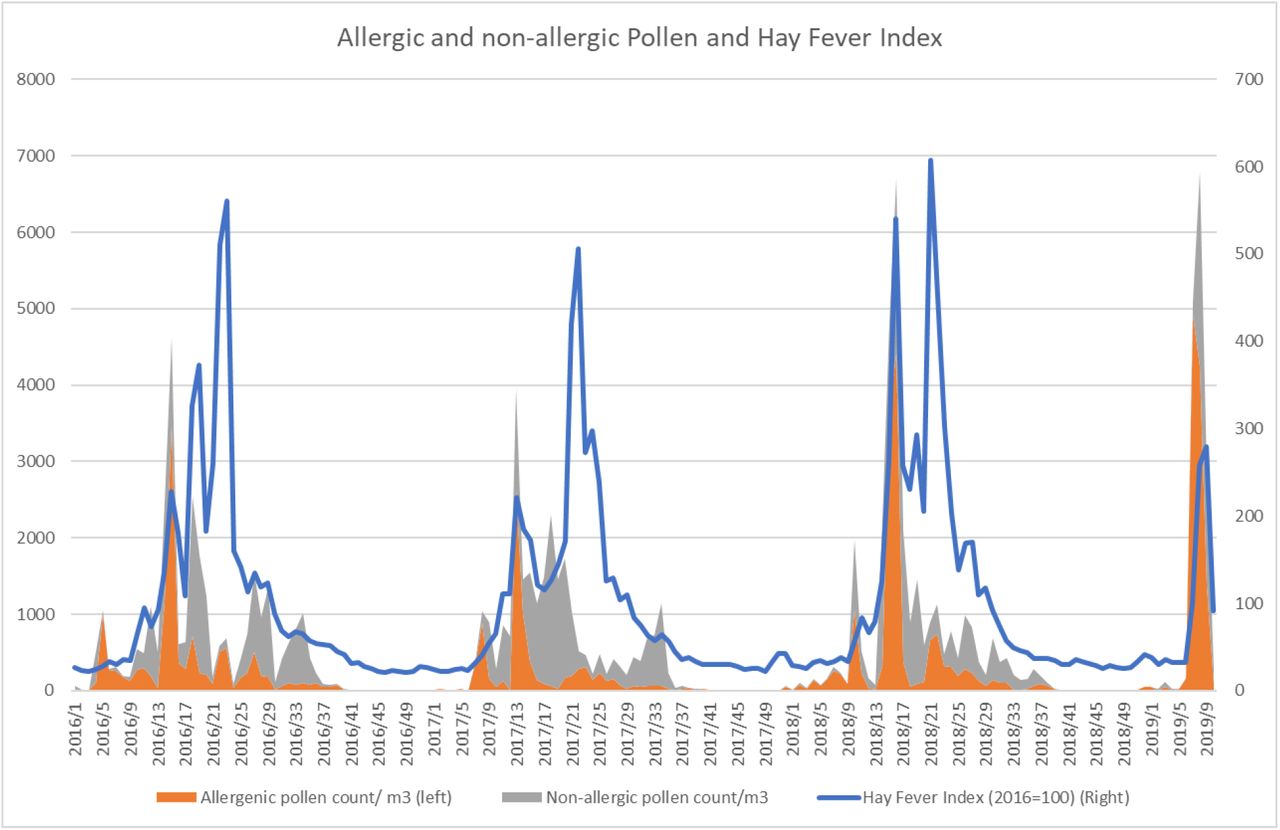
To test allergenic versus non-allergenic pollen assumptions, against hay fever and pre-covid-19 flu-like incidence, we make use of the hay fever index. The hay fever index is defined as turnover for hay fever medication as reported by all Dutch pharmacies to the Dutch Central Bureau of Statistics (CBS.nl) based on respective ATC codes (R01A/R01AC). We use a dataset from week 1 of 2016 till week 10 of 2019 (n = 166 data points), as no further data has been made available.
There is no missing data in the data sets, except that there are only three weekly pollen counts missing because of a malfunctioning metering station. We used a 4 weeks surrounding average to estimate the three missing data points to avoid breaking lines in visuals. However, given the large number of 226 data points, and by using this trend-based average, we assume that these missing data have no material impact on the results.
Regarding the incidence of flu-like symptoms, we calculated the weekly change compared to the previous period to get an indication of the flu-like epidemic life cycle progression, whereby a decline is interpreted as Ro<1 and an increase as Ro>1 (Ro is the reproduction number of flu-like viruses). Further, to cover, in one time-series metric, for changes in flu-like incidence as well as an incubation period of up to two weeks, we calculated a three weeks moving average (3WMA) of changes in flu-like incidence, of which two weeks are forward looking.
We tested the following statistical null hypotheses:
H10: there are no inverse correlations for non-allergenic and total pollen counts with flu-like incidence (corrected for incubation period).
H20: there are no inverse correlations between pollen and changes in flu-like incidence (corrected for incubation time 3WMA).
Checking assumptions
H30: non-allergenic pollen has no effect on hay fever.
H40: meteorological variables – solar radiation, temperature and relative humidity – have no effect on pollen and flu-like incidence change (3WMA).
H50: there is no predictive significance of a discrete model’s compound value, based on pollen and solar radiation thresholds, on changes in flu-like incidence (3WMA).
Note that except H3, all hypotheses are related to potential causality: the temporal sequentiality of the respective independent variables, and flu-like consults corrected for incubation period.
Statistical analyses
Variables are presented with their mean and standard deviation (SD).
We calculated correlation coefficients to do a first test of hypotheses, as data sets show normal distributions, to assess the strength and direction of relationships. Next, linear regression (F-test) on identified inhibitors and interactions is used to determine the linear equation using estimates and intercept values, and produce the test values such as probability, significance level, F-value, and the Multiple R squared correlation to understand the predictive power of the respective inhibitor. Standard deviations and errors, and degrees of freedom (DF) are used as input for calculating the 95% probability interval. We report the outcome of statistical tests in APA style. Simple calculations as averages and SDs per dataset are calculated in Excel (STDEV.S function).
Second, we created a simple, discrete model using selected flu-like inhibitors, to determine the optimal threshold values for these inhibitors which have the highest joint correlation with changes in flu-like incidence (3WMA), and test the final discrete model in a linear regression test (F-test) to understand its predictive power and determine the linear equation when significant.
It is outside of the scope of this research to verify the underlying data sets of Elkerliek Ziekenhuis, RIVM/Nivel, CBS, and KNMI by examining the validity and reliability of data collection methods.
All regression analyses are done using the statistical package R version 3.5.
Results
The mean value and standard deviation for all pollen are 732 grains/m3 per week (SD: 1368), for allergenic pollen 349 grains/m3 per week (SD: 987), for non-allergenic pollen 383 grains/m3 per week (SD: 626) and for flu-like incidence 47 consults/100K citizens per week (SD: 40.2).

Total pollen counts vs flu-like incidence in The Netherlands on a logarithmic scale, whereby passing the 610 total pollen grains/m3 per week threshold marks the seasonal switch.
When further inspecting the data sets regarding pollen counts and flu-like consults at primary medical care in The Netherlands, it is clear that there are continuous pollen bursts (Figure 2), whereby only a few of these pollen bursts are classified as allergenic (Figure 4). These bursts of pollen, allergenic or non-allergenic, typically coincide with and precede a decline of flu-like consults.
In our previous study, we found a significant inverse association between allergenic pollen counts and changes in flu-like incidence, but no significant inverse correlations between allergenic pollen counts and flu-like incidence due to the short and extreme bursts of these allergenic pollen (Hoogeveen, 2020). However, the addition of non-allergenic pollen reveals highly significant negative correlations (r(224) = –.19, p < .01) with flu-like incidence, which become stronger when correcting for two weeks incubation time (r(222) = –.31, p < .00001). We can thus reject the null-hypotheses (H10) that non-allergenic pollen, has no negative association with flu-like incidence, including the first cycle of the COVID-19 pandemic, and thus we cannot rule out the non-allergenic pathway. That the associations become stronger when taking into account incubation time, implies temporality, also in the case of total pollen count (see Table 1). Furthermore, we can also observe from Figure 2 that flu-like consults start to decline after the first pollen bursts. And that flu-like consults start to increase sharply after pollen counts become very low or close to zero. This adds to the sense of causality as well. Further, we can notice that the first COVID-19 cycle behaves according to pollen-flu seasonality.
Correlations between flu-like incidence and total pollen and non-allergenic pollen. (n.s.: not significant, * p < .05, ** p < .01, *** p < .001)
These findings indicate that it makes sense to include the so-called non-allergenic pollen in our model and pollen tests as well.
When testing the impact on the changes in medical flu-like consults (mean: –0.25, SD: 15.4), the extended dataset till 2020, including COVID-19, shows a stronger and highly significant inverse correlation with allergenic pollen (r(223) = –.23, p = .000413) compared to our previous study. For total pollen, including non-allergenic pollen, the association is even somewhat stronger (r(223) = –.27, p = .000059). Therefore, we can falsify the null-hypothesis (H20) that there are no inverse correlations between the weekly pollen counts – total or only allergenic – and changes in flu-like incidence, including the period covering the first cycle of the COVID-19 pandemic. These inverse correlations provide thus further support for the alternative hypothesis that the presence of an elevated level of pollen has an inhibiting effect on flu-like incidence, and starts to immediately influence the direction and course of the epidemic life cycle. COVID-19 behaves according to the expected pollen-flu seasonality, like all other flu-like pandemics have since the end of the 19th century.
Using the three weeks moving average (3WMA) of changes in flu-like consults (mean: –0.26, SD: 8.9), the correlation coefficients become stronger and are again all highly significant for both allergenic pollen (r(224) = –.34, p < .00001) and total pollen count (r(224) = –.38, p < .00001). We can thus also reject the null-hypothesis (H20) that there is no inverse relation between pollen and changes in flu-like consults (3WMA). As this correlation is stronger than if not corrected for incubation period, it is a further indication of temporality, and as they are stronger now with the 2019/2020 flu-like season included, it further supports the idea that COVID-19 is subject to pollen induced flu-seasonality as well.
Linear regression analysis shows that there is a highly significant inhibitory effect of pollen on flu-like incidence change (3WMA) of F(1, 222) = 37.1, p < .001 (see Table 2 line 1), as a further basis for using total pollen count as a predictor.
Summary of univariable regression analyses of pollen (1), solar radiation (2) and our compound pollen/solar radiation predictor (3) on changes in flu-like incidence (3WMA) showing all highly significant (p < .001) results, but the correlation for solar radiation is weak (.06) and the compound predictor the strongest (.23).
Previously, we established a highly significant inverse correlation of r(164) = –.34 (p = .00001) between the hay fever index (mean: 101 SD: 115.7) and flu-like medical incidence (Hoogeveen, 2020). Univariable regression analyses show that there is a highly significant positive effect of all pollen on hay fever incidence, which in turn has a highly significant inhibitory effect on flu-like incidence (see Table 3). In line with the association between pollen and flu-like incidence, the inverse association between total pollen count and hay fever is stronger (r(164) = –.51, p < .00001) than those for allergenic and non-allergenic pollen individually. This confirms that we can best use total pollen count as predictor. Counter to expectation, non-allergenic pollen has a highly significant effect on hay fever as well (r(164) = .48, p < .00001). We can thus reject the null-hypothesis that non-allergenic pollen (H30) has no effect on hay fever. This might imply that pollen classified as non-allergenic might still be responsible for certain allergic effects, and not just allergenic pollen. Therefore, trying to use non-allergenic pollen to discriminate effects outside the allergenic path regarding the immune system might be challenging.
Summary of univariable regression analyses of total pollen count on hay fever (p < .001) and hay fever on flu-like incidence/100K citizens per week (p < .001), whereby pollen leads to an increase in hay fever, which in turn is associated with a decrease in flu-like incidence.
Given the scatter diagram in Figure 3, the nature of the relation between hay fever and flu-like consults, might however not be strictly linear, but logarithmic. Such a logarithmic relation might support the idea that switching thresholds are important to understand the relation between the independent variables and flu-like incidence.
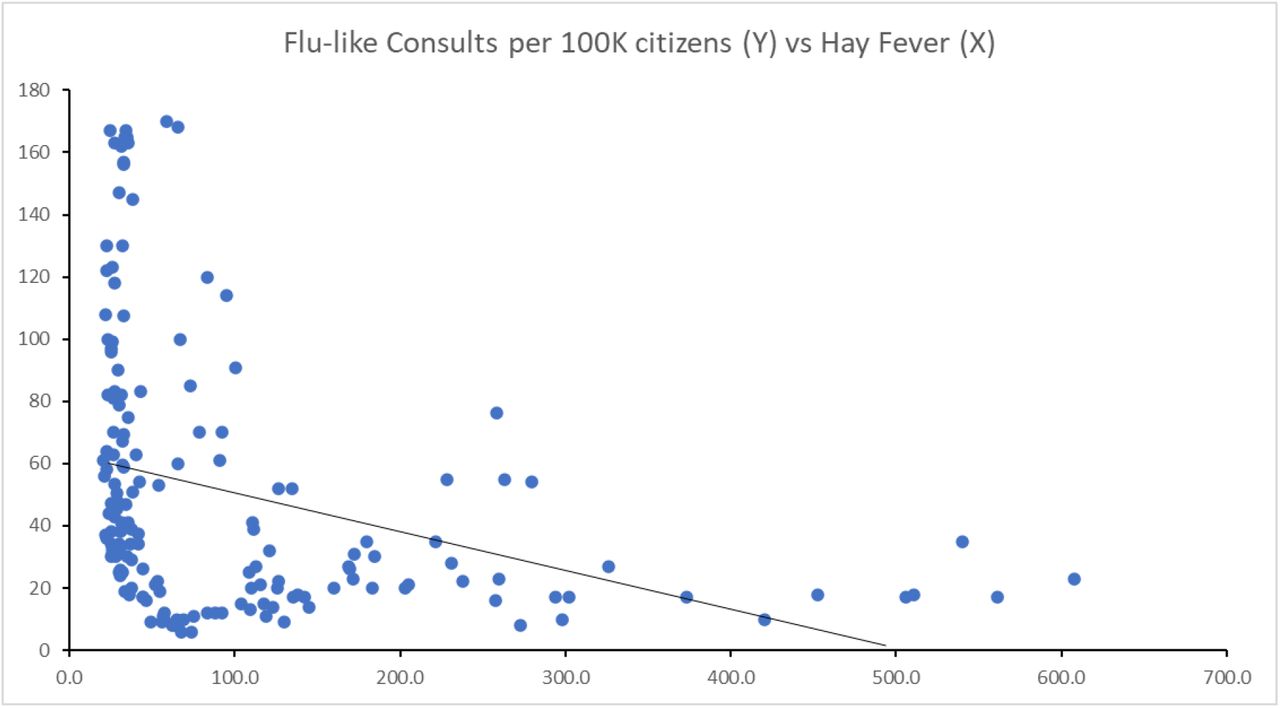
hay fever is inversely associated with flu-like incidence (r(164) = –.34, p < .01) and the regression equation is: Y = –0.1268*X + 63.82.
Both allergenic and non-allergenic pollen are associated with hay fever.
The expected effects of relative humidity (r(224) = –.46, p < .001), temperature (r(224) = .10 n.s.) and solar radiation (r(224) = .35, p < .001) on pollen are found. So, there is more pollen with sunny, warmer and dry weather. We can reject the null-hypothesis that meteorological variables (H40) have no effect on pollen, for solar radiation (mean: 1047, SD: 709) and relative humidity (mean: 79, SD: 8.3), but not for temperature (mean: 10.8, SD: 5.8), whereby relative humidity is reducing the amount of aerosol pollen. The relation with temperature might only be significant during the start of pollen season as it is known to shift the pollen calendar.
Counter to findings in other studies, relative humidity is positively associated to changes in flu-like incidence (3WMA) in The Netherlands (r(224) = .34, p < .00001). Dutch flu season is cold and humid, and on rainy days the effect of pollen is reduced. Although temperature strongly correlates with flu-like incidence (r(226) = –.71, p<001), it has a neglectable effect on changes in flu-like incidence (r(224) = –.02 n.s.) and it doesn’t change with incubation time. Therefore, temperature has likely no direct effect on aerosol flu-like viruses and the life cycle of a flu-like epidemic. In line with this, temperature is also not a good marker for the onset or the end of flu season as the end of flu season (Ro<1) can coincide with an average temperature of close to 0 °C and the start of flu season (Ro>1) can coincide with temperatures as high as 17 °C in The Netherlands.
Only for solar radiation there is a highly significant inverse association with changes in flu-like incidence (3WMA) (r(224) = –.25, p = .000156), so it is not unlikely that apart from its indirect effects, it is playing a role in destroying the aerosol flu-like viruses before they can infect someone.
Thus, from the meteorological variables, for solar radiation and relative humidity the null-hypothesis (H40) can also be rejected for that they have no effect on the flu-like epidemic lifecycle. But, of these two only solar radiation is a flu-like inhibitor in line with its positive effect on pollen count.
A simple regression test confirms that there is a highly significant inhibitory effect for solar radiation on flu-like incidence change (3WMA) (F(1, 222) = 14.43, p < .001 (see Table 2 line 2). As the correlation is weak (Multiple R-squared = .06), we can see solar radiation only as a supportive factor to pollen.
Taking into account all these findings, we developed a discrete, compound model in which we take the changes in flu-like incidence (3WMA), a threshold value for solar radiation (kr), and both pollen threshold values for allergenic (kap) and all pollen (kp). We found that the compound model (mean: 1.4, SD: 1.1) has the highest inverse correlation (r(222) = –.48, p < .001) for the following threshold values: kr: 510 J/cm2, kap: 120 allergenic pollen grains/m3 per week, and kp: 610 total pollen grains/m3 per week. In line with the previous outcomes, inclusion of relative humidity, non-allergenic pollen or temperature did not improve the correlation strength of this model. As they also did not show significant interaction effects with pollen, also such interactions are not meaningful to consider for the model.
In each of the observed years the now (re)defined pollen thresholds are being past in week 10 (± 5 weeks) depending on meteorological conditions controlling the pollen calendar, which coincides also with reaching flu-like peaks, and again in week 33 (± 2 weeks) marking the start of the new flu-like season.
There is a highly significant inhibitory effect of our compound thresholds based predictor value (outcomes are in the range [0, 3]) on flu-like incidence change (3WMA) of F(1, 222) = 65.59, p < .001 and a Multiple R-squared correlation of 0.2281 (see Table 2 line 3). This confirms the usefulness of a discrete, pollen and solar radiation thresholds based model as a predictor of switches in flu-like seasonality, whereby the effect of pollen is stronger than that of solar radiation. As a consequence we can reject the null-hypothesis (H50) that this compound pollen/solar radiation value has no predictive significance for flu-like seasonality.
Discussion
We found highly significant inverse relations between pollen and (changes in) flu-like incidence: a higher number of pollen associates with a decline in flu-like incidence. This association becoming stronger when including the 2019/2020 period. Therefore, we conclude that also COVID-19 is subject to pollen-flu seasonality as all previous pandemics since the end of the 19th century.
When taking into account all pollen, both allergenic and non-allergenic, the inverse association between the increment of pollen and decline of flu-like incidence becomes stronger. This finding is in line with our virus filtering aerosol hypothesis in which aerosol pollen de-activate aerosol viruses before they can infect a new host. However, as so-called non-allergenic pollen also contributes to the incidence of hay fever in our study, another explanation might be that non-allergenic pollen have immuno-activating effects as well. Therefore, we included the total number of pollen as a predictor of flu-like seasonality, not just the number of allergenic pollen. The fact that the inhibitive effects of pollen gets stronger when taking into account an incubation period of up to two weeks strengthens the idea of causality.
The highly significant inverse association between hay fever and flu-like incidence can be interpreted in a number of ways, which are not mutually exclusive. A) Allergic rhinitis symptoms might make it more difficult for flu-like viruses to find their way to the lung cells that are vulnerable to it, such as ACE-2 receptor positive cells in case of SARS-CoV-2 (Wan et al., 2020). B) The application of hay fever medication – the basis of the index – likely reduces over-reporting (false positives) of flu-like incidence because they suppress symptoms that are typically confused with flu. C) The anti-histamine hay fever medication possibly suppresses flu-like symptoms as well. In this respect interesting to note that COVID-19 patients typically suffer from an over-expression of the immune system.
The only meteorological variable that has a co-inhibitive effect on flu-like life cycles, solar radiation, has a stimulating effect on aerosol pollen formation, and is responsible for melatonin-induced immuno-activation. Relative humidity reduces pollen aerosol formation, and correlates positively with flu-like incidence. In our study we showed that temperature, except for influencing the onset of pollen season, has no predictive value for the flu-like lifecycle, and therefore its inverse correlation with flu-like epidemics is probably spurious: the common causal factor seems to be solar radiation.
We showed that a compound model, based on threshold values for pollen and solar radiation, results in a stronger association with the flu-like lifecycle than the individual inhibitors. This model could form an empirical basis for testing flu-like seasonality, reliably predicting the start and end of each flu-like cycle.
A plausible explanation of the beneficial effect of allergenic pollen consists of the well-established induction by pollen of flu-like symptoms or allergic rhinitis, that might block viral pathways via the respiratory system, including general anti-viral immune responses. Interesting in this respect is that in some studies “other allergic diseases” are absent as a co-morbid condition of COVID-19 (Zhang et al., 2020), although more confirmation is needed. As the prevalence of allergic rhinitis in Western Europe is around 23% and frequently undiagnosed (Bauchau & Durham, 2004), and the prevalence of allergic diseases in general in the Netherlands is around 52% (Van de Ven et al, 2006), the allergenic path provides a plausible explanation for an inhibitory effect of pollen on flu-like epidemics.
A second explanation of the beneficial effect of aerosol pollen might be their direct anti-viral properties, and an interaction that prevents viruses to effectively reach new potential hosts.
Meteorological variables such as increased solar radiation and temperature are not only triggering pollen ripening, but also affect the bio-aerosol formation: dry and warm conditions stimulate pollen to be airborne, and makes the bio-aerosol more hostile to flu-like viruses as it occasionally might reach sterilizing temperatures. Rain, to the opposite, makes pollen less airborne, cools the bio-aerosol down, and very high humidity levels (RH 98%) are even detrimental for pollen (Guarnieri, 2006). The RH 98% effect on pollen, could thus provide an alternative explanation of why flu-like incidence in tropical countries is higher during rainy season, and reduced during the rest of the year.
A third explanation might be related to circadian and seasonal rhythms being coded into the functioning of our immune system, “switching off” to a lower gear during the night, and Autumn/Winter, and “switching on” during day light and Spring/Summer. Not only solar (UV) radiation and temperature, but also pollen, could function as a gene-coded trigger associated to the un-depression of the immune system, which would make evolutionary sense as pollen is the distinct harbinger of the seasons of opportunity.
The emergence at the tail-end of flu season of COVID-19 and other pandemics makes sense as well as it takes time for a spontaneous new cross-over virus with a sufficiently high reproduction number Ro – for SARS-CoV-2 it is estimated to be initially around 3 (Liu et al., 2020) – to develop from patient 0 to a full-fledged pandemic during flu season on the Northern Hemisphere. Chances for the Northern Hemisphere with its larger populations are higher to be the initial breeding ground for a new flu-like pandemic than the Southern Hemisphere.
It will require further research to test the findings, threshold values and predictive model for flu seasonality in other countries with different climates, pollution levels (Coccia, 2020), and effects of climate change (Frei & Gassner, 2008) and behavior (Gozzi et al, 2020). A consequence of our findings could potentially be that social distancing and other preventive behavior are especially important during flu-like season, but probably less relevant during pollen season when nature takes care by inhibiting viruses.
Further, it is good to understand better the interaction between aerosol pollen and flu-like viruses, including their anti-viral properties. Another question is whether immuno-activation by pollen is indeed a causal factor in reducing the spread of flu-like viruses and whether that depends on anti-viral immune responses or indiscriminate ones. Understanding this might lead to new therapeutic approaches.
On the basis of current data, we can conclude that also the covid-19 pandemic is seasonal and as a consequence multicycle, and will thus likely return from week 33 on, like all other flu-like viruses, when pollen season is over in the Northern Hemisphere. It is important to be prepared for it as long as there are no effective vaccines or therapies and as long as its herd immunity (Fine et al., 2011) is still below required thresholds for ending pandemics (Plans-Rubió, 2012).
Data Availability
All datasets are based on public datasets in The Netherlands to which we have referred in the paper, and our datasets are available for review.
Acknowledgements
thanks to Sowjanya Putrevu, data scientist at Icecat, for her voluntary support with executing statistical tests.


