
Abstract
Background Cumulative CoViD-19 deaths per capita is often used to compare the progression of the disease across populations. For more meaningful comparisons, this article discusses alternative measures based on well-established practices in demography.
Methods Using extant estimates, we calculate a rate of CoViD-19 mortality to date for 263 countries, territories, provinces in China and US states. We indirectly age-and-sex standardize this rate using population age-and-sex distributions for 250 of them. Using extant projections, we calculate future unstandardized and standardized rates and the reduction in 2020 life expectancy at birth by sex for 103 countries and states.
Results The highest rate to date is for New York, where it exceeded the 2017 Crude Death Rate between mid-March and mid-May. Relative to the US, standardization lowers European rates but increases rates in South America. Rates are projected to increase further and reductions in 2020 life expectancy at birth to amount to 1.1 to 1.2 years in Brazil, Chile and Peru. Larger reductions are projected for 6 US states, reaching 2.08 years for males in New York.
Conclusions Lowering US life expectancy at birth to its lowest level since 2008, the projected.53-year reduction can be compared to the largest single-year decline the country experienced during the HIV epidemic, -.3 year, which also equaled the recent decline induced by opioid overdoses over several years. Uncertainty about CoViD-19 trajectories remains substantial, but these figures seem more likely to under-than to over-estimate the eventual mortality impact of CoViD-19.
Background
As of June 1st, deaths from the novel coronavirus disease 2019 (CoViD-19) had been reported in 186 of the 235 countries and territories of the United Nations system (UN). As with previous pandemics,1 the disease progression has been more reliably tracked with death than with case counts. Cumulative CoViD-19 death counts at a given time depend on the determination of the cause of death, delays in reporting deaths to central reporting agencies—different for deaths at home, in hospitals and other institutions—and delays in verification, consolidation and publication at reporting agencies. Comparability biases are introduced at each of these steps, but likely remain minor relative to biases in estimating the number of cases in the population induced by differences in testing in particular.2 CoViD-19 death counts are also more pertinent measures of public-health measures intended less to reduce the eventual number of cases than to “flatten the curve” so that the need for emergency hospitalizations would remain below local hospital capacity.
For comparative purposes, several demographic characteristics also affect cumulative death counts. The number of deaths is often related to the population size—the most obviously pertinent demographic parameter. This death per capita ratio, however, represents the first rather than the only step that can be taken towards more meaningful CoViD-19 mortality comparisons. Following well-established practices in demography,3 this article presents additional steps that might be taken provided data requirements are met. The corresponding measures are then discussed using results for the 186 UN countries and territories with at least one death by June 1st. To illustrate the issue of scale as well, the measures are also calculated for each of the U.S. states and 26 provinces in China—thus for a total of 263 populations.
Methods and Data
We first calculate a period rate of occurrence/exposure rate, the Crude CoViD-19 Death Rate (CCDR):
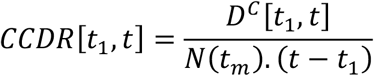 where t1 is an initial time, DC[t1,t] a cumulative CoViD-19 death count at time t, and N(tm) an estimate of the total population size at time tm between time t1 and time t. The difference between this rate and the death per capita ratio can easily be missed when the number of deaths in the numerator, identical for both, is an annual number of deaths. In that case, the number of person-years in the denominator of the period rate can indeed be approximated by population size at some point during the year. However, the two are no longer directly comparable, and the metric of the ratio difficult to interpret, when death counts correspond to periods of variable duration. On the contrary, the CCDR is expressed in deaths per person-year and remains directly comparable to the annual Crude Death Rate (CDR) available for most populations. For the 186 UN countries and territories, we first calculate the CCDR for the period starting on the day of the first death in the population, which was obtained from World Health Organization (WHO) daily situation reports,4 and ending on June 5. The estimated death count on that day was obtained from Johns Hopkins University’s Center for Systems Science and Engineering (CSSE)5 and total population size was obtained from the UN.6 (Refer to the technical appendix for additional sources used for the provinces of China and US states.) We also calculate a CCDR for the period ending on August 4, using projections from University of Washington’s Institute for Health Metrics and Evaluation (IHME)7 for 52 countries and the each of the US states.
When death rates vary by age and sex, which has been clearly established for CoViD-19 mortality by data from several countries, 8,9,10 this period rate should be adjusted to take into account different age and sex population compositions. Direct age-and-sex standardization would require counts of CoViD-19 deaths by age and sex, which are not available for a majority of the 263 populations considered here. An alternative approach, known as indirect standardization, borrows an age-and-sex pattern of mortality from a well-documented population and only requires the age-and-sex composition of the different populations. Based on this approach, we calculate the Comparative CoViD-19 Mortality Ratio (CCMR):
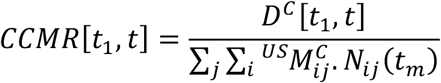 where
where  is the CoViD-19 death rate specific to age group i and sex j in the U.S.A. and Nij(tm) is the size of the age group i for sex j in the population of interest. The required reference age-and-sex death rates were obtained from the Centers for Disease Control and Prevention (CDC) weekly-updated distribution of CoViD-19 deaths by age and sex in the U.S.A., selected because this is the largest number of CoViD-19 deaths distributed by age-and-sex death rates available to date. Population age-and-sex distributions were taken from the UN data, unavailable only for the 13 countries/territories with a population size under 90,000. Multiplying the CCDR by the US CCDR yields an Indirectly age-and-sex Standardized CoViD-19 Death Rate (ISCDR) with the US age-and-sex population distribution as the standard:
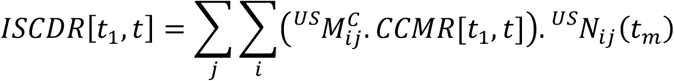
CCMR and ISCDR are again calculated both for CSSE current estimates (250 populations) and IHME August-4 projections (103 populations).
Last, life expectancy at birth provides a summary indicator of mortality in a population in a more intuitive metric (years) than these rates. A standard demographic technique allows to estimate the impact eliminating a cause of death would have on life expectancy at birth. When a prior period life table (i.e., not factoring CoViD-19 mortality) is available, applying this technique backward allows to translate a cumulative CoViD-19 death forecast for the same period into a CoViD-19-induced reduction in male and female life expectancy at birth. The IHME projections were used as estimates of the 2020 number of CoViD-19 deaths to derive new male and female life expectancy at birth estimates in these 103 populations. These calculations required a previous projection of the male and female year-2020 life tables in these populations. For countries, these were again derived from UN data, by interpolation between the 2015-20 estimates and 2020-25 projections. For US states, the tables were extrapolated from CDC data for years up to 2016.
Additional details on the calculation of these various indicators are described in the online supplementary materials of this article. These results are updated weekly from updates of the CCSE, IHME and CDC data and shared on a Github repository.11
Results
We briefly describe the value of these indicators based on June-8 updates of the CCSE, IHME and CDC data. (Full results for that week, ranked on CCDR values, are also available in the online supplementary materials of this article). Across countries with a population size of 90,000 or more, the highest current-period CCDR value is for Belgium (3.68 per thousand), followed by 7 other European countries and the U.S.A. (1.26 per thousand).
New York (6.73 per thousand) and 4 other US states have higher current-period CCDR value than Belgium, however. In New York, the period CCDR is now declining. Up to mid-May, the current period CCDR was higher than the state’s most recent annual CDR (7.83 per thousand in 2017),12 reflecting the fact that between mid-March and mid-May more deaths from CoViD-19 were reported than deaths from all other causes in an average two-month period in 2017.
The effects of indirect age-standardization are illustrated in Figure 1, comparing current-period CCDR and ISCDR values in the 11 countries and 6 states with a CCMR of 1 or more and a population size over 10 million. By construction, the US CCMR equals 1 and the CCDR and ISCDR are the same. For European countries, the standardized ISCDR is lower than the unstandardized CCDR. This may affect country rankings: France and the Netherlands, for instance, have higher unstandardized but lower standardized rates than the U.S.A. On the contrary, standardization leads to substantially higher rates in the 3 South American countries. It more than doubles in Ecuador for instance (from .88 to 1.83 per thousand).

Estimated value of the CCDR and ISCDR, and projected value of the ISCDR, by country and state (in deaths per 1,000 person-years, countries and states with an estimated CCMR of 1 or more and population size over 10 million)
Figure 1 also illustrates the projected trajectories in these 17 populations by comparing current-period and projection-period values of the standardized rate. Among these countries, the standardized rate is only projected to be higher by August 4 than it is now in Brazil and, most notably, Peru, where it is expected to increase from 1.35 to 2.59 per thousand.
Based on the IHME projections, 2020 life expectancies at birth are expected to be lower than previously projected by more than half of year in the U.S.A., Ecuador and 7 European countries (up to -.9 in Belgium), and by 1.1 to 1.2 years in Brazil, Chile and Peru. Larger reductions still are projected in 6 US states, reaching 2.08 years for males and 1.86 for females in New York. To put these figures in perspective, the US.53 reduction would induce a larger single-year decline in life expectancy at birth than during each of the last two public health crises in the U.S.A.: a decline from 75.8 in 1992 to 75.5 years in 1993 (HIV/AIDS-related mortality) and from 78.9 years in 2014 and 78.6 years in 2017 (opioid-overdose-related mortality).13 As illustrated in Figure 2, it would more than eliminate any longevity gain the country could have made over a 12 years period (2009-2020).

Estimated life expectancy at birth, U.S. population, both sexes, by year
Sources. 2009-1017: CDC, 2017-2020: UN and authors’ calculations (see technical appendix)
Discussion
The results above are intended to illustrate the properties of the different indicators for comparisons of CoViD-19 mortality across populations and with overall mortality. For comparisons across populations, the ISCDR, and CCMR on which it builds, control for 3 important determinants of cumulative CoViD-19 deaths in a population: the length of the period over which these deaths are cumulated, the size of the population, and its age-and-sex composition. Caveats are in order with respect to each of these three components. First, both the unstandardized and indirectly standardized rate are period indicators that increase and decrease as waves of the pandemic develop. Contrary to the death per capita ratio, which can only increase over time, the period rates begin to decline when the daily number of additional deaths drops below its average for the period. This property of the period rates accurately reflects for CoViD-19 mortality a temporal dimension that can often be neglected for overall mortality. This also implies, however, that comparing ISCDR values across populations at too different durations of exposure to CoViD-19 would not be meaningful.
Second, with respect to population size, comparing ISCDR values in the U.S.A. and across the different states illustrates how conclusions may differ depending on the scale at which comparisons are performed. Belgium ISCDR may be the highest of any country, but it is lower than in 4 US states more comparable in population size (ranging from 3.6 to 19.8 million v. 11.6 million for Belgium) than the whole U.S.A. With a similar population size as well, Lombardy (Italy) has a ratio of CoViD-19 deaths per capita 2.9 times the national average, suggesting an ISCDR value around 3.76 for the province (assuming the same population composition as Italy, result not shown). This would place the province above Belgium and only below New York and New Jersey. At this point, we only present results below the country level for UN territories, provinces in China, and US states. We prioritized these two countries both because of their size and within-country differences in CoViD-19 prevalence. New York ISCDR is more than 5 times the US average, whereas Hubei’s is 18 times the average for China. Results would also be more meaningful at the province/state level in other large countries like India or Brazil, although their within-country differences do not appear as strong at the moment. Further disaggregation may even prove more informative depending on the type analysis.
Third, with respect to age-and-sex variations, the indirect standardization performed in the computation of the ISCDR circumvents the need for data on CoViD-19 deaths by age and sex which may not be available for many populations. For comparisons across populations for which these data are available, however, direct standardization might be preferable. Indirect standardization relies on an assumption of similarity in age-and-sex patterns of CoViD-19 mortality which warrants further investigation as data on these patterns become available for additional populations. Patterns of CoViD-19 mortality that deviates from the US pattern may bias the ISCDR value as well as the estimated impact on life expectancy at birth for a given population.
This source of bias probably remains secondary given remaining uncertainties about the direct and indirect mortality impact of the pandemic. Regarding the impact to date, the main factors of uncertainty are rather (1) the degree to which CoViD-19 has been properly identified and reported as the cause of death and (2) the “downstream” effects of the pandemic and mitigating policies on mortality from other causes. CDC data on excess deaths14 shows that for the 8-week period ending on May 16, the number of deaths in the U.S.A. exceeded expectations based on past trends by over 107,000 at a time when the country’s cumulative CoViD-19 deaths count stood at 86,000. All else equal, life-expectancy reductions would be larger than estimated here, whether CoViD-19 deaths are under-reported or mortality from other causes has also increased, since reductions are estimated on the assumption that mortality from other causes remains unchanged.
Obviously, there are even greater uncertainties about the cumulative impact for the year 2020. The CDC currently tracks no less than 15 forecasting models.15 Our choice of the IHME projections among those to illustrate the properties of the different indicators was not based on a quality assessment, which would be beyond our expertise. The IHME projections have a broader international coverage and longer time horizon than most other models. Comparisons with other models when populations and horizons overlap do not show the IHME projections as particularly alarmist. Adding that the current projections do not include any CoViD-19 deaths past August 4, the eventual impact on life expectancy at birth in 2020 appears more likely to be higher than lower the reductions calculated at this time.
The rapidly evolving data and understanding of CoViD-19 mortality will likely continue to require frequent updates and flexibility. Calculations presented here can easily be customized for different periods, different geographical scales, or to accommodate uncertainty across different sources of estimates and forecast.
Data Availability
All data are available online and can be accessed directly or through a web scraping routine that we provide at https://github.com/statsccpr/ind-cov-mort
https://www.arcgis.com/apps/opsdashboard/index.html#/bda7594740fd40299423467b48e9ecf6
Acknowledgment
The authors benefited from facilities and resources provided by the California Center for Population Research at UCLA (CCPR), which receives core support (P2C-HD041022) from the Eunice Kennedy Shriver National Institute of Child Health and Human Development (NICHD). The authors thank Patrick Gerland for clarifications regarding UN demographic data and Sam Preston for comments on an earlier draft.


