
Abstract
Importance Cases of the coronavirus disease 2019 (COVID-19) with no or mild symptoms were reported to frequently transmit the disease even without direct contact. The severe acute respiratory syndrome virus (SARS-COV-2) was found at very high concentrations in swab and sputum of such cases.
Objective We aimed to estimate in a mathematical modeling study the virus release from such cases into different aerosol sizes by normal breathing and coughing, and what exposure can result from this in a room shared with such as case.
Data Sources and Model We combined the size-distribution of exhaled breath microdroplets for coughing and normal breathing with viral sputum concentrations as approximation for lung lining liquid to obtain an estimate of emitted virus levels. The resulting emission data fed a single-compartment model of airborne concentrations in a room of 50 m3, the size of a small office or medical exam room.
Results The estimated viral load in microdroplets emitted by simulated patients while breathing normally was on average 0.0049 copies/cm3 and could go up to 24.5 copies/cm3. The corresponding numbers for coughing simulated patients were 277 copies/cm3 and 1,385,777 /cm3, respectively, per cough. The resulting concentrations in a room with a coughing emitter were always very high, up to 286 million copies/m3. However, also regular breathing microdroplets from high emitters was modelled to lead to several thousand copies/m3.
Conclusions and Relevance In this modelling study, breathing and coughing were estimated to release large numbers of viruses, ranging from thousands to billions of virus copies/m3 in a room with an emitter having a high viral load, depending on ventilation and microdroplet formation process. These findings suggest that strict respiratory protection may be needed when there is a chance to be in the same room with a patient - whether symptomatic or not - especially for a prolonged time.
Question How much SARS-CoV-2 virus is released from a case by breathing and coughing, and what is the resulting concentration in a room?
Finding In this mathematical modelling study, both, breathing and coughing were estimated to release large numbers of viruses, which can lead to billions of virus copies/m3 in a poorly ventilated room with a coughing emitter.
Meaning These results may explain the important rate of transmissions and implies the need for strict respiratory protection when people are in the same room with a case with COVID-19.
Introduction
The novel Coronavirus disease 2019 (COVID-19), emerged in late 2019 in Wuhan, China 1 from where it spread to the entire world. COVID-19 is caused by a novel type of Coronavirus, the severe acute respiratory syndrome virus (SARS-COV-2) 2. The host-receptor for SARS-CoV-2 was found to be Angiotensin I converting enzyme 2 (ACE2), which is present in cells of the lungs and airways 3. In the early phase of the outbreak, a large number of patients hospitalized for other reasons 4 and a considerable proportion of the medical staff 5 contracted COVID-19. However, the attack rate among medical staff corresponded to community rates when respiratory personal protective equipment (PPE) was used at work 6,7. Also a series of community-transmissions were reported from cases that had no apparent symptoms 8–11. The estimates for community and household attack rates are currently in the range of 1 % and 10 %, respectively 12–15. However, during super-spreading events in situations where many people engaged in loud voice activities gathered in closed rooms for prolonged time, such as a restaurant 16, a call-center 17, a dermatologists scientific board meeting 18, and a choir rehearsal 19 attack rates above 75% were reported. Notably, the choir rehearsal participants tried to follow social distancing and hand washing rules. These super-spreading events suggest that the airborne route may represent a virus transmission form in some indoor situations. Indeed, a study conducted in a Wuhan hospital found low airborne concentrations of the virus in the intensive care unit and in medical staff rooms 20. Correspondences about the viral load in samples from patients with COVID-19 having no or only mild symptoms reported very high concentrations of SARS-CoV-2 in samples taken in the nose, throat and saliva 11,21–23, and high during antiviral treatment 24. This all raised the question whether transfections could occur via the air.
When coughing, humans release thousands of microdroplets per cubic-centimeter in the size range of 0.6 to 15 µm, with the droplet concentration increasing strongly with cough flow rate 25. But also normal breathing will lead to some microdroplet production, which is attributed to fluid film rupture in the respiratory bronchioles during inhalation leading to the formation of droplets that are released during exhalation 26. The size of these droplets is mostly below 1 µm 27. The mode of droplet generation implies that they consist of lung lining liquid including dispersed viruses. Indeed, human volunteers exposed to virus-sized nanoparticles show nano-scaled particles in their exhaled breath 28,29. Also, the described size distribution of particles emitted from coughing as well as normal respiration suggests that an important proportion of them will be able to remain airborne for many hours in turbulent conditions 30.
Objectives
This study aimed to estimate the cumulative viral load released from simulated patients with COVID-19 with no to moderate symptoms in different microdroplet sizes via respiration and coughing. We then used this information to make a risk appraisal for the situation of a low, average or high emitter that is either breathing normally or coughing in a room operated at different air exchange rates. We chose a room size that is similar to a medical examination room or an office shared by two to three people.
Design and Methods
Concept
The release of viruses from individual simulated patients was modeled by first calculating the viral load per exhaled microdroplets formed during normal breathing and while coughing. The resulting size-distribution provided an initial estimate of the concentration of SARS-CoV-2 virus copies released by a regularly breathing or coughing simulated patient. This viral emission factor was then fed into a well-mixed one-compartment model to simulate the situation in a closed room with different ventilation air exchange rates. This study follows the concept of Strengthening The Reporting of Empirical Simulation Studies (STRESS) guideline 31. This mathematical modelling corresponds to a meta-analysis and was as such exempt from ethics approval.
Data sources
Data on the number of viral copies present in sputum and swab samples were used to estimate the SARS-CoV-2 viral load present in the lining liquid of respiratory bronchioles in patients published before the here presented modelling (May 2020) 11,21–24,32, specifically 1,000 copies/ml representing a low-virus producing patient (“low emitter”), an “average emitter” producing 10^6 copies/ml, and a “high emitter” producing 5*10^9 copies/ml. Exhaled microdroplet size distributions and numbers were retrieved from published studies on healthy persons coughing 25 and breathing normally 26. Both studies assessed the size-number distribution of freshly emitted microdroplets. The concentration of viral copies in each microdroplet size was calculated from the volume of the microdroplets, the actual count number in each size and the above-mentioned virus-load per ml sputum. The viral load in the actual microdroplet counts in each microdroplet size was then used to calculate the total viral concentration. The cumulative emissions in the PM10 fraction were summed up after applying the standard size fractionation curves 33 to the microdroplet distribution.
Model
A one-compartment model 34 estimated the virus load concentration C for a perfectly mixed room of volume VR of 50 m3 with one simulated patient as source, using the following mass-balance (equation 1):

The emission rate was calculated from the concentration cPM10, the viral load in the PM10-size range, which are particles collected with a 50% efficiency cut-off at 10 µm aerodynamic diameter; and a respiratory rate of 15 breaths per minute (RR) at a tidal volume of Vt of 500 ml per breath. Air exchange rates (ER) used were 1-, 3-, 10-and 20-times per hour. The virus’ half-life t½ of 1.1 hours was obtained from an experimental study about the persistence of SARS-CoV-2 on surfaces and when airborne 35, tested by assessing the 50% tissue culture infective dose (TCID50).
The model for coughing was identical, except that coughing was assumed to happen every 30 seconds at a volume of 250 ml, as described for chronic dry cough patient (not having COVID-19) 36.
All statistics and models were calculated using Stata/SE 15.1 (Mac 64-bit Intel, Rev. 03 Feb 2020, StataCorp, College Station, TX, USA). Robust data reported include estimated averages and ranges. The models and code are available on request.
Results
Emissions from normal breathing simulated patients
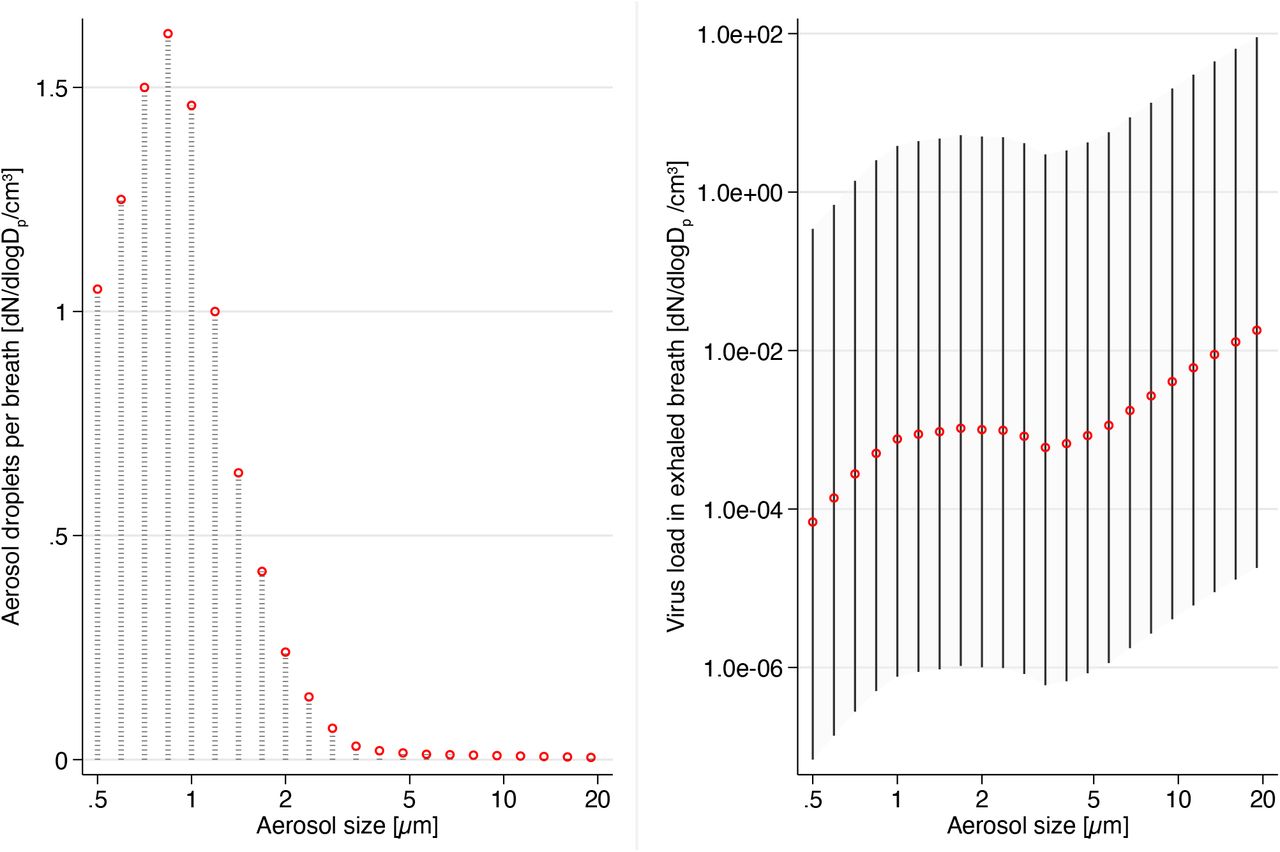
To estimate the virus emissions from simulated patients breathing normally, we first calculated the viral load for the microdroplet size distribution. Figure 1 shows that the highest virus load is present in the largest microdroplet size. The cumulative total emission per breath was 0.0000049 copies/cm3(air) for a low emitter, 0.0049 copies/cm3 for an average simulated patient, and 24.5 copies/cm3 for a high emitter. The cumulative emissions in the PM10 fraction were approximately 1/3 of these values with 0.0017 copies/cm3 (average) and 8.69copies/cm3 (high) per breath.

Size distribution of exhaled microdroplets (left) and resulting viral emissions (right) during normal breathing. The left panel shows the average exhaled microdroplet concentration used as input for the simulation, the right panel shows the modelled viral emission per breath for average (red), high and low emitters (spike-lines).
Emission from coughing simulated patient
We then estimated the virus emissions from a coughing simulated patient (Figure 2). The cumulative total emission per cough was 0.277 copies/cm3 for a low emitter, 277 copies/cm3 for an average simulated patient, and 1,385,777 copies/cm3 for a high emitter. The cumulative emissions in the PM10 fraction were about 1/2 of these values with 10,900 copies/cm3 (average) and 366,000 copies/cm3 (high) per cough.

Size distribution of exhaled microdroplets (left) and resulting viral emissions (right) during coughing. The left panel shows the average exhaled microdroplet concentration used as input for the simulation, the right panel shows the modelled viral emission per breath for average (red), high and low emitters (spike-lines).
Exposure estimation for bystanders
To estimate the exposure of bystanders spending time in the same room as a person with COVID-19, we calculated the time-course of the viral load in the thoracic size fraction for small droplets released from a high-emitter either breathing normally or coughing. Figure 3 shows the results for a high-emitting simulated patient coughing frequently.

Temporal course of airborne virus load in a perfectly mixed room of 50 m3. The simulation estimated the concentration in a closed room for different air exchange rates. The emitter was assumed to have a high virus-load in the lungs and to be coughing intermittently every 30 seconds.
For a typical hospital ventilation situation of 10 air exchanges per hour, the concentration plateaus after about 30 minutes, while for a typical office with 3 air exchanges/hour, concentrations continue to rise for over one hours. In the used model, concentrations scale linearly with the simulated patient emission rate, the plateau concentrations for different emitting simulated patients and ventilation types are summarized in Table 1.
Plateau concentration for different combinations of air exchange rate, emission form and emitter type.
Discussion
An elevated number of viruses is expected to be released by patients with COIVD-19 having high viral load in the form of airborne microdroplets, especially when they are coughing. While the bigger portion of the emitted viral load is in the form of large droplets that can deposit rapidly, there is also an important portion in the smaller size fractions. Small microdroplets can remain airborne for an extended time 30 and are very effective at reaching the lungs 37.
One study assessed airborne SARS-CoV-2 levels in a hospital in Wuhan, China and found concentrations in the range of 20 copies/m3 in medical staff offices and meeting rooms 20, concentrations that our modelling would suggest for a small room with a regularly breathing non-symptomatic person having a viral load slightly above an average emitter.
An average person breathes about a half m3 per hour in resting state 38, which can rapidly increase to several m3 during exercise 39. Thus, a person spending time in a room with an average emitting patient breathing normally has the chance of inhaling only a few copies of the virus when keeping distance from that person. However, the situation is worse in the presence of a high emitter and worst if the patient is a coughing high emitter. A review of a wide range of respiratory viruses suggests that the infective dose is often quite low. Sometimes as few as few hundred units of active virus (TCID50) 40 seem sufficient to provoke a disease. Thus, our modelling suggests that there is a clear risk of infections for a person spending an extended time in the room with an infected person having an elevated viral load, even if the distance is too large for direct transmission. The situation is worse if the person is coughing.
High emitters are not very frequent in the population. However, if such a person is engaged in activities such as loud speaking or singing, microdroplet formation and thus viral emissions can rapidly increase by one to two orders of magnitude 41. This may help explain the occasional superspreading events in crowded situations involving loud voices 16–19.
The occasionally very high virus load in exhaled respiratory microdroplets proposed by our assessment may be an explanation why COVID-19 was associated with more transfections to hospital staff than what was expected from SARS 4. While having everybody wear a surgical face mask can be an effective source control 42, the protective factors may still be insufficient if an extended amount of time is spent in the same room with a coughing high emitter, especially if the room is small and the ventilation low. Increasing ventilation can help to some extent but is not sufficient in a room of the size of a typical office or medical exam room. Note also that ventilation design for hospitals is complex and not always functioning as intended 43.
The implications for the normal life and the workplace are that the risk of infection is real when being near an infected person with high viral load in a room for more than a few minutes and this even when keeping distance to that person. Sharing a workplace in a small room with a non-symptomatic case seems not advised. This implies that workplaces should not be shared as long as there are no rapid tests to differentiate between healthy and non-symptomatic cases. Medical staff is advised to wear the best possible respiratory protection whenever in the same room as a patient, especially when this person is coughing, in which case eye protection is advised as well 44. In addition, every patient, also non-symptomatic ones, should wear a well-fitting surgical face mask to reduce emissions, which will increase the overall protection for the medical staff 42.
Limitations
Our assessment has a number of limitations. Namely: 1) The estimated virus levels strongly depend on the number of virus copies produced by a case with COVID-19. We used sputum data from a well described peer-reviewed study 21 assuming that it is a reasonable approximation for the virus load in the respiratory bronchioles, the space where most respiratory microdroplets are formed. Our high-emitter estimates would be 100-fold higher if the most extreme correspondence data was used 22. 2) We used information about virus copies but compare the results with TCID50 infective dose. Research on other virus types suggests that the number of virus copies and TCID50 are comparable 45. However, it would be important to confirm this relationship for the case of SARS-CoV-2. 3) For breath and cough microdroplets release, we used data collected in experimental setups involving healthy young subjects. However, microdroplet formation is influenced by surface tension of the lung lining liquid 46. It is likely that microdroplet formation will be altered in cases with COVID-19 but it is not clear in which direction. 4) Microdroplets will shrink in dry air 47, resulting in a shift to smaller particle sizes. This will not directly change the number of copies in the PM10 range but simply upconcentrate the viral load per microdroplet. While we addressed passivation of viruses in the air by using the documented half-life 35, it is still possible that viruses in smaller droplets are quicker passivated because of shorter diffusion distances for airborne oxidants and faster increasing salinity. Our estimates would be slightly smaller if this was relevant. 5) The one-compartment model assumes perfectly mixed conditions. However, often, rooms are not perfectly mixed and also ventilation and room geometry will add spatiotemporal variability. The modelling provides an average estimate, but exact concentrations will vary in function of the real circumstances. In multi-room situations, numerical flow simulations seem indicated to describe the microdroplet distribution 48. 6) Finally, though our results suggest that in certain situations, airborne transmission of COVID-19 may be possible, it is important to keep in mind that this was a modelling effort. While this route would provide a convenient explanation for several superspreading events 16–19, and even though the virus was found in airborne microdroplets in hospital situations 20, it still needs to be validated in clinical settings and animal models.
Conclusions
In conclusion, our mathematical modelling suggests that the viral load in the air can rapidly reach critical concentrations in small and ill-ventilated rooms, especially when the patient is a super-spreader defined as a person emitting large number of microdroplets containing a high viral load. Thus, strict respiratory protection is needed whenever there is a chance to be in the same room with such a patient - whether symptomatic or not - especially if this was for a prolonged time.
Data Availability
All data sources are mentioned in the manuscript and publicly available.
Acknowledgments
This modelling was entirely funded by the Swiss Centre for Occupational and Environmental Health (SCOEH). No external funder had any role in the design and conduct of the study; collection, management, analysis, and interpretation of the data; preparation, review, or approval of the manuscript; and decision to submit the manuscript for publication. Both authors had full access to all the data in the study and take responsibility for the integrity of the data and the accuracy of the data analysis.
References


