
Abstract
Many countries have applied lockdown that helped suppress COVID-19, but with devastating economic consequences. Here we propose exit strategies from lockdown that provide sustainable, albeit reduced, economic activity. We use mathematical models to show that a cyclic schedule of 4-day work and 10-day lockdown, or similar variants, can, in certain conditions, suppress the epidemic while providing part-time employment. The cycle reduces the reproduction number R by a combination of reduced exposure time and an anti-phasing effect in which those infected during work days reach peak infectiousness during lockdown days. The number of work days can be adapted in response to observations. Throughout, full epidemiological measures need to continue including hygiene, physical distancing, compartmentalization and extensive testing and contact tracing. We do not call for immediate adoption of this policy, but rather to consider it as a conceptual framework, which, when combined with other interventions to control the epidemic, can offer the beginnings of predictability to many economic sectors.
Current non-pharmaceutical interventions (NPI) to suppress COVID-19 use testing, contact tracing, physical distancing, mask use, identification of regional outbreaks, compartmentalization down to the neighborhood and company level, and population-level quarantine at home known as lockdown (1–4). The aim is to flatten the infection curve and prevent overload of the medical system until a vaccine becomes available.
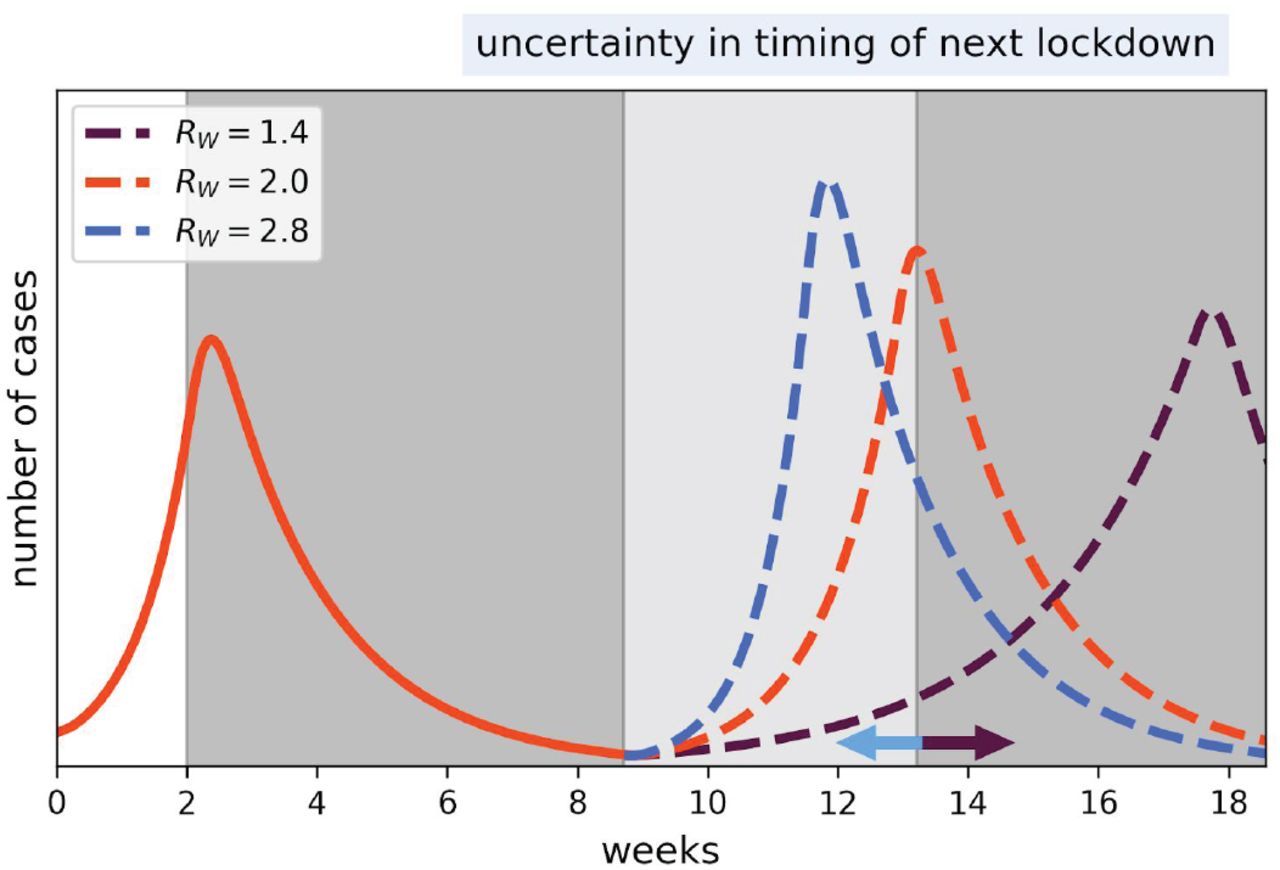
Lockdown is currently in place in many countries. It has a large economic and social cost, including unemployment on a massive scale. Once a lockdown has reduced the number of critical cases to a desired goal, a decision must be reached on how to exit it responsibly. The main concern is the risk of resurgence of the epidemic. One strategy proposes reinstating lockdown when a threshold number of critical cases is exceeded in a resurgence, and stopping lockdown again once cases drop below a low threshold (2, 5) (Fig 1A,S1). While such an “adaptive triggering” strategy can prevent healthcare services from becoming overloaded, it leads to economic uncertainty and continues to accumulate cases with each resurgence.
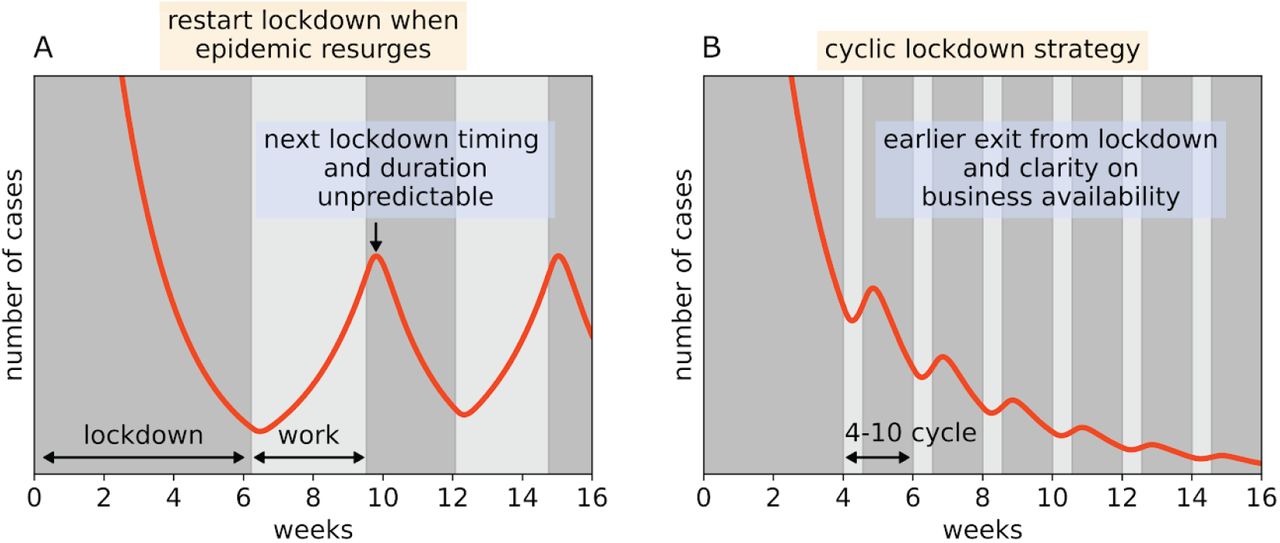
a) Exit from lockdown carries the risk of resurgence of the epidemic, with need to re-enter prolonged lockdown. b) A cyclic work-lockdown strategy prevents resurges by keeping the average R<1. It thus allows an earlier exit from lockdown, and provides a clear part-time work schedule. Transmission rates provide R in lockdown and work days of RL = 0.6 and RW = 1.5 respectively.
Here we carefully propose an exit strategy from lockdown that can prevent resurgence of the epidemic while allowing sustained, albeit reduced, economic activity. The strategy can be implemented at a point where lockdown has succeeded in stabilizing the number of daily critical cases to a value that the health system can support. Hereafter when we say ‘lockdown’ we mean population-level quarantine at home, together with all other available interventions such as testing and social distancing.
The basic idea is to keep the effective reproduction number R, defined as the average number of people infected by each infected individual, below 1. When R is below 1, the number of infected people declines exponentially, a basic principle of epidemiology.
To reduce R below 1, we propose a cyclic schedule with k continuous days of work followed by n continuous days of lockdown. As shown below, 4 days of work and 10 days of lockdown is a reasonable cycle that allows a repeating 2-week schedule. Epidemiological measures should be used and improved throughout, including rapid testing, contact isolation and compartmentalization of workplaces and regions. The cyclic strategy can thus be considered as a component of the evolving policy toolkit that can be combined with other interventions.
By “work days” we mean release from lockdown with strict hygiene and physical distancing measures on the same k weekdays for everyone. The nature of the release from lockdown can be tuned. It can include the entire population except for quarantined infected individuals and people in risk groups who may be in quarantine. More conservatively, it can include workers in selected sectors of the economy. Remote work should be encouraged for sectors that can work from home.
A staggered cyclic strategy is also predicted to be effective, in which the population is divided into two sets of households that work on alternating weeks (6), each with a k-work:(14-k)-lockdown schedule (Fig 2). The staggered strategy has the advantage that production lines can work throughout the month and transmission during workdays is reduced due to lower density, whereas the non-staggered strategy has the advantage that lockdown days are easier to enforce.

Shown is I(t) from the SEIR-Erlang deterministic model with mean latent period of 3 days and mean infectious period 4 days (7). Transmission rates in lockdown and work give RL = 0.6 and RW = 1.5 respectively. Density compensation is ϕ = 1.5 and non-compliance is 10% (see Methods).
The cyclic strategies reduce the mean R by two effects: restriction and antiphasing. The restriction effect is a reduction in the time T that an infectious person is in contact with many others, compared to the situation with no lockdown. For example, a 4-day work:10-day lockdown cycle reduces T to 2/7 T ≈ 0.3T.
The antiphasing effect uses the timescales of the virus against itself (Fig. 3). Most infected people are close to peak infectiousness for about 3-5 days, beginning ≈3 days after being exposed (8, 9). A proper work-lockdown cycle, such as a 4-work:10-lockdown schedule, allows most of those infected during work days to reach maximal infectiousness during lockdown, and thus avoid infecting many others. Those with symptoms can be infectious for longer (9), but can be detected by their symptoms and remain (self-)quarantined along with their household members, preventing secondary infections outside the household. Similarly, asymptomatic cases infected at work will spend the majority of their peak infectious period under lockdown. Family-level and work level rapid testing and quarantine when symptoms arise can help shorten infection chains.

SARS-CoV-2 has an average latent (non-infectious) period of about 3 days. A 14-day cycle in which people enter lockdown after 3 or 4 work days benefits from this property. Even those infected on the first day of work spend most of their latent period at work and reach peak infectiousness during lockdown. This reduces the number of secondary infections.
The staggered cyclic strategy can further reduce mean R by reducing density during work days, leading to lower transmission rates (Methods).
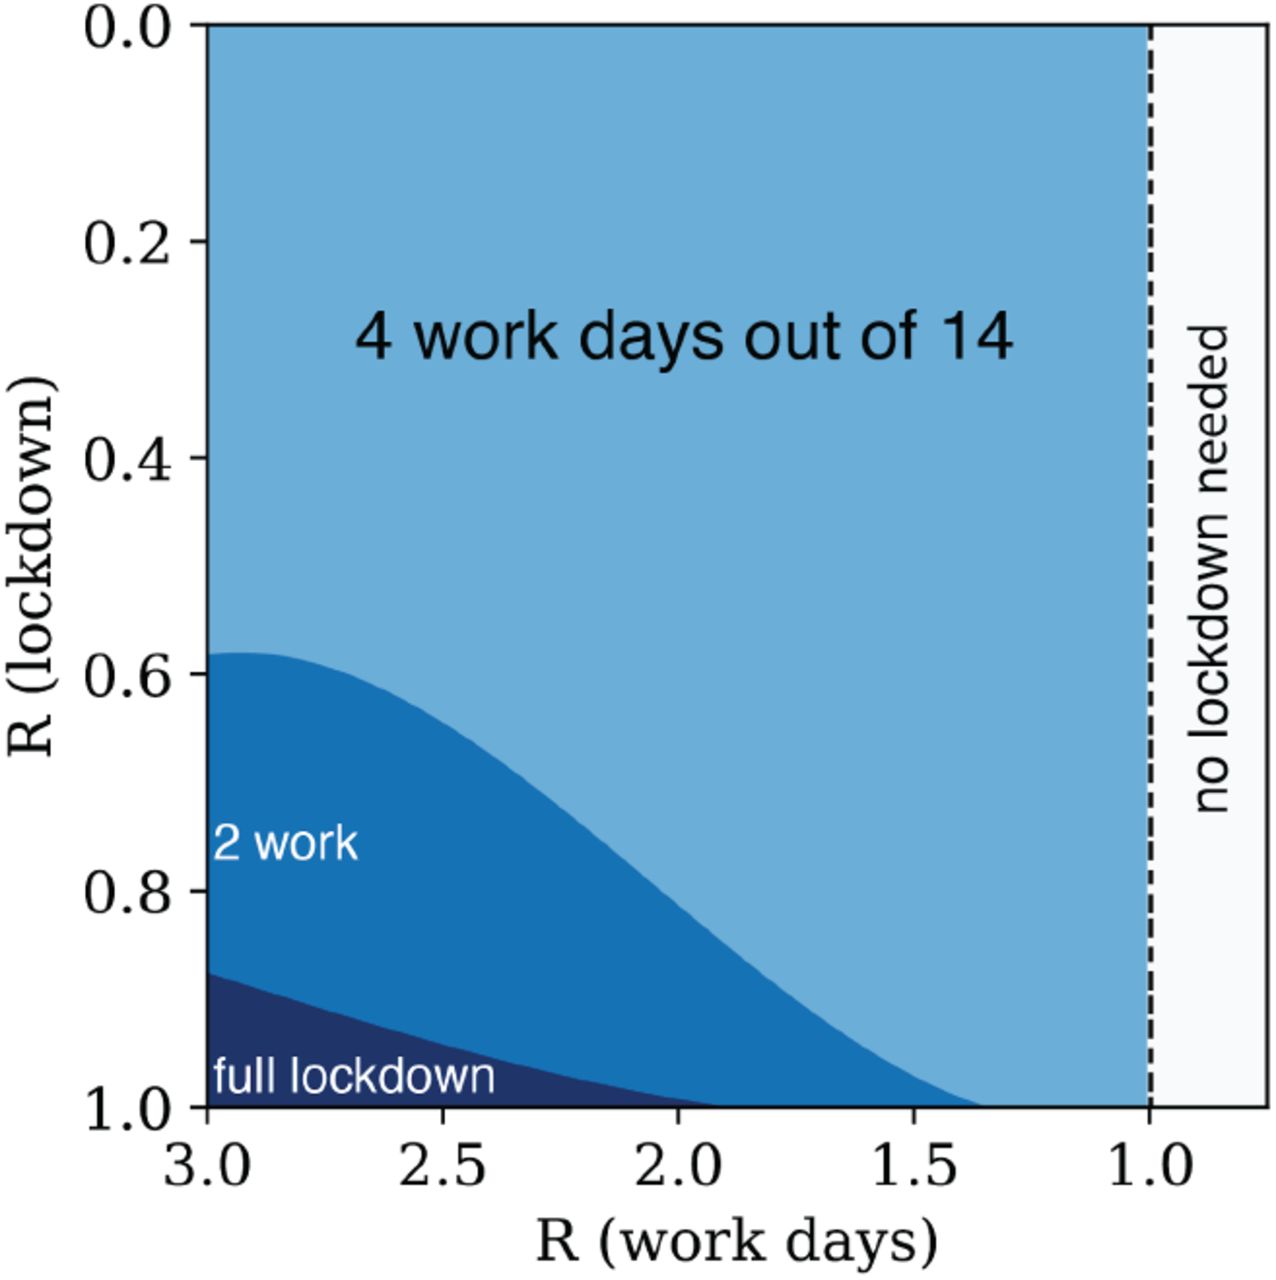
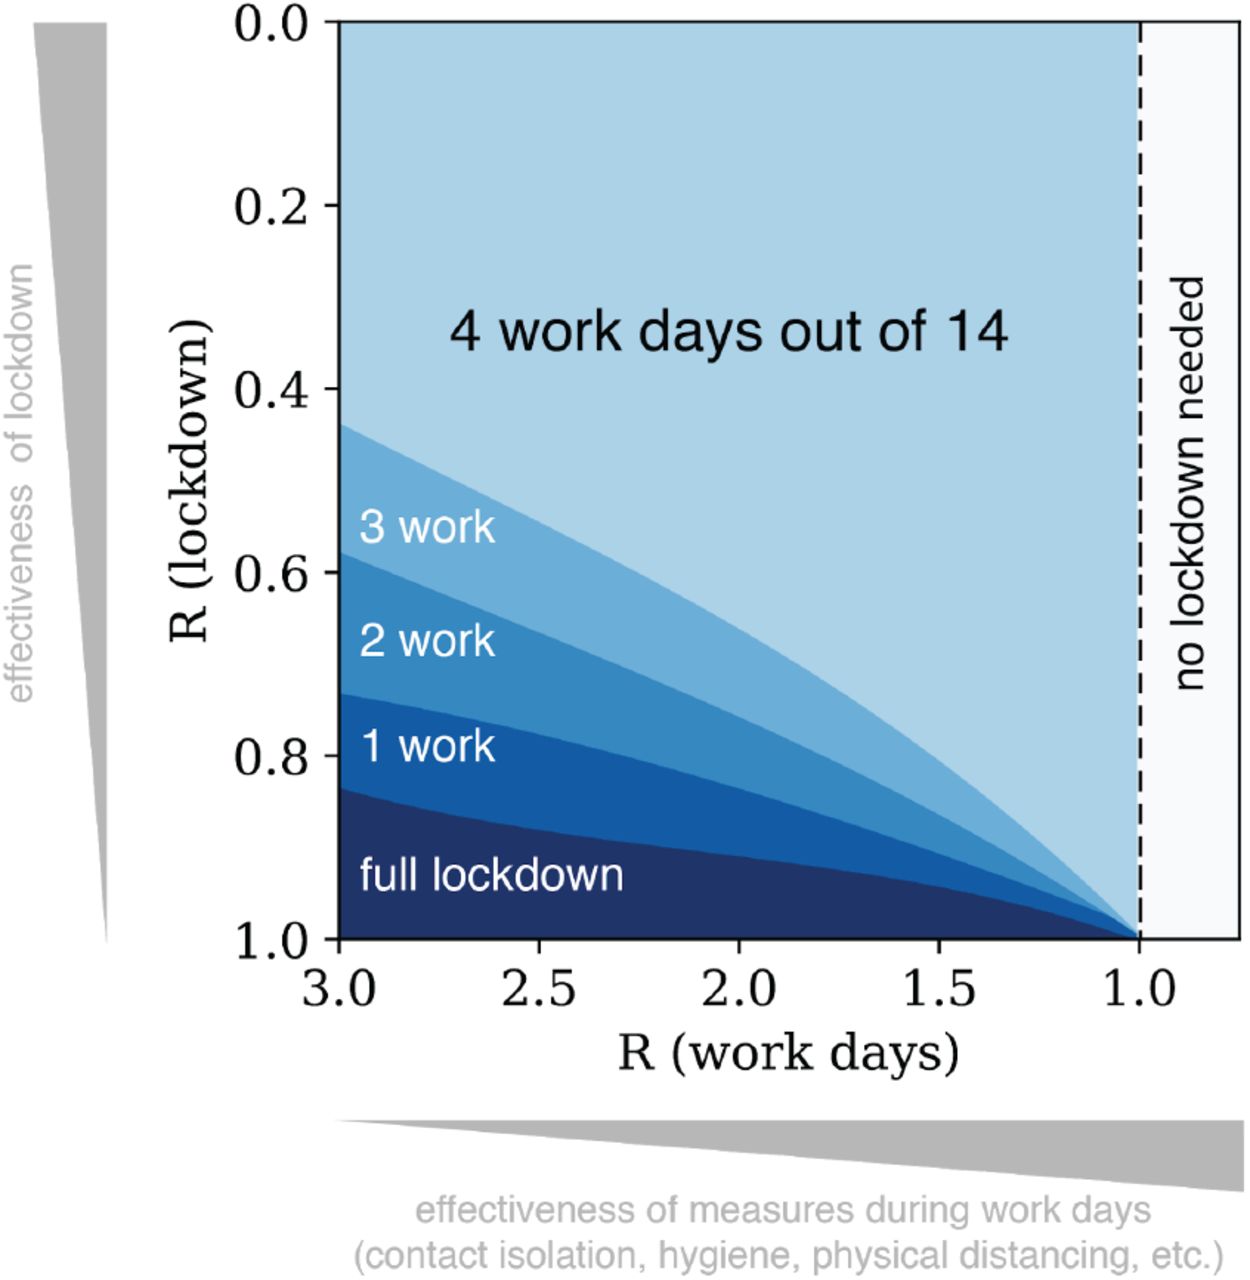
Simulations using a variety of epidemiological models, including SEIR models and stochastic network-based simulations, show that a cyclic strategy can suppress the epidemic provided that the lockdown is effective enough (Fig. 4, Table 1). A 4-10 cycle seems to work well for a range of parameters and is robust to uncertainties in the model (Fig. S2, S3). The transmission parameters during work days and lockdown days can be described by the effective replication numbers that describe extended periods of work and lockdown conditions, RW and RL, respectively. If lockdown is as strong as strong as in Wuhan, with estimated R L ≈ 0.3 (10), a 4-10 cycle suppresses the epidemic even if workday RW is as large as in the early days of the epidemic in Europe, with RW ≈ 3 − 4 (11). A weaker lockdown, with R L ≈ 0.6 − 0.8, can support a cyclic strategy with 2-4 work days when strict measures are enforced during workdays providing RW ≈ 1.5 − 2 (Table 1). Simulating on a social network provides an even larger range of conditions of a cyclic strategy to control the epidemic (Fig S5). Ideally, measures will eventually bring down R during workdays below 1, as in South Korea’s control of the epidemic in early 2020, making lockdown unnecessary.
Effective replication numbers for a 4-10 cyclic strategy in several scenarios. RW and RL are the replication numbers that would be observed in continuous periods of work and lockdown, respectively.

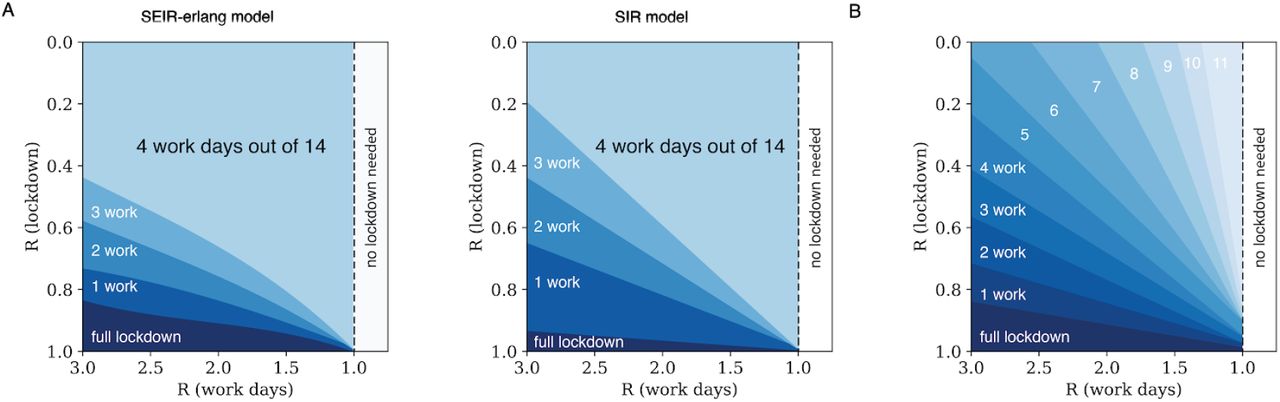
Each region shows the maximal number of work days in a 14-day cycle that provide decline of the epidemic. Simulation used a SEIR-Erlang deterministic model with mean latent period of 3 days and infectious periods of 4 days. Results are robust to uncertainty in model parameters (Fig S2).
An important consideration is that the cyclic strategy is adaptive, and can be tuned when conditions change and the effects of the approach are monitored.
For example, weather conditions may affect R (5), as well as advances in regional monitoring and case tracing. If one detects, for example, that a 4:10 strategy leads to an increasing trend in cases, one can shift to a cycle with fewer work days. Conversely, if a strong decreasing trend is observed, one can shift to more work days and gain economic benefit (Fig 5). A conservative approach can exit lockdown with 1 day of work, build up to two days, and so on.

(a) If average R is above 1, cases will show a rising trend, and number of work days in the cycle can be reduced to achieve control. (b) Number of work days per cycle can be increased when control meets a desired health goal.

Cumulative number of cases is shown for the simulations of Fig 1a (red) and Fig1b (blue). Even though exit from lockdown occurred earlier in the cyclic strategy case, the cumulative number of cases associated with this strategy is lower in the long term than the accumulated cases when lockdown is released and then restarted once the epidemic resurges. The relative benefit of the cyclic strategy is further increased by considering non-COVID-19-related health consequences of extended lockdown during resurgences, prevented by the cyclic strategy.
Measures will be required during the work days to ensure that people do not excessively compensate for the lockdown periods by having so many more social connections that R is significantly increased. This may include sound epidemiological measures such as the continuation of banning large social events and clear communication campaigns by the health authorities to enhance adherence to hygiene and physical distancing. Shared work spaces can be disinfected to reduce future infection through surfaces. Extensive rapid testing and contact tracing should be developed and extended in parallel (12).
The economic benefits of a cyclic strategy include part-time employment to millions who have been put on leave without pay or who have lost their jobs. This mitigates massive unemployment and business bankruptcy during lockdown. Prolonged unemployment during lockdown and the recession that is expected to follow can reduce worker skill (13–17) and carries major societal drawbacks (18). Unemployment also has detrimental health effects which include exacerbation of existing physical and mental illnesses. High levels of unemployment have been associated with increases in morbidity and mortality (19).
The cyclic strategy offers a measure of economic predictability, potentially enhancing consumer and investor confidence in the economy which is essential for growth and recovery (20, 21). It can also be equitable and transparent in terms of who gets to exit lockdown.
For these reasons, a cyclic strategy can be maintained for far longer than continuous lockdown. This allows time for developing a vaccine, treatment, effective testing and buildup of herd immunity without overwhelming health care capacity.
The cyclic strategy does not seem to have a long-term cost in terms of COVID-19 cases compared to a start-stop lockdown policy triggered by resurges. Comparing the two strategies shows that in the mid-term and long term, the start-stop strategy accumulates more cases due to resurgences (Fig. 5). This does not depend heavily on parameters: the fundamental reason is new cases arise during each resurgence; the cyclic strategy keeps average R below one, and thus prevents resurgences. If desired, the cyclic strategy can also keep cases near a low constant rate, by adjusting k to provide feedback control according to epidemiological measurements.
Regions that adopt this strategy are predicted to resist infections from the outside. Infections entering from the outside cannot spread widely because average R<1. After enough time, there is even a possibility for the epidemic to be eradicated, in the absence of unknown reservoirs or mutations.
The cyclic strategy can work in regions with insufficient interventions, as long as the lockdown phases provide low enough transmission. This may apply to a large part of the earth’s population.
The exact nature of the intervention can be tuned to optimize economy and minimize infection. The cyclic strategy can be synergistically combined with other approaches to suppress the epidemic. The general message is that we can tune lockdown exit strategies to balance the health pandemic and the economic crisis.
Methods
SEIR model
The deterministic SEIR model is dS /dt =− βSI, dE /dt = βSI − σE, dI / dt = σE − γI, where S,E and I are the susceptible, exposed (noninfectious) and infectious fractions. Parameters calibrated for COVID-19 (7) are  day-1;
  day-1, and S=1 is used to model situations far from herd immunity. The values used for β are defined in each plot where R = β/ γ. The analytical solution for cyclic strategies is in (SI).
SEIR-Erlang model
The SEIR model describes an exponential distribution of the lifetimes of the exposed and infectious compartments. In reality these distributions show a mode near the mean. To describe this, we split E and I into two artificial serial compartments each with half the mean lifetime of the original compartment (22). This describes Erlang-distributed lifetimes (the distribution of the sum of two exponentially distributed random variables) with the same mean transition rates as the original SEIR model. Thus, dS/dt =− βSI, dE1/dt = βSI − 2σE1, dE2 /dt = 2σE1 − 2σE2, dI1 /dt = 2σE2 − 2γI1, dI2 /dt = 2γI1 − 2γI 2, where I = I1 + I2, and R = β/ γ. In the figures we used a worst-case assumption of no herd immunity, namely S ≈ 1. Herd immunity further reduces case numbers. Case numbers are in arbitrary units, and can describe large or small outbreaks. The deterministic simulation describes a fully-mixed population. Population structure typically reduces overall outbreak peak size (23) compared to a fully mixed situation with the same mean transmission rate, but includes the possibility of high attack rates in certain sub-populations. For example, a stochastic simulation on a network shows a larger range of conditions for a cyclic strategy to work than in a deterministic model (compare Fig 4 and Fig S5),
Staggered cyclic strategy, SEIR-Erlang model
We model two groups, A and B, with a susceptible, exposed and infectious compartment for each group. The SEIR-Erlang model for group A is:
 and an analogous equation for group B. We assume that each group consists of half of the population. This causes density at work to be reduced (6). For ease of comparison to the non-staggered case, we refer to the replication numbers of a single fully mixed population with a cyclic strategy, namely R = RW on work days and R = RLduring lockdown. In the staggered case, during lockdown, as opposed to work, individuals from a group interact primarily with their own household. The density in the household is not affected by dividing the population into two staggered work groups. Hence, the effective R remains RL.

Where the factor of 2 normalizes SA = 0.5. During work days, we can estimate the number of transmissions at work and not at home by RW − RL. This gives the following equation:

With analogous equations for group B.
We next model cross-transmission between the groups. Due to the expected difficulty of enforcing a staggered work schedule as compared to a non-staggered cycle strategy, we assume a leakage term due to a fraction of individuals ρ from each group that does not adhere to their lockdown. These non-adheres instead interact with the other group during the other groups’ work days.
When group B is in lockdown, infectious non-adherers from group B can infect individuals from group A who are in their work days. This rate is modeled as proportional to the replication number for people infected at work and not at home, RW − RL :

When individuals from group A are in lockdown and non-adhere, they can be infected from individuals from group B on group B work days. We also add a higher-order term for susceptible ‘leaking’ individuals from group A that meet non-adherent infectious ‘leaking’ individuals from group A during group A lockdown:

When both groups are in lockdown at the same time, there is no leakage:

Note that for complete leakage ρ = 1 and under symmetry assumptions I1 = I2, the equations become identical to the case of a single fully mixed population:
So far, we assumed that density at work is half that of the non-staggered case. However, in practice, compensatory mechanisms might lead to a higher effective density. For example, people might cluster to maintain a level of social interaction, or certain work-day situations may require a fixed density of individuals. These effects can be modelled by adding a density compensation parameter ϕ which rescales the work-day infection rate. This number is ϕ = 2 for complete compensation of infectivity where density at work is not affected by partitioning, or ϕ = 1 is the staggered model above with half the density at work. We obtain the following equations:

With analogous equations for group B.
Stochastic SEIR model on social networks with epidemiological measures
We also simulated a stochastic SEIR process on social contact networks. Each node i represents an individual and can be in a susceptible, exposed, infected or removed state (i.e. quarantined, recovered or dead). Lifetime in the E and I states is drawn from an Erlang distribution with means TE and T I. The total infectivity of a node βi is drawn from a long tailed distribution to account for super-spreaders. The probability of infection per social link j, qij, is set either constant for all links connected to node i or drawn from an exponential distribution to account for heterogeneity in infection rates. Node states are updated at each time step. Network models include Erdos-Renyi and small world networks. During lockdown, a fraction of the links are inactivated (same links for each lockdown phase).
Linearity of transmission risk with exposure time
In order for restriction of exposure time to be effective, probability of infection must drop appreciably when exposure time is reduced. This requires a low average infection probability per unit time per social contact, q, so that probability of infection, p = 1 − exp(− qT), does not come close to 1 for exposure time T on the order of days. For COVID-19, an infected person infects on the order of R=3 people on average during the infectious period of mean duration D=4 days. If the mean number of social contacts is C, which is estimated at greater than 10, one has q∼DR/C<0.1/day. Thus infection probability on the scale of hours to a few days is approximately linear with exposure time: 1 − exp(− qT) ≈ qT. This is consistent with the observation that infected people do not typically infect their entire household, and with the linearity observed in influenza transmission (24). We also tested a scenario using network models in which some contacts have much higher q than others (exponentially distributed q between links). A mildly lower R in lockdown is required to provide a given benefit of the cyclic strategy than when q is the same for all links.

SEIR-Erlang model simulation showing the initial growth phase of an epidemic in the first two weeks, triggering a lockdown of 7 weeks. Lockdown is reinstated once a threshold of cases is exceeded. We show three scenarios with different effective reproduction numbers after lockdown is first lifted (RW=1.4, RW=2.0 and RW=2.8), leading to a wide distribution of the time at which the case threshold is crossed and lockdown is reinstated.

The SEIR-Erlang model has two free parameters, the lifetimes of the latent and infectious periods, given by TE = 1/σ and T I = 1/γ. The reference parameters used in the main text are TE=3 days, and TI=4 days based on the COVID-19 literature [SARS-COv2 by the numbers]. The panels show the regions in which effective R<1 with (A) TE=3d and TI=2d, (B) TE=1.5d and TI=4d, (C) TE=1.5d and TI=2d, (D) TE=3d and TI=6d, (E) TE=4.5 d and TI=4d, and (F) TI=6d, TE=4.5 d. These and similar parameter variations make small differences to the phase plots.

(A) The SIR model (right panel) lacks the exposed (non-infectious) compartment. It shows that the cyclic lockdown strategies can control the epidemic, but at smaller parameter regions for each given strategy than the SEIR-Erlang model (left panel). The difference is biggest at large ratios of R at work and lockdown, where SEIR-Erlang has an advantage. The SIR model is dS/dt =− βSI, dI/dt = βSI − γI. The replication number is R = β/ γ. Here γ = 1/7 day−1 to provide the same serial interval duration as in the SEIR model, and S=1. This plot is unaffected by changes in SIR model γ. Effective R in the SIR model is the average R weighted by the fraction of time for work and lockdown. For analytical work on optimal epidemic control in the SIR model see [https://osf.io/rq5ct/]. Note that the axes in this plot are inverted with respect to Fig 3. (B) In this figure, each region shows the maximal number of workdays where the epidemic can be suppressed for the SEIR erlang model, for work days in the range of 0-11.

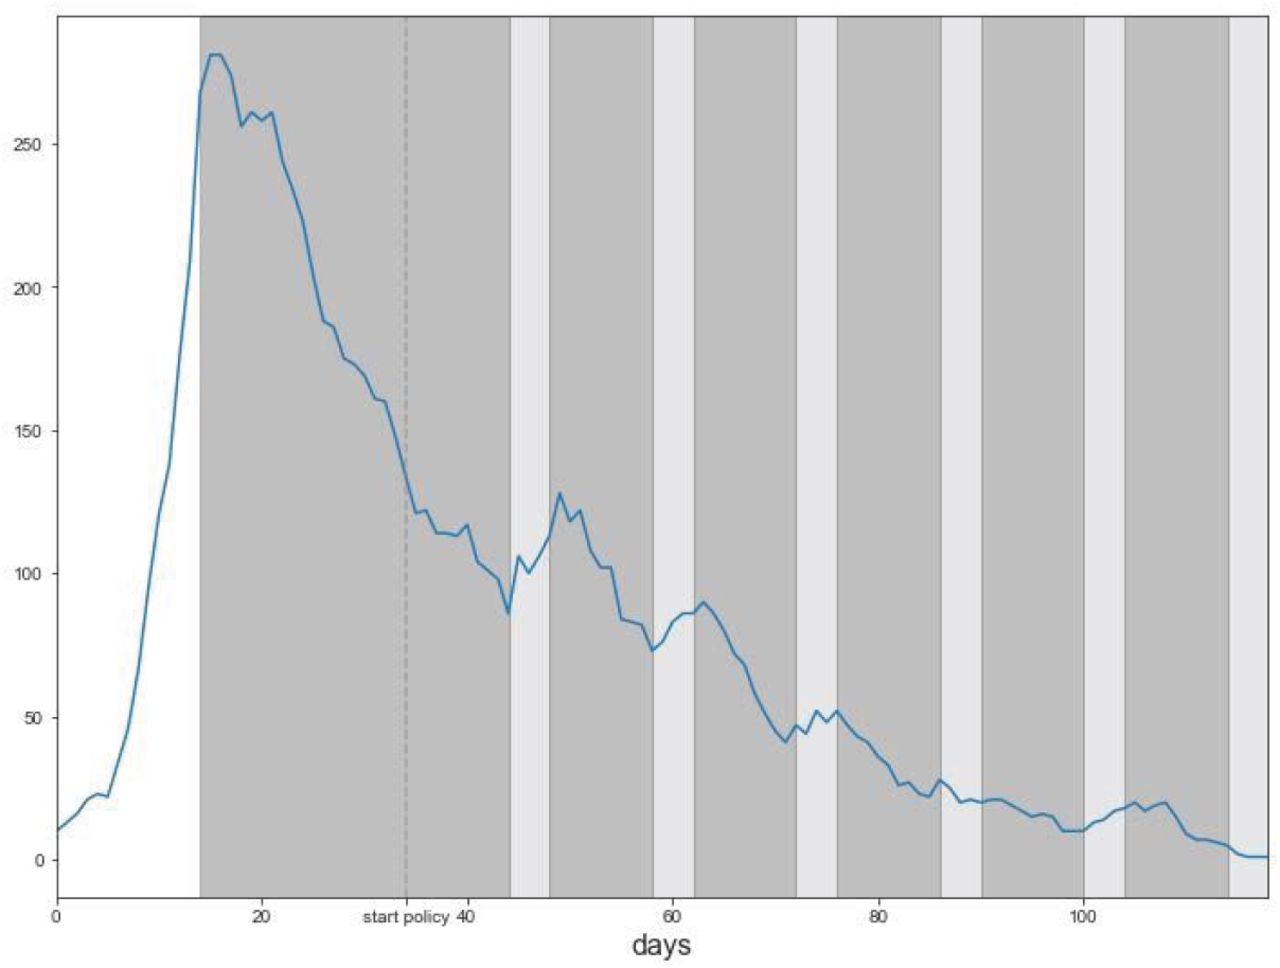
Stochastic simulation of a 4-work-10-lockdown cyclic strategy using a SEIR process simulated on a contact network. Infected nodes versus time from a simulation run using the SEIRSplus package from the Bergstrom lab, https://github.com/ryansmcgee/seirsplus. Contact network has a power-law-like degree distribution with two exponential tails, with mean degree of 15, N=10^4 nodes, sigma=gamma=1/3.5 days, beta=0.95 till day 14, lockdown beta=0.5 with mean degree 2 (same edges removed every lockdown period), work day beta=0.7. Probability of meeting a non-adjacent node randomly at each timestep instead of a neighbor node is p=1 before day 14, in lockdown p=0, workday p=0.3. Testing is modeled to quarantine 1% of infected nodes per day, with no contact tracing. Shaded regions are lockdown periods, light gray regions are workdays. Initial conditions were 10 exposed and 10 infected nodes.
A custom simulator uses a stochastic SEIR process on a social network. The social network is small-world with with N = 104, mean degree C=16 and fraction of long-range connections probability p = 1 − RL /RW. Timesteps are one day. In work days transmission occurs along edges, with qW = RW /(C T inf). In lockdown days, the long range links of each node are inactivated (the same links are inactivated every day), with remaining links signifying the household. Transitions between exposed, infectious and removed states are determined by Erlang (shape=2) distributed times determined for each node at the beginning of the simulation.

Each region shows the maximal number of work days in a 14-day cycle that provide decline of the epidemic. Simulation used a SEIR-Erlang deterministic model with mean latent period of 3 days and infectious periods of 4 days. Density compensation φ and non-compliance (cross transmission) η parameters were as follows: (a) φ=1,η=0.1 (b) φ=1.5,η=0.1 (c) φ=1,η=0.3 (d) φ=1.5,η=0.3. Code can be found at https://github.com/omerka-weizmann/2_day_workweek.
SI section: Economic perspective on cyclic lockdown strategies
Extended lockdowns are resulting in widespread unemployment and business bankruptcy. Governments step in to address these economic challenges and thus government expenditure skyrockets while revenues plummet. The implication of this is growing public deficits. Finally, consumer demand declined precipitously in part because purchases that conflict with the social isolation imperative are viewed by consumers as unsafe or simply banned outright by the government. Moreover, lower employment also means lower aggregate income and therefore consumption. To conclude, the Covid-19 induced crisis has led to an employment and business crisis on the supply side, a suppression of demand and growing government deficits. The longer the lockdown period, the worse these problems will become.
The cyclic lockdown alternative, coupled with government business subsidies, holds several advantages when compared to full lock-down mode.
On the supply side, the cyclic alternative substitutes unemployment with part-time employment for many workers. Considering the well-established research literature on the long-term unemployment scarring effect this has important long-term economic and welfare advantages. First, long-term unemployment (6 months or more) leads to human capital depreciation that in turn reduces productivity, employability and wages (13–16). Although lock-downs are not predicted to last a full six months, it is likely that many businesses will not re-open immediately following lockdown termination, would rehire in smaller numbers, or fail to reopen at all. Hence, many workers would face long-term unemployment even if the actual lockdown is significantly shorter. In instances of widespread unemployment, individual workers decline in productivity and could have an aggregate long-term depressing effect on productivity growth in the entire economy (17). Long-term unemployment also exerts negative effects on social capital: in this context, the deterioration of social networks that help the unemployed to find appropriate employment opportunities (25). Adverse physical and mental effects are also associated with long-term unemployment (18).
Second, a cyclic strategy would keep many businesses running, albeit at less than full capacity, thus avoiding temporary or permanent shutdown. It is considerably easier to extend the operations of running enterprises than to establish new ones. Moreover, even temporary shutdowns, intended to reduce labor and fixed costs during hard times, negatively affect investor and consumer confidence in firms. For this reason, even during the Great Recession temporary shutdowns were relatively rare as managers understood that it is better to suffer losses in the short-term than to endanger the enterprise’s reputation among investors and consumers (26).
Preventing complete firm shutdown could also alleviate some of the more negative psychological-based consequences of economic crises. Shutdowns not only influence an individual firm’s reputation, but also that of the entire economy if shutdowns are prevalent. Pessimistic ‘animal spirits’ (20, 21) emanated by the general appearance of a fallen economy permeate the investment world and undermine recovery. The more businesses are closed down, the more difficult will it be to convince investors to renew investment and jumpstart the economy.
On the demand side, layoffs predictably lead to a decline in consumer buying power and a depression of aggregate demand. In contrast, the employed not only have higher income then the unemployed, they also have more confidence in their future income flow. This confidence implies that they are less likely than the unemployed to defer consumption to a later date because they fear that their income sources would dry up.
Finally, governments across the world comprehend that the Covid-19 crisis requires expansive government investment to avert an economic and humanitarian disaster. However, this implies running deficits. The cyclic strategy does not mean that the government can simply trust the private sector to pay wages on par with the norm during the pre-crisis era. Given depressed demand, absent government subsidies many businesses would be unable to cover their costs in full, even if workers receive only compensation for part-time work. In addition, without government supplements many families would be unable to make ends meet even assuming that the breadwinners work part time. Nevertheless, the fact that some production would continue implies that the private sector shortfall that the government needs to cover would be smaller than what would be the case under full lockdown. As a result, government fiscal burden would be lighter under a cyclic strategy than full lockdown mode.
From an economic perspective, however, a cyclic strategy such as 4-10 has some disadvantages. Primarily, not all economic sectors and countries benefit similarly from the scheme. Services that rely on physical human congregation such as flights, hotels or restaurants are unlikely to operate anywhere near normal under this scheme. Even if governments loosen restrictions on congregation, most people would refrain from patronizing large-scale entertainment events, for example, as long as a substantial perceived Covid-19 health risk is present. Under such circumstances, such businesses may prefer full lockdown anticipating that the ‘all clear’ signal would arrive earlier than under the cyclic scheme. Unfortunately, full lockdown cannot guarantee that resurgence would not occur. Resurgence would place businesses that are highly reliant on their potential customers’ sense of Covid-19 risk/health in a position that is no better, and perhaps even worse (due to costs associated with reopening and closure) than under a cyclic strategy that can prevent resurges.
The cyclic scheme also presupposes that in a few sequential work days (eg 4) it is possible to deliver products/services effectively even if in a more limited manner. However, the production process in numerous economic activities is based on work cycles longer than four days. Indeed, some production activities are predicated on ‘continuous processing/production’ in which work interruptions, such as equipment maintenance, are rare. In some cases, shifting from continuous processing to semi-continuous operations would require reorganization of work. In others, cessation of activities comes at high cost due, for example, to undesirable chemical reactions that occur when material flow stops. However, it should be noted, that many of the economic activities to which this issue applies are currently considered by governments as essential (e.g., oil refineries, pharmaceutical plants) and therefore continue to operate almost at full capacity under lockdown mode and would do so under the cyclic scheme as well.
The economic sectoral composition of different countries differs and accordingly so would their gains from adopting a cyclic exit strategy. Countries that are disproportionately reliant on recreation and tourism would gain less than countries in which a large share of economic activity relies on manufacturing or agriculture. The cost-benefit analysis of adopting this scheme for each country would be different. Even if only part of the economy benefits from a cyclic strategy, economic benefits are expected to be significant.
we need to add here on the health benefits related to reducing unemployment, reducing non corona health morbidity and mortality
Data Availability
All data supplied in the submitted file
References


