
Abstract
COVID-19 caused by SARS-CoV-2 has recently affected over 200,000 people and killed more than 8000. Immune system dysregulation such as lymphopenia and inflammatory cytokine storm has been observed in COVID-19 patients, but it remains unclear for the change of key immune cell subsets and their states during COVID-19. Here, we applied single-cell technology to comprehensively characterize transcriptional changes of peripheral blood mononuclear cells in ten patients recovered from COVID-19. Compared with healthy control, COVID-19 induced a unique signature of immune cells in humans, especially in the early recovery stage (ERS). In ERS patients, T cells were decreased remarkably, while monocytes were increased. A detailed analysis of monocytes showed that there was an increased ratio of classical CD14++ monocytes with highly inflammatory genes expression, as well as a greater abundance of CD14++IL1B+ monocytes. For nature killer (NK) cells and T cells, CD4+ T cells were significantly decreased and expressed high level of inflammatory markers, while NK cells were increased. In addition, T cells were highly expanded clone, especially in CD4+ T memory cells and CD8+ T cells. Among B cells, plasma cells were increased remarkably, and naïve B cells were reduced. Our study also identified several novel B cell receptor (BCR) changes (such as IGHV1-8 and IGHV3-7), and confirmed isotypes (IGKV3-11 and IGHV3-21) previously used for virus vaccine development. The strongest pairing frequencies, IGHV3-23+IGHJ4, indicated a monoclonal state associated with SARS-CoV-2 specificity. Furthermore, integrated analysis predicated that IL-1β and M-CSF may be novel candidate target gene for inflammatory storm, and TNFSF13, IL-18 and IL-4 may be benefit for the recovery of COVID-19 patients. Our study provides the first evidence of inflammatory immune signature in early recovery stage, suggesting that the COVID-19 patients are still vulnerable after hospital discharge. Our identification of novel BCR signaling may lead to the development of vaccine and antibodies for the treatment of COVID-19.
Hight lights
- The immune response sustains more than 7 days in early recovery stage of COVID-19, suggesting that the COVID-19 patients are still vulnerable after hospital discharge.
- Single cell analysis revealed immune cells interaction characterized by increasing of a subset of CD14++ IL1β+ monocytes in ERS of COVID-19 patients.
- Newly identified virus specific BCR changes would be helpful for the development of vaccine and antibodies against SARS-CoV-2.
- IL-1β and M-CSF were discovered as novel mediators for inflammatory cytokine storm, and might be potential candidate targets in COVID-19 treatment.
- TNFSF13, TNFSF13B and IL4, IL18 were discovered as novel mediators for recovery mechanisms.
Introduction
COVID-19 caused by a novel severe acute respiratory syndrome coronavirus 2 (SARS-CoV-2) has spread in many countries [1-3]. As of 21 March 2020, SARS-CoV-2 has affected over 300,000 people and killed more than 10,000 of those affected in >160 countries. Following its global spread, it has been declared a public health emergency of international concern (PHEIC) by the WHO[4]. COVID-19 show symptoms of fever, dry cough, fatigue, diarrhea, conjunctivitis, and pneumonia. Some patients developed severe pneumonia, acute respiratory distress syndrome (ARDS) or multiple organ failure[5- 7]. Although scientists and clinicians globally made a great effort to produce vaccines and explore anti-viral drugs[8, 9], there remains no specific medicine and effective clinical treatment for COVID-19[10,11].
Immune system dysregulation, such as lymphopenia and inflammatory cytokine storm are observed and are believed to be associated with disease severities of pathogenic coronavirus infections, such as the severe acute respiratory syndrome coronavirus (SARS-CoV) and the Middle East respiratory syndrome coronavirus (MERS-CoV) infections[12, 13]. n COVID-19, recent studies also found decreases in lymphocytes number and increases in serum inflammatory cytokine levels in peripheral blood[5, 14]. However, it has remained largely unclear for the change of key immune cell subsets and their states during COVID-19. Defining key cellular subsets and their states in COVID-19 is a critical step in bringing critical insights into the immune clearance mechanism and new therapeutic strategy for COVID-19.
Here, we applied single-cell RNA sequence (scRNA-seq) to comprehensively characterize the changes of peripheral blood mononuclear cells from ten of COVID-19 patients. Our study depicts a high-resolution transcriptome landscape of blood immune subsets in the recovery stage of COVID-19. It reveals that compared to healthy controls (HCs), monocytes contained highly inflammatory and IL1β+ subset were predominated, while CD4+ T cells were decreased remarkably in the early recovery stage of COVID-19 patients. We found that T cells and B cells were highly expanded clone in recovery stage of COVID-19 patients. Furthermore, several specific BCR changes of COVID-19 patients in recovery stage may be helpful for vaccine and antibody production.
Results
Study design and analysis for single immune cell profiling in COVID-19 patients
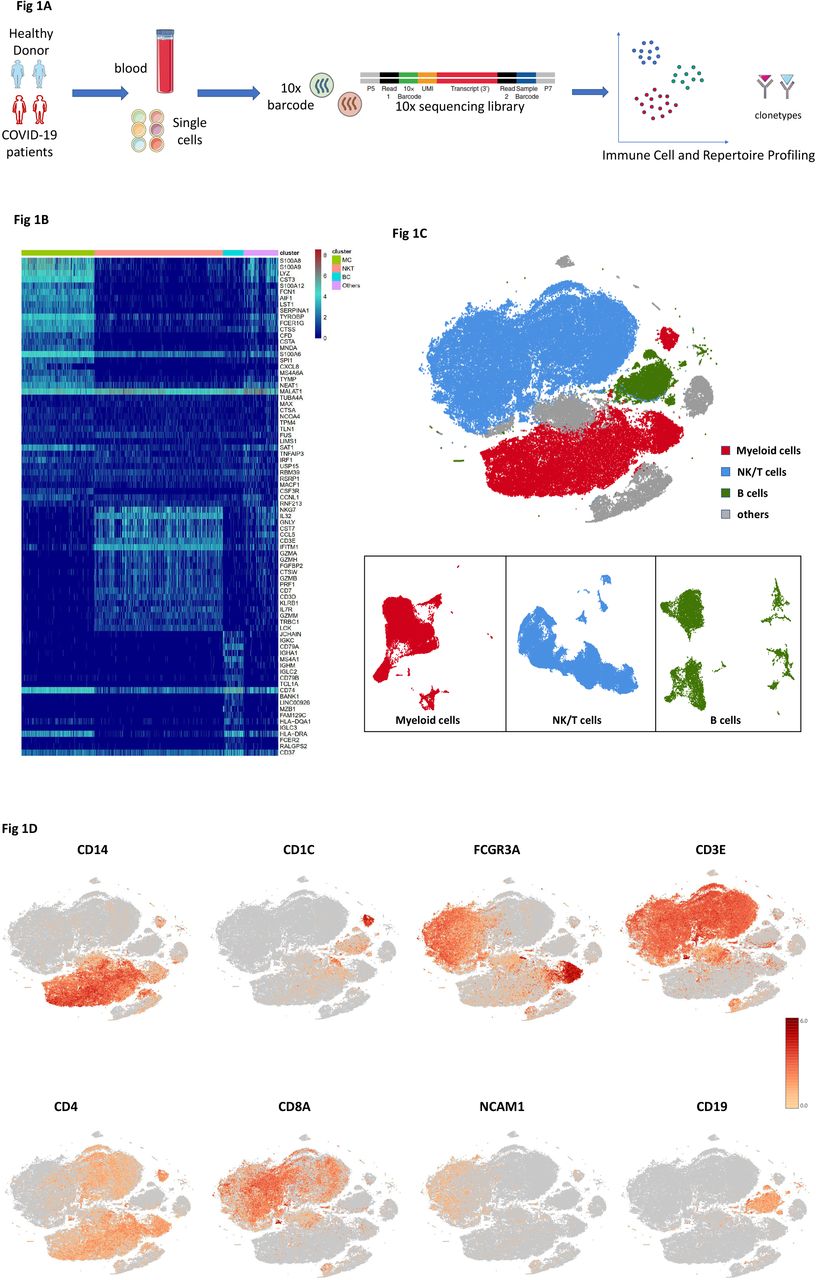
To map the immune microenvironment of the COVID-19 patients, identify mirroring changes in blood and pinpoint cell-specific alterations associated with the severity of the disease, we integrated single-cell RNA sequencing (scRNA-seq), single-cell paired BCR and single-cell paired TCR analysis from a total of ten of COVID-19 patients in early recovery stage (ERS) or later recovery stage (LRS) (70,858 cells). We also collected scRNA-seq data (57,238 cells) of five normal peripheral blood mononuclear cells (PBMCs) as controls (Fig. 1A and Fig. S1). This dataset passed stringent high-quality filtering. The single-cell suspensions of scRNA-seq samples were converted to barcoded scRNA-seq libraries using 10X Genomics. The CellRanger software (version 3.1.0) was used for initial processing of the sequencing data.

A. Schematic of the experimental design for sing cell-RNA (sc-RNA) sequencing. Peripheral blood mononuclear cells (PBMCs) were collected from COVID-19 patients and healthy controls (HCs), then processed sc-RNA, sc-BCR and sc-TCR sequencing by using the 10X-Based Genomics platform.
B. The heatmaps show the differentially expressed genes (DEG) upregulated in myeloid cells, NK&T cells, B cells and other clusters of PBMCs respectively.
C. t-Distributed Stochastic Neighbor Embedding (tSNE) plot showing myeloid cells (red), NK&T cells (blue), B cells (green) and other clusters (grey) of PBMCs identified by integrated and classification analysis.
D. t-SNE projection of canonical markers including CD14, CD1C and FCGR3A for myeloid cells, CD3E, CD4, CD8A and NCAM1 for NK&T cells, CD19 for B cells as indicated in the legend.
Using t-Distributed Stochastic Neighbor Embedding (t-SNE), we analyzed the distribution of the three immune cell lineages of myeloid cells, NK&T cells and B cells based on the expression of canonical lineage markers and other genes specifically upregulated in each cluster (Fig. 1B, C). For marker genes, expression values in each cell positioned in a t-SNE are shown in Fig. 1D. We next clustered the cells of each lineage separately, and identified a total of 20 immune cell clusters.
An overview of NK/T cells, B cells and myeloid cells states in the blood of convalescent patients with COVID-19
The immune cell compartment of patients recovered from COVID-19 infection comprised all major immune lineages. We analyzed 128,096 scRNA-seq profiles passing quality control, including 36,442 myeloid cells, 64,247 NK&T cells and 10,177 B cells from five HCs, five ERS and five LRS patients. The sketchy clustering analysis landscape of each subject is present in Fig. S2A and the merge picture of each group is shown in Fig. 2A. We discovered that COVID-19 patients including ERS and LRS demonstrate a higher proportion of myeloid cells compared to HCs, but with a lower proportion of NK&T cells (Fig. 2B, C). Interestingly, LRS patients contained more B cells and NK&T cells, but less myeloid cells compared to ERS patients (Fig. 2B, C). Thus, these findings indicated that COVID patients had decreased count of lymphocytes and increased count of myeloid cells in peripheral blood. To further understand the changes of myeloid cells, NK&T cells and B cells in COVID-19 patients, we conducted difference expression gene (DEG) analysis of NK&T cells, B cells and myeloid cells between HCs and patients. The Heat Map is shown in Fig. 2D-F. Inflammatory cytokines and chemokines such as IL1B, CCL3, IRF1, DUSP1, JUN, FOS, etc. were all expressed at obviously high levels in patients regardless of myeloid cells (Fig. 2D), NK&T cells (Fig. 2E) or B cells (Fig. 2F). Together, our results demonstrated that myeloid cells increased and NK&T cells decreased in the peripheral blood of COVID-19 patients, and that immune cell compositions differed between ERS and LRS patients.

A. The t-SNE plot shows the comparison of the clustering distribution across HCs, early-recovery stage (ERS) and late-recovery stage (LRS) of COVID-19 patients.
B. The bar plot shows the relative contributions of myeloid cells, NK&T cells and B cells by individual sample including five HCs, five ERS and five LRS patients.
C. The pie chart shows the percentages of myeloid cells, NK&T cells and B cells across HCs, ERS and LRS of COVID-19 patients.
D. The heatmaps show the DEG of myeloid cells among HCs, ERS and LRS COVID-19 patients.
E. The heatmaps show the DEG of NK&T cells among HCs, ERS and LRS COVID-19 patients.
F. The heatmaps show the DEG of B cells among HCs, ERS and LRS COVID-19 patients.
Myeloid cells subsets and their states in the blood of convalescent patients with COVID-19
To further understand the changes of monocytes in early and later recovery stage of COVID-19 patients, we conducted gene expression analysis and sub-clustered myeloid cells into six transcriptionally distinct subsets. Classical CD14++ monocytes (M1), non-classical CD16++ (FCGR3A) CD14-/+ monocytes (M2), intermediate CD14++CD16+ monocytes (M3), CD1C+ cDC2 (M4) or CLEC9A+ cDC1(M5) and pDC (CLEC4C+CD123+) (M6) were present in the six distinct clusters by UMAP (Fig. 3A,B and S). We found that the compartment of the monocyte subset differed remarkably among HCs and COVID-19 patients (Fig. 3C). Among myeloid cells, the ratio of classical CD14++ monocyte (M1) was increased in ERS patients compared with HCs, and was almost normal in the LRS patients (Fig. 3C).
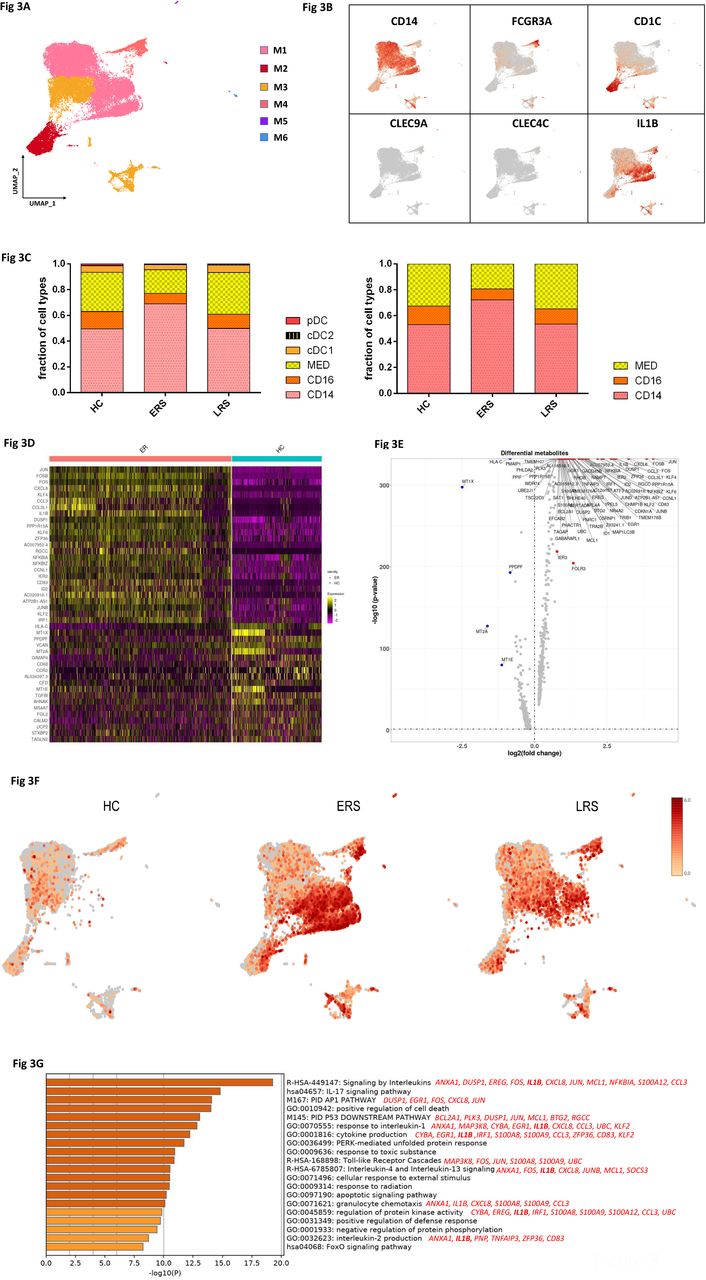
A. Six clusters of myeloid cells were displaying according to marker gene expression levels. The Uniform Manifold Approximation and Projection (UMAP) presentation of the heterogenous clusters of peripheral myeloid cells.
B. The UAMP plot showing subtype-specific marker genes of myeloid cells including CD14, FCGR3A, CD1C, CLEC9A, CLEC4C and IL-1β.
C. Bar chart of the relative frequency of six sub-clusters of myeloid cells and three sub-clusters of monocytes across HC, ERS and LRS patients.
D. The heatmaps show the top DEG between COVID-19 patients and HCs in myeloid cells.
E. Volcano plot of the fold change between COVID-19 patients and HCs in myeloid cells.
F. The UAMP plot shows the IL-1β were highly expressed in ERS vs LRS and HCs in myeloid cells.
G. The GO BP enrichment analysis of DEGs of CD14+ monocytes upregulated in COVID-19 patients.
We then found that COVID-19 patients have a greater abundance of CD14++IL1β+ monocytes and IFN-activated monocytes than HCs (Fig. 3D-F). Genes associated with CD14++ inflammatory monocytes (M1), have high expression levels of inflammatory genes such as IL1β, JUN, FOS, JUNB, KLF6, and chemokines, CCL4, CXCR4, and interferon stimulated genes IFRD1, IRF1, IFI6. In contrast, anti-inflammatory genes associated with CD14++ monocytes (M1) were downregulated in COVID patients relative to HCs (Fig. 3D, E). Notably, IL1β expression values showed in a UMAP with simultaneous contrast indicated that IL1β was upregulated in ERS group, and decreased in LRS patients (Fig. 3F). This was confirmed in DC cluster of ERS group compared to HCs (Fig. S3A-B). Next, we took the average of inflammatory genes for each myeloid cell scRNA-seq subset in the COVID-19 patients versus HCs (Fig. S3C). These results demonstrate that cytokine activation drives expansion of monocyte populations (especially the CD14++ inflammatory monocytes) in COVID-infected patients. To explore the biological significances of transcriptional changes in the M1 cluster, we performed GO analysis with DEGs (Fig. 3G). We found enrichment of pathways, regarding cytokine signaling and inflammation activation, which were driven by the upregulation of IFITM3 and IFI6, and IL1β, JUN, FOS, JUNB, KLF6 (Fig. 3G).
Together, these findings demonstrate that a dysregulated balance of monocyte populations in ERS patients, manifested by substantially increased classical CD14++ monocytes. Our results suggested that the classical CD14++ monocytes are increased in circulation to fuel the inflammation during SARS-CoV-2-infection.
Characterization of T and NK cell responses in the blood of recovered COVID-19 patients
T and NK cell played critical roles in viral clearance during respiratory infections[15, 16]. Our clustering analysis sub-grouped T and NK lymphocytes into ten subsets (Fig. 4A) based on canonical markers (Fig. 4B and Fig. S4A). NK cells highly expressed NCAM1, KLRF1, KLRC1 and KLRD1 and we sub-divide NK cells to CD56+CD16-NK cells (NK1), which expressed high levels of CD56 and low levels of CD16, and C56-CD16+ NK cells (NK2), which expressed high levels of CD16 and low levels of CD56; CD4+ T cells expressed CD3E and CD4, and we sub-divided them to four clusters, naïve CD4+T cells (T1) expressed high levels of CCR7, LEF1 and TCF7, central memory CD4+T cells (T2, CD4 Tcm) also expressed high levels of CCR7, but more AQP3 and CD69 compared to naïve CD4+T cells, effector memory CD4+T cells (T3, CD4 Tem) expressed high levels of CCR6, CXCR6, CCL5 and PRDM1, and regulatory T cells (T4, Treg) expressed FOXP3. CD8+ T cells expressed CD8A and CD8B and were subdivided to three clusters: naïve CD8+T cells (T5) expressed high levels of CCR7, LEF1 and TCF7, similar to naïve CD4+T cells, effector memory CD8+T cells (T6, CD8 Tm) expressed high level of GZMK, and cytotoxic CD8+lymphocytes (CD8+ CTL) (T7) expressed high levels of GZMB, GNLY, and PRF1. Proliferating T cells (T8, Pro-T) were TYMS+MKI67+ cells.
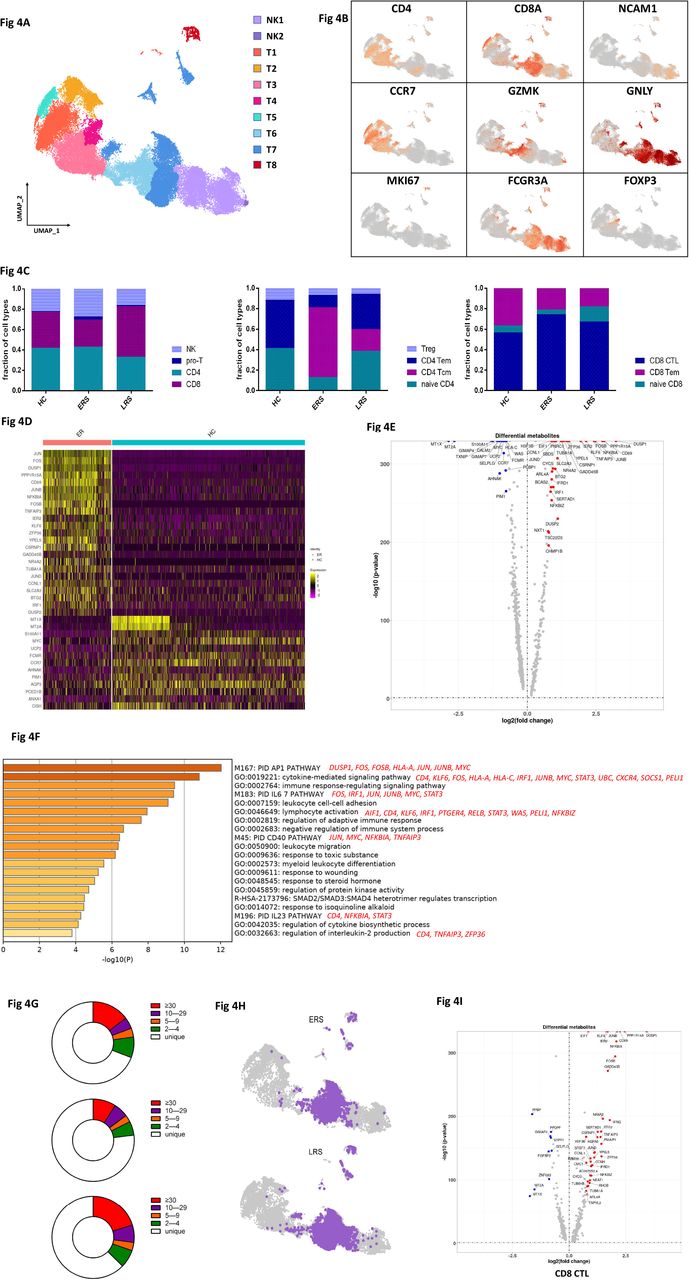
A. Ten sub-clusters of NK&T lymphocytes were identified. The UMAP plot shows the clustering of T and NK cells.
B. The UAMP plot showing subtype-specific marker genes of NK&T cells including CD4, CD8A, NCAM1, CCR7, GZMK, GNLY, MKI67, FCGR3A and IL-1β.
C. The bar plot shows the percentages of four sub-clusters of NK&T cells, four sub-clusters of CD4+ T cells and three sub-clusters of CD4+ T cells among HCs, ERS and LRS patients, respectively.
D. The heatmap of CD4+T cells showing the DEGs between COVID-19 patients and HCs.
E. The volcano plot shows the DEGs of CD8+ T cells between COVID-19 patients and HCs.
F. The GO BP enrichment analysis of DEGs of CD4+T cells upregulated in COVID-19 patients.
G. The UAMP shows TCR clone in ERS and LRS.
H. The volcano plot shows the DEGs of Pro-T cells and CD8+ T cells between COVID-19 patients and HCs.
I. The pie plot shows TCR clone difference across HCs, ERS and LRS patients.
The composition of the T and NK cells subset differed significantly among HCs and COVID-19 patients (Fig. 4C). The ratio of CD8+T cells was decreased in ERS COVID-19 patients, whereas the ratio of NK cells was increased compared with HCs. The ratio of CD4+T cells was stable, but the composition of the CD4+ T cells subset differed significantly between HCs and COVID-19 patients. Among CD4+T cells, central memory CD4+T cells was significantly increased, whereas the ratio of naïve CD4+ T cells was reduced compared with HCs. Notably, genes associated with CD4+ T cell, had relatively high expression levels of inflammation-related genes, and were significantly upregulated in COVID patients (Fig. 4D). CD4+ T cells had high expression levels of inflammatory genes including FOS, JUN, KLF6, S100A8 in ERS of COVID patients. (Fig. 4E). In contrast, anti-inflammatory genes associated with CD4+ T cells were downregulated in COVID patients relative to HCs (Fig. 4D, E). This suggested CD4+ T cells were the main participants in the virus infection. Comparison of the DEGs in the CD4+ T cells revealed enrichment of genes participating in cytokine pathway and inflammation activation, including IFITM3 and IFI6, and IL1B, JUN, FOS, JUNB, KLF6 (Fig. 4F). Further studies are needed to elucidate IFN pathways in COVID pathogenesis.
TCR-seq analysis found that T cells expansion were obviously decreased in ERS group than HCs (Fig. 4G). Moreover, naïve or central memory T cells showed little clonal expansion, while effector memory T cells, terminal effector CD8+ T cells (CTLs) and proliferating T cells showed the higher expansion levels (Fig. 4H). In addition, the most highly expanded (maximum) clone in ERS group was TRAV8-6-TRAJ45:TRAV7-8-TRBJ2-1 (Fig. S5D). The decreased ratio of CD8+ T cells in COVID-19 patients may implicate a role of CD8+ T cells in the virus clearance (Fig. 4C). The expanded clones might demonstrate potential over-activated inflammation in CTLs (Fig. 4I). Together, these findings show that clonally expanded CD8+ T cells in peripheral blood of COVID-19 patients, which help to control the virus. We also performed DEGs analysis obtained via unsupervised clustering analysis and found similar results in Pro-T cells (Fig. S4B-C). Next, we took the average of inflammatory genes for each NK&T cells subsets scRNA-seq subset in the COVID-19 patients versus normal RNA-seq data (Fig. S4D).
Characterization of single-cell B cell in COVID-19 patients
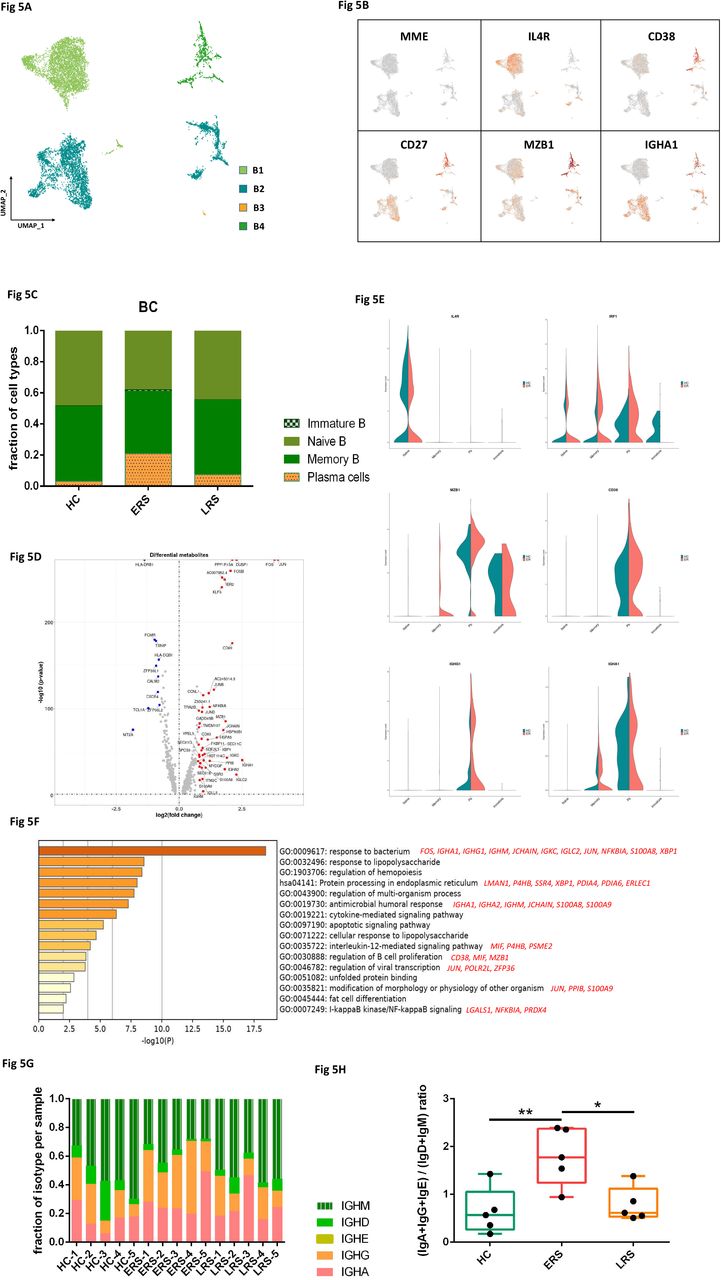
By projecting the gene expression data of the B cells using diffusion maps, we identified four B cell clusters with scRNA-seq: naïve B cells (B1) expressing CD19, CD20(MS4A1), IGHD, IGHM, IL4R and TCL1A, memory B cells (B2) expressing CD27, CD38 and IGHG, immature B cells (B3) only expressing CD19 and CD20(MS4A1), and plasma cells (B4) expressing high levels of XBP1 and MZB1 (Fig. 5A-B and fig. S5A).

A. Four clusters of B cell were identified. The UMAP plot shows the clustering of B cells.
B. The UAMP plot showing subtype-specific marker genes of B cells including MME, IL4R, CD38, CD27, MZB1 and IGHA1.
C. The bar plot shows the percentages of B clusters across HCs, ERS and LRS patients.
D. The volcano plot shows the DEGs of B cells between COVID-19 patients and HCs.
E. The violin plot shows IL4R, MZB1, IGHG1 and IGHA1 were highly expressed in COVID-19 patients vs HCs in B cells sub-clusters.
F. The GO BP enrichment analysis of DEGs of B cells between COVID-19 patients vs. HCs.
G. The bar plot shows the relative contributions of each cluster by individual sample.
H. The bar plot shows the ratio of (IGA+IGG+IGE)/(IGD+IGM) among HCs, ERS and LRS patients.
In comparison with HCs, the percentage of plasma cells were significantly increased in COVID-19 patients, whereas naive B cells were significantly decreased in COVID-19 patients (Fig. 5C). Memory B cells and plasma cells (MPB) might play an important role in controlling viral infection and developing adoptive immunity as they synergistically worked and induced specific antibodies. Moreover, compared to HCs, higher expression of B-cells-activation-related genes including CD27, CD86, XBP1 and MZB1 were primarily expressed in MPB of early stage of COVID patients (Fig. 5D). We also found similar results in plasma cells, the antibodies secreting cells (ASC) (Fig. S5B-C), suggesting the key role of ASC in viral control. Next, we took the average of inflammatory genes for each B cells subsets scRNA-seq subset in the COVID-19 patients versus normal RNA-seq data (Fig. 5E). The difference of genes between ERS and HCs indicated enhanced B cells reaction and antibodies secretion in COVID patients. GO analysis found IGHA1, XBP1, MZB1, JUN, POLR2L and ZFP36 were over-presented in MPBs, which suggest enhanced B cell proliferation and viral transcription in COVID patients (Fig. 5F). Single-cell BCR-seq analysis indicated that IgA isotype was over-represented in COVID-19 compared to the HC (Fig. 5G). This corresponded with an increase in the levels of serum IgA (Fig S5), which was also pronounced in other coronavirus infection. Moreover, the ratio of (IgA+IgG+IgE)/(IgD+IgM) was significantly increased in ESR patients, and showed a downward trend with recovery time (Fig. 5H).
Expanded BCR clones and biased usage of VDJ genes observed in COVID-19 patients
Using sc-BCR-seq to assess the status of clonal expansions in the blood of patients, We found that IL4R+ naïve B cells showed little clonal expansion, while CD27+CD38+ memory B cells showed the highest expansion levels among diverse B cell subsets (Fig. 6A). Next, at the individual levels, we found that COVID-19 patients had significantly expanded clones compared to HCs, supporting that B cells had experienced unique clonal VDJ rearrangements under the SARS-CoV-2 infection. We also found that a higher B cell clonality was consistently remained in ESR as compared with LSR patients (Fig. 6B). Moreover, quantification of the most highly expanded (maximum) clone for each subject found that the ratios of the maximum clone were higher in ERS group than in HCs (Fig. 6C). To understand the functional status of expanded cloned B cells, we performed DEG analysis between cloned memory B cells (N⩾3) versus non-cloned cells. Our results showed increased expression of B cells genes including CD27, CD38, MZB1, XBP1 etc., which further supports a superior effector functions of those expanded cloned B cells (Fig. 6D). Moreover, the differential genes for expanded B cells were significantly subsided over time and reduced in LRS patients.

A. The UMAP plot shows the B cell expansion status in HCs, ERS and LRS COVID-19 patients.
B. The bar plots show clonal expansion status of B cells in peripheral blood from each individual sample.
C. The bar plots show the clonal expansion status of B cells in peripheral blood of HCs, ERS and LRS COVID-19 patients.
D. The volcano plot shows the DEGs of ERS and LRS patients vs. HCs in B cells.
E. The bar plots show specific B cell clonal expansion.
F. The heatmap of specific BCR clonal expansion.
In order to study the unique changes and preference genes of BCR in COVID-19 patients, we compared the usage of VDJ genes in patients with HCs. We identified an over-representation of IGHV1-8, IGHV3-7, IGHV3-21, IGHV3-23 and IGHV3-49 in COVID-19 compared to HCs (Fig. 6E). The preferred IGLV was IGKV1-17, IGKV2-28 and IGKV3-15. The preferred IGKV was IGLV1-44, IGLV2-8 and IGLV3-27 (Fig. 6E). Moreover, the top two pairing frequencies in ERS patient were IGHV3-23-IGHJ4 and IGHV3-7-IGHJ6 (Fig. 6F); these cells showed IGH subunit pairing with the IGL/V subunit encoded by IGLV1-44-IGLJ3 and IGKV1-17-IGKJ1, respectively, which indicated expanded states associated with SARS-CoV-2 specificity. Individually, ERS-4 and ERS-5 had the maximum clone referring to IGHV3-23-IGHJ4 (Fig. S5E) and IGHV3-7-IGHJ6 (Fig. S5F), respectively.
In summary, an increase in clonality in COVID-19 that was dominated by the IgA and IgM isotypes, together with a skewed use of the IGHV gene, suggested the contribution of SARS-CoV-2 to pathogenesis. Notably, respiratory syncytial virus fusion glycoprotein-binding antibodies isolated from infants’ blood utilized IGHV3-21 predominantly and displayed potent neutralizing activity. Given these results above, the biased usage of dominated IGVs genes, especially the IGHV3-23 and IGHV3-7 in COVID-19 patients, provides a framework for the rational design of SARS-CoV-2 vaccines.
Cell-to-cell communications among immune cells in COVID-19 patients
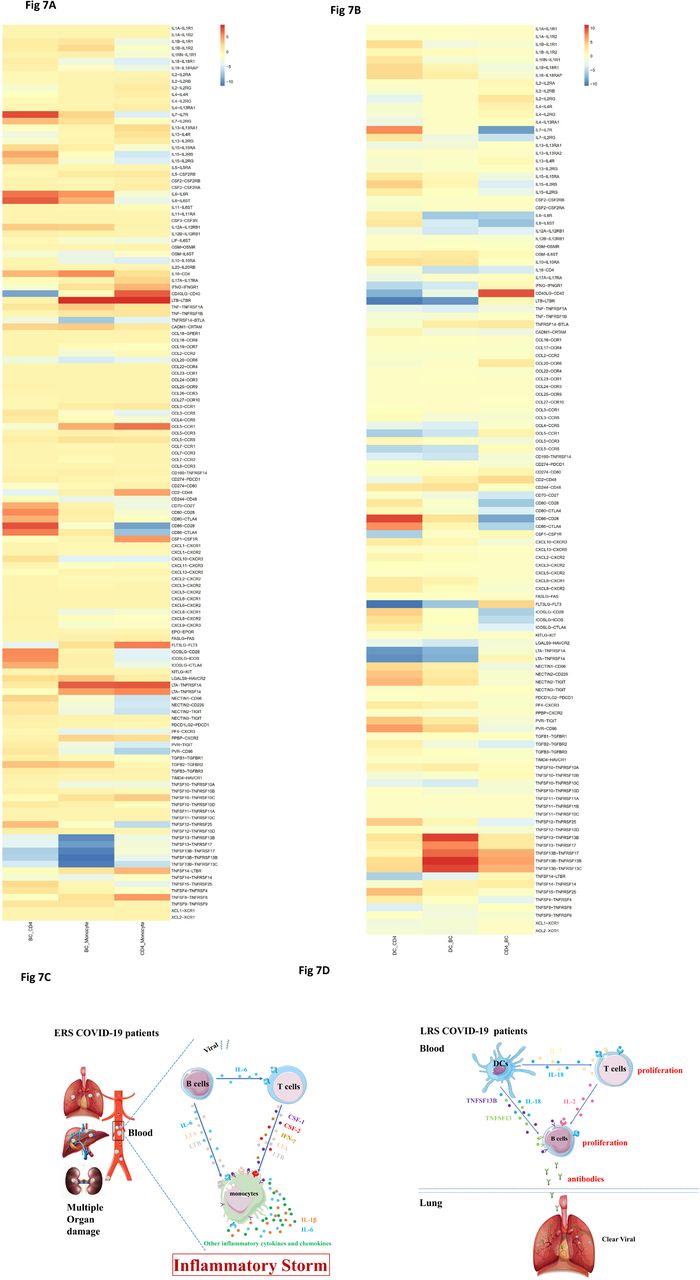
An established computational approach[17] was to predict cell-to-cell interactions that may contribute to the distinct functional state of T cells, B cells, monocytes and DCs in ERS and LRS (Fig. 7A, B). In ERS COVID-19 patients, we found adaptive signals involved in monocytes activation, proliferation, and inflammatory signaling (Fig. 7A, B). T cell expressed genes encoding for ligands of TNFSF8, LTA, IFNG, IL17A, CCR5 and LTB to TNFRSF8, TNFRSF1A/TNFRSF14, IFNGR1, IL-17RA, CCR1 and LTBR, which was expressed on monocytes and could contribute to the pro-inflammatory status. Other T cell–monocyte interactions involving the expression of CSF2 and CSF1. T cells might activate monocytes through the expression of CSF2 and CSF1 that bind to CSFRs (CSFR2/1) and contribute to inflammatory storm. A CD14+ monocytes cluster exclusively expressed IL1β, which was predicted to bind to IL1RAP expressed by T cells. T cell-monocyte interaction may enhance immune response and be exclusive deteriorate to COVID-19 patients. (Fig. 7A, B). Furthermore, we found monocyte highly expressed poliovirus receptor (PVR) which serves as a cellular receptor for poliovirus in the first step of poliovirus replication and inducing NF-kappa B signaling pathway. From B cell-monocyte and B cell-T cell interaction, we found B cell could secret a large number of IL-6, LTA and LTB which combined to IL-6R, LTAR and LTBR expressed in monocytes, and a large number of IL-6 apply to T cells to promoted the secretion of IFN-γ, IL-1β and other inflammatory cytokines and chemokines. Thus, a cascade signature of inflammatory monocytes with high expression of IL-6 and their progeny were formed in the peak incidence of ERS COVID-19 patients (Fig. 7C). These activated immune cells may enter the circulation of lung and other organs in large numbers and played an immune damaging role. In LRS COVID patients, DC ligands were predicted to interact with B cell and T cell receptors involved in cell proliferation and the produce of antibodies. We discovered that the peripheral blood of LRS patients contain a diversity abundance of antibodies, and we found that IL18−IL18RAP, TNFSF13-TNFRSF13B, TNFSF13-TNFRSF17, TNFSF13B−TNFRSF17, TNFSF13B−TNFRSF13B and TNFSF13B−TNFRSF13C were highly expressed in our analysis of DC-B cell interaction (Fig. 7D). Thus, we speculate that DC produce IL-18, TNFSF13 and TNFSF13B to promote the proliferation of B cell and then secret many antibodies into blood in ERS. From DC-T cell and T cell-B cell interaction, we discovered that DC not only produces IL-18 but also IL-7, to promote the proliferation of T cells, and T cells produce IL-2 to promote the proliferation of B cell and produce antibodies (Fig. 7D).Thus, cell-to-cell interactions help us to understand why COVID-19 patients manifested high rates of monocytes and low rates of lymphocytes and the proportion of lymphocyte gradually increased in recovery patients in peripheral blood.

A. T cell–monocyte interactions, B cell-monocyte interactions, B cell-T cell interactions and monocyte-T cell interactions in ERS COVID-19 patients.
B. DC-T cell interactions, DC-B cell interactions and T cell-B cell interactions in LRS COVID-19 patients.
C-D. Schematic illustrating the key innate and adaptive immune functional alterations and main differences in cell– cell communications from ERS and LRS COVID-19 patients
Discussion
The clinical presentation of COVID-19 varies from asymptomatic to severe ARDS. This has been similarly observed in severe acute respiratory syndrome coronavirus (SARS-CoV), Middle East respiratory syndrome coronavirus (MERS-CoV) and influenza infections[12, 14]. In viral infection, it is generally accepted that host immune responses determine both the protection against viral infections and pathogenesis of respiratory injury[18, 19]. A coordinated response in innate and adaptive immune cells working in concert may lead to a rapid control of virus, while a failed immune response might lead to viral spreading, cytokine storm, and a high mortality rate[20]. Despite being the same group of viruses, recent studies have highlighted differences between COVID-19, SARS, and MERS, such as the speed of transmission, treatment scheme and mortality rate. Moreover, the difference may also exist in the key immune players and the underlying molecular mechanisms related to these diseases. The lack of knowledge regarding the immune impact of COVID-19 has now become a critical issue in view of its fast spread and the shortage of specific therapy[21]. U Using single-cell sequencing, we profile the complexity of immune populations in blood and analyzed 70,858 cells from 10 patients. We identify a hyper-inflammation response in ERS patients, which may explain why some patients fell sick after being discharged, and suggest that the current criteria for hospital release should be reevaluated. In addition, we identify unique signatures of myeloid, NK, T and, B cells, and pinpoint the changes in epitopes of TCR and BCR. Our findings help elucidate the antiviral immune mechanisms and reveal promising opportunities in developing immunotherapies using vaccines and neutralizing antibodies.
Inflammation is a vital part of the immune system’s response to COVID-19 invasion, as previous and latest studies have reported significantly higher levels of inflammatory cytokines associated with disease severity in SARS, MERS and COVID-19 patients[22, 23]. Among the various inflammatory cells, monocytes and their subsets (including classical, intermediate and non-classical monocytes) may play a critical effect because they are known to fuel inflammation[24-27]. In our study, compared with healthy controls, ERS patients demonstrate a significantly higher ratio of monocytes, and these cells express higher levels of inflammatory genes. Intriguingly, the ratio of classical CD14+ monocytes is high in ERS but returns normal in LRS. Furthermore, CD14+IL1β monocytes, which are absent in healthy controls, could be observed in ERS and they decline in LRS. Notably, our cell-to-cell interaction analysis indicated that IL1β, CSF1, IL6, and CSF2 may be associated with cytokine storm. Taken together, our data provide important insight into the roles of monocytes in the immunopathogenesis of COVID-19.
Adaptive immune system harbors the ability to recognize and remember specific pathogens through antibody and T cell responses[28]. Inducing adaptive immunity is the aim of vaccination[29]. Previous SARS studies have identified binding and neutralizing antibodies elicited by SARS-CoV infection. Their therapeutic effect is unclear[30], although robust antibody responses could be induced[31]. In COVID-19 infection, although several lines of evidence have consistently indicated a decline in lymphocyte counts, the distinct immune characteristics at single-cell resolution are not clear. Our scRNA-seq analysis showed that, compared with HCs, ERS patients have a lower ratio of T and NK cells, and these patients’ T cells express higher levels of inflammatory genes, such as, JUN, FOS, JUNB, KLF6. In addition, high-throughput TCR sequencing identified expanded T cell clones in ERS patients. In LRS patients, the immunophenotype is different. In particular, LRS patients would have an increase in T and NK cells, and with a lower expression of inflammatory genes. We also performed a detailed analysis of B cells in patients and identified an increased population of plasma cells compared with HCs. We found that the BCR contain highly expanded clones, indicating their SARS-CoV-2 specificity. Importantly, we found several loci unique to COVID-19 infection. The strongest pairing frequencies, IGHV3-23+IGHJ4, indicated a monoclonal state associated with SARS-CoV-2 specificity. Notably, numerous studies have reported biased usage of VDJ genes related to virus specific antibody. For example, IGHV3-30 and IGKV3-11 have been involved in encoding primary antibody to neutralize human cytomegalovirus[32, 33]. In addition, IGHV3-30 and IGHV3-21 have been utilized to isolate influenza virus antibodies and used for the production of virus vaccine[34, 35]. Moreover, recent study demonstrated that antibodies combining the IGHV3-15/IGLV1-40 segments had superior activities neutralizing to Zaire Ebola virus[36]. Besides, we observed a decrease in the expression of inflammatory gene is ERS patients compared with HCs. We envision that our results will provide a direction for the future development of vaccine and antibodies of COVID-19 patients. Interaction between immune cells may help to expedite or defer recovery from COVID-19 infection. Our cell to cell prediction analysis utilizing scRNA-seq data indicated that, in ERS patients, B cell-derived IL-6 and T cells-derived CSF1(M-CSF) and CSF2(GM-CSF) may promote monocyte proliferation and activation. As a result, monocytes may produce a larger number of inflammatory mediators including IL-1β and IL-6, contributing to inflammatory storm. In LRS patients, both DCs-derived TNFSF13 and IL-18, and T cells-derived IL-2, may promote B cells survival, proliferation and differentiation. Consequently, B cells produce numerous SARS-COV2 specify antibodies to clear virus. In conclusion, our study provides the first immune atlas of patients recovered from COVID-19 and identifies adaptive immune dysregulation after discharge. The clone expansion of both T cell and B cell indicates that the body immune system is gradually recovered, but the hyper-inflammatory response sustaining more than 7 days after discharge suggests the need for medical observation after patient release from hospital. Longitudinal studies of recovered patients on a larger cohort might help to understand the consequences of the disease. The novel BCRs identified in our study may advance our understanding of B cell mechanisms and have potential clinical utility in COVID-19 immunotherapies.
Methods
Software and Algorithms
Patients
10 COVID-19 patients diagnosed with by real-time fluorescent RT-PCR were collected in the Wuhan Hankou Hospital China. Patients were divided into early-recovery stage (ERS) group and late-recovery stage (LRS) group according to the days from first negative nucleic acid transfer date to blood sampling date. We defined the RES group of five cases as the date of nucleic acid turning negative to blood sampling is less than seven days and LRS group of five cases as is more than fourteen days. The 10 patients consisted of five males and five females and ranged from ages 40 to 70 years old, with a median of 50 years old. The demographic characteristics of these patients are provided in Fig. S1. A written informed consent was regularly obtained from all patients. The study was approved by the Ethics Committee of Wuhan Hankou Hospital, China.
Quantitative reverse transcription polymerase chain reaction
The throat swab, sputum from the upper respiratory tract and blood were collected from patients at various time-points after hospitalization. Sample collection, processing, and laboratory testing complied with WHO guidance. Viral RNA was extracted from samples using the QIAamp RNA Viral Kit (Qiagen, Heiden, Germany) according to the manufacturer’s instructions. SARS-CoV-2-infected patients were confirmed by use of qRT-PCR kit (TaKaRa, Dalian, China) as recommended by China CDC.
Single-cell collection and scRNA-seq
The peripheral blood mononuclear cell (PBMCs) were isolated from heparinized venous blood of patients or healthy donors using a Ficoll-Hypaque density solution according to standard density gradient centrifugation methods. For each sample, the cell viability exceeded 80%. The single-cell suspensions of scRNA-seq samples were converted to barcoded scRNA-seq libraries using the Chromium Single Cell 5′ Library, Gel Bead and Multiplex Kit, and Chip Kit (10X Genomics). The Chromium Single Cell 5′ v2 Reagent (10X Genomics, 120237) kit was used to prepare single-cell RNA libraries according to the manufacturer’s instructions. The FastQC software was used for quality check. The CellRanger software (version 3.1.0) was used for initial processing of the sequencing data.
ScRNA-seq data alignment and sample aggregating
We de-multiple and barcode the sample by using The Cell Ranger Software Suite (Version 3.1.0) and with command cellranger count. After getting each sample gene counts, and aggregate them together. Finally, gene-barcode matrix of all ten patients and five HCs was integrated with Seurat v3 and monocle3. Following criteria were then applied to each cell, i.e., gene number between 200 and 7000. After filtering, a total of 128096 cells (13092/10035/13624/8329/12158 cells for HCs; 5163/7685/7171/10058/6581 cells for ERS; 3242/7895/7487/7164/8412 cells for LRS) were left for following analysis.
Dimensionality reduction and clustering
We handle the data with Log normalize before cluster and reduction, scale data with top 5000 most variable genes. Clustering and dimensionality method mainly used in monocle3 package. The genes used in PCA analysis have eliminated mitochondria (MT), and ribosomes (RPL and RPS) genes including MT-ND3, MT-ATP8, RPS15A, RPS28, RPS21, RPS27, RPS29, RPL36, RPL34, RPL37, RPL38, RPL39, RPL26 and et.al. with 50 principal components, and then aligned together, followed by UMAP and t-SNE are both used after the results of the aligned, parameters using the default parameters inside Monocle3. The leiden method on the UMAP dimension is used.
Differential analysis for clusters
Seurat v3 and Monocle 3 was used to perform differential analysis. For each cluster, differentially-expressed genes (DEGs) were generated relative to all of the other cells.
Gene functional annotation
For DEGs, Gene ontology (GO), KEGG pathway analyses were performed using Metascape webtool (www.metascape.org).
TCR and BCR V(D)J sequencing and analysis
Full-length TCR/BCR V(D)J segments were enriched from amplified cDNA from 5’ libraries via PCR amplification using a Chromium Single-Cell V(D)J Enrichment kit according to the manufacturer’s protocol (10x Genomics). The TCR/BCR sequences for each single T/B cell were assembled by Cell Ranger vdj pipeline (v3.1.0), leading to the identification of CDR3 sequence and the rearranged TCR/BCR gene. Analysis was performed using Loupe V(D)J Browser v.2.0.1 (10x Genomics). In brief, a TCR/BCR diversity metric, containing clonotype frequency and barcode information, was obtained. Using barcode information, T/B cells with prevalent TCR/BCR clonotypes were projected on a t-SNE plot.
Cell-cell interaction analysis
The cell-cell interaction analysis was based on the expression of immune-related receptors and ligands. The gene list contained 135 pairs of well-annotated receptors and ligands, including cytokines, chemokines and co-stimulators. We estimated the potential interaction between two cell types mediated by a specific ligand-receptor pair by the product of the average expression levels of the ligand in one cell type and the corresponding receptor in the other cell type.
Data Availability
https://bigd.big.ac.cn
Supplementary figure 1. the detail information of patients (1.1) and healthy controls (1.2).
Supplementary figure 2. tSNE plot showing the myeloid cells (red), NK&T cells (blue), B cells (green) and other clusters (grey) of PBMCs of each research object.
Supplementary figure 3. Analysis myeloid cells subsets landscape in COVID-19 patients. The heatmap of DCs showing the DEGs between COVID-19 patients and HCs (3.1). The volcano plot shows the DEGs of DCs between COVID-19 patients and HCs (3.2). The violin plot shows the JUNB, FOS, KLF6, IRF1, IFI6, ISG15, IL-1B, CXCR4 and S100A9 were highly expressed in COVID-19 patients vs HCs in myeloid cells (3.3).
Supplementary figure 4. Analysis NK&T subsets landscape in COVID-19 patients. The UAMP plot showing subtype-specific marker genes of NK&T cells including KLRF1, KLRC1, PRF1, CCL5, TCF7, LEF1, CD69, CD27, CTLA4, CCR6, GZMB and TYMS (4.1). The heatmap of proliferation T cells showing the DEGs between COVID-19 patients and HCs (4.2). The volcano plot shows the DEGs of COVID-19 patients vs. HCs in proliferation T cells (4.3). The violin plot shows the CXCR4, STAT3, MKI167, IRF1, IFNG, ISG15, IFRD1, IFI6 and S100A9 were highly expressed in COVID-19 patients vs HCs in T & NK sub-clusters (4.4).
Supplementary figure 5. Analysis B cell subsets landscape in COVID-19 patients. The UAMP plot showing subtype-specific marker genes of B cells including TCL1A, IGHM, IGHG1, XBP1, IGHD and MS4A1 (5.1). The heatmap of plasma B cells showing the DEGs between COVID-19 patients and HCs (5.2). The volcano plot shows the DEGs of COVID-19 patients vs. HCs in plasma B cells (5.3).
Acknowledgements
This study was supported by National Natural Science Foundation of China (Grant No. 81722034, 81670015, 81830054, 81530028, 91953122, 31871326, 81721003, 81988101), the Ministry of Science and Technology Key Program (Grant No. 2018ZX09101002, 2017ZX100203205), Shanghai Pujiang Program (Grant No. 2019PJD059), and Guangdong Natural Science Funds for Distinguished Young Scholar (Grant No. 2016A030306006, 2020B1515020057).
Footnotes
Disclosure of potential conflicts of interest: The authors declare no competing financial conflicts of interest.
References


