
Abstract
We present a method for efficiently comparing the progression of Covid-19 epidemic among different countries. The paths they take are similar enough that the earlier China outbreak can be used to provide projections for other countries. The delayed reaction of European countries is shown to produce a much worse outcome compared to China.
As the Covid-19 disease is spreading in many countries around the world, it is of prime importance for authorities to be able to easily estimate the dynamics of the epidemics, the expected effects of restrictions imposed to the population and the impact of delays in their application.
Since China suffered from the epidemics before the rest of the world and imposed confinement measures whose effect has become evident in the past few weeks, a natural strategy is to use the Chinese data to analyse the situation of other countries. Various approaches may be used.
An example consists in collecting data about various cities in a given country and comparing them to a set of historical data collected in a series of cities in China. Coupled to epidemic spreading modelling, this procedure may help to extrapolate the trends to be expected in the cities under study, and to deduce forecasts for the whole country. Unfortunately, as the cities considered are still in a very early stage of the epidemic’s development, such a type of approach is very difficult and extrapolations obtained may be of weak reliability. For instance, such a study released on March 8 predicted that the final total diagnosed confirmed cases in Italy after the end of the epidemic would be around 7,000+/-1,000 [1]. This number was clearly significantly underestimated as the official records were already exceeding 15,000 confirmed cases four days later. This shows the need of a simpler but more robust method in order to guide authorities.
In this short note we suggest a simple way of visualising the epidemic trajectories of various countries, which enables an easy and direct comparison with China. It immediately appears that several European countries and the USA have followed rather well China’s trajectory up to now. Thus, order of magnitude estimates of what may be expected for the weeks to come can be provided. This highlights the strong impact which delays in authority reaction may produce on the further stages of the epidemic.
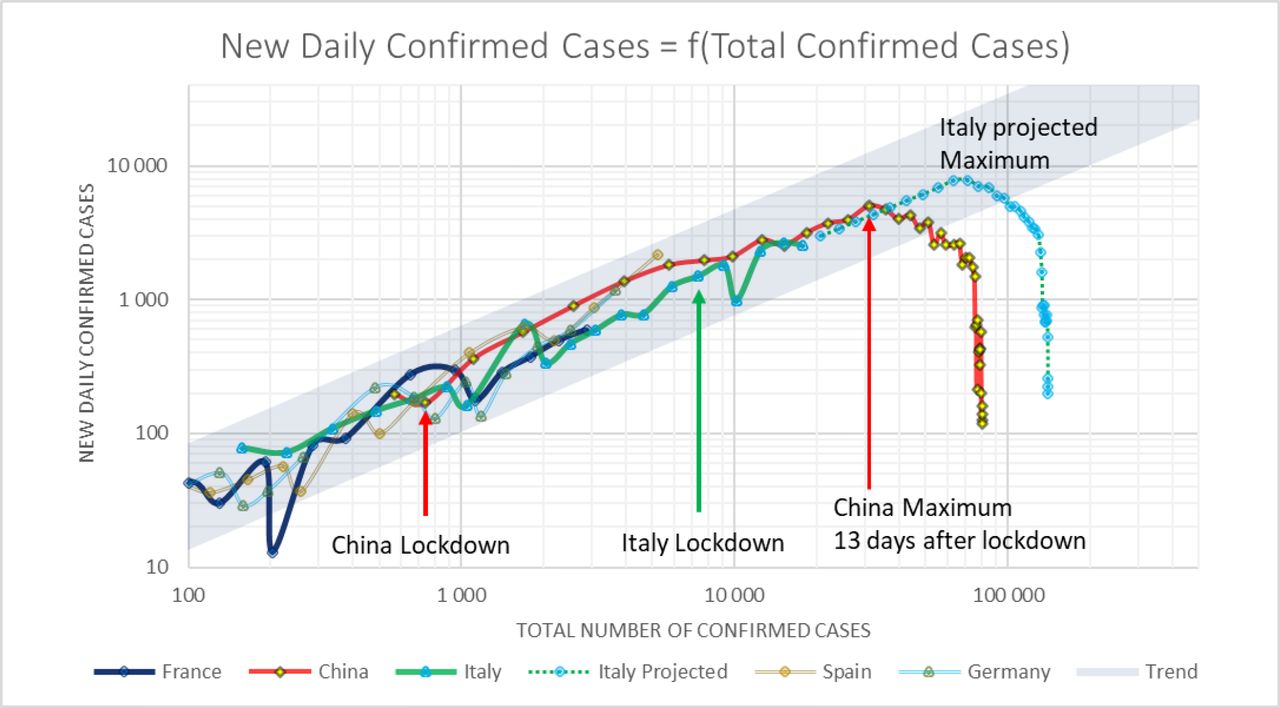
In figure 1, rather than time series, we plot the number of daily new confirmed cases as a function of the total number of confirmed cases, for several countries [2,3]. This is equivalent to phase space plots commonly used to represent dynamical systems in physics. Although it may seem a bit abstract, such a plot enables a direct comparison of the otherwise non synchronous curves of the disease progression for the different countries. As data span several orders of magnitude, logarithmic scales are used. It is clearly visible that within individual variations, China trajectory is tracked rather closely by the other countries.
New daily confirmed cases as a function of the total confirmed cases of Covid-19 for China, Italy, France, Germany and Spain. All countries exhibit similar epidemic progression within a certain band. Projection for Italy (dotted line and blue points) takes into account a 13-day delay beyond lockdown to reach the maximum daily confirmed cases as observed in China.
It should also be observed that the maximum in the daily confirmed cases in China, occurred some 13 days after a stringent lockdown was set in place in Wuhan and its region, soon further expanded. This delay is similar to the one separating the onset of symptoms from the time of diagnosis, as found in interviews of patients [4]. Beyond the maximum, the China curve falls off while the number of confirmed cases still increases. This number finally stabilizes and reaches a significantly higher value than what was recorded at the maximum. At this stage, the number of daily cases becomes very small, the virus propagation has essentially been stopped.
Comparing the plots, it is immediately visible on Figure 1 that the Italian lockdown was decided approximately 10 days later than China into the epidemic progression. One may readily try to estimate the final number of cases to be expected by assuming that Italian lockdown will have the same effect as the Chinese lockdown. The ascending part of the Italian curve can be well approximated by a straight line with a slope α = 0.818 in logarithmic scale, corresponding to the following dependence:
 where N(t) is the number of confirmed cases as a function of time, expressed in days starting February 23 with N0 = 157 confirmed cases, indicating an approximate power law dependence. Assuming the progression regime remains the same over the whole ascending part of the curve, the maximum for Italy is estimated to be reached for a total of confirmed cases around 55,000. Assuming the efficiency of the Italian lockdown to be similar to that of China, we then add a fall-off part matched with the Chinese fall-off which adds an extra 1.7 times the number of cases at the maximum. This yields a final number of order 140,000 cases. Using the current mortality rate measured in Italy to be 7.2% as of March 13 [5], a value significantly higher than the average WHO estimate of 3.4%, this would in turn lead to a death toll of over 10,000, compared to China’s under 3,300.
In the case of France, school and University closure decisions were announced on March 12 by president Macron, to be active starting March 16, thus approximately at the same progression point in the epidemics as when Italy applied full lockdown. This will likely lead France towards an outcome in number of cases of the same magnitude as Italy’s number, possibly compounded by the fact that the measures are, as of March 14, not as stringent.
This approach thus provides guideline estimates based on the currently available data. It anyhow shows how fast the confirmed cases and the corresponding death toll will sharply increase as the two countries both France and Italy waited longer before taking lockdown actions. Just for Italy, the 10 days delay compared to China may cause the number of deaths to be around three times larger. In addition, Germany and Spain appear to be at a similar stage, indicating that the total death toll in Europe will far exceed China’s death toll.
It should be said that data from China was available early for European authorities, and thus allowed more time to prepare an informed and coordinated response to the coming outbreak. The earlier lockdown in China appears to have limited the impact of the Covid-19 epidemic. The time lost to initiate a similar level of action may unfortunately result in a death toll increased by the thousands relative to the China outbreak.
We hope that visual representations like the one we present in this note can help to better anticipate the epidemic dynamics, and help decision making.
Data Availability
All data used are public and available through the internet links provided in the paper.


