
Abstract
Mobile phone apps implementing algorithmic contact tracing can speed up the process of tracing newly diagnosed individuals, spreading information instantaneously back through a past contact network to inform them that they are at risk of being infected, and thus allow them to take appropriate social distancing and testing measures. The aim of non-pharmaceutical infection prevention is to move a population towards herd protection, a state where a population maintains R0<1, thus making it impossible for a pathogen to cause an epidemic. Here, we address epidemiological issues that affect the feasibility of an algorithmic approach to instantaneous contact tracing; ethical and implementation issues are addressed separately. First we quantify the parameters of COVID-19 in a framework that is consistent with the renewal equation formulation of epidemic spread. Second, we use an analytical solution to application of first-degree contact tracing in the renewal equation model to explore combinations of efficacy that can induce herd protection (R0<1). With the emergence of the novel viral pathogen SARS-CoV-2, of clear potential for a global pandemic with high fatality rates and incapacitated health systems, the question of prevention has critical priority. We come to the conclusion that isolating symptomatic cases and tracing their contacts in a classical manner is not sufficiently fast to stop the spread of the epidemic and needs to be accompanied by measures of social distancing that are disruptive to a wide number of people. We show that first-degree instantaneous contact tracing, informing users when they can move safely or when to seek medical help and avoid vulnerable individuals, has the potential to stop the spread of the epidemic if used by a sufficiently large number of people with reasonable fidelity.
Introduction
The new viral pathogen SARS-CoV-2 emerged in late 2019, leading to exponential rise of new cases and causing tens of thousands of documented cases of COVID-19 disease to date. Human-to-human transmission was initially focused in the Hubei province of China, but has now seeded growing epidemics around the world. The virus is likely of bat origin, with a possible intermediate animal host, and most of the first documented cases were linked to environmental exposure in the Huanan Seafood Wholesale Market in early December 2019. The virus is sufficiently genetically similar to the 2003 SARS-CoV-1 virus that it is reasonable to expect some aspects of epidemiology to be similar, and then update these views as new data emerge. So far, new analyses indicate that SARS-CoV-2 is more infectious and less virulent than SARS-CoV-1, and could have greater epidemic potential due to greater difficulties in tracing mild or asymptomatic infections. No treatment is currently available, and while the development of a vaccine is proceeding as fast as possible, the need to test any candidates for safety in humans means that vaccines will not be available for several months at the earliest. The only tools that we currently have to stop the epidemic are those of classical epidemic control, like contact tracing, social distancing and quarantine. The aim of this paper is to explore the feasibility of achieving herd protection (R0<1) using isolation coupled to classical contact tracing by questionnaires and people versus algorithmic instantaneous contact tracing assisted by a phone app.
The biomechanics of transmission of betacoronaviruses are well understood in general terms: the virus can pass from one individual to another through exhaled droplets (1), aerosol (2), contamination of surfaces (3), and possibly through fecal-oral contamination (4). Rather than comparing transmission through these different physical routes, here we compare different transmission routes that are more closely aligned to their implications for prevention. Specifically we propose four categories. 1.
Symptomatic transmission: direct transmission from a symptomatic individual, through a contact that can be readily recalled by the recipient. 2. Pre-symptomatic transmission: direct transmission from an individual that occurs before the source individual experiences noticeable symptoms. (Note that this definition may be context specific, for example based on whether it is the source or the recipient who is asked whether the symptoms were noticeable.) 3. Asymptomatic transmission: direct transmission from individuals who never experience noticeable symptoms. This can only be established by follow-up, as single time-point observation cannot fully distinguish asymptomatic from pre-symptomatic individuals. 4. Environmental transmission: transmission via contamination, and specifically in a way that would not typically be attributable to contact with the source in a contact survey (i.e. we exclude from this transmission pairs who were in extended close contact, but for whom in reality the infectious dose passed via the environment instead of more directly). These could be identified in an analysis of spatial movements. We acknowledge that boundaries between these categories may be blurred, but these broadly have different implications for prevention. These will be spelled out in future work on modelling different prevention approaches, and may be mapped to other modelling studies, some old and general (5) (6) and one more specific to COVID-19 (7).
Evidence exists that each of these routes of transmission is possible: symptomatic (8), pre-symptomatic (9); asymptomatic (10); and environmental (8). For prevention, the crucial information is the relative frequency of different routes of transmission: finite resources must be divided between different intervention strategies.
Li et al (8) presented self-reported data on exposure for the first 425 cases in Wuhan. Some of these reported visiting the Huanan Seafood Wholesale Market; the generalisability of transmission in that setting to other settings is highly uncertain, as this large-scale event seeded the epidemic in the absence of any knowledge about the disease. After closure of the Huanan Seafood Wholesale Market on January 1st, of 240 cases with no exposure to any wet market, 200 individuals (83%) reported no exposure to an individual with respiratory symptoms. Inaccurate recall may explain some responses, but unlikely as much as 83% of them.
The situation in Singapore at first glance appears quite different. As of March 5th, 2020, there have been 117 cases, of which 25 were imported. By devoting considerable resources including police investigation, 75 of the 92 cases of local transmission have been traced back to their presumed exposure, either to a known case or to a location linked to spread (https://infographics.channelnewsasia.com/covid-19/coronavirus-singapore-clusters.html?cid=FBcna).
However, linking two cases generally includes the possibility that one infected the other pre-symptomatically and only later became symptomatic; furthermore, linking cases via a location generally includes the possibility of environmentally mediated transmission. Therefore the large fraction of traceable transmission here does not contradict the large fraction without symptomatic exposure in Wuhan. A conservative reading of the Singapore data serves only as evidence against a large role of asymptomatic transmission.
The most accurate and robust quantification of the relative frequency of routes of transmission would be a well-designed prospective cohort study with detailed journal and phylogenetic investigations. However, the current global emergency requires timely estimates using imperfect data sources. We performed a detailed analysis of the timing of events in defined transmission pairs, derived the generation time distribution, and attributed a probability for each pair that transmission was pre-symptomatic. We also fit a mathematical model of infectiousness, through the four routes discussed above, over the course of infection. This allowed us to calculate the R0, estimate the proportion of transmission from different routes, and make predictions about whether contact tracing and isolation of known cases is sufficient to prevent a large-scale spread of the epidemic.
Results
Exponential doubling time, T2
We calculated the exponential growth rate of the epidemic, r, from the early stages of the epidemic in China, such that the effect of control measures discussed later will be relative to the early stages of an outbreak, exemplified by baseline contact patterns and environmental conditions in Hubei during that period. We note that this assumption is implicit in many estimates of R0. The epidemic doubling time T2, equal to loge(2) / r, was previously estimated as 7.4 days (95% confidence interval (CI) 4.2 to 14) from data on the first 425 cases in Wuhan (8), and independently as 7.2 days (95% credible interval 4.7 to 16.3) by phylodynamic analysis of 86 whole SARS-CoV-2 genomes (http://virological.org/t/phylodynamic-analysis-129-genomes-24-feb-2020/356). We analysed the former data source together with the China Centre for Disease Control counts of daily confirmed cases (http://2019ncov.chinacdc.cn/2019-nCoV/), visually identified two periods of consistent early exponential growth, and obtained a more precise combined estimate of T2 = 5.0 days (95% CI 4.3 to 6.2). See Figure 1.
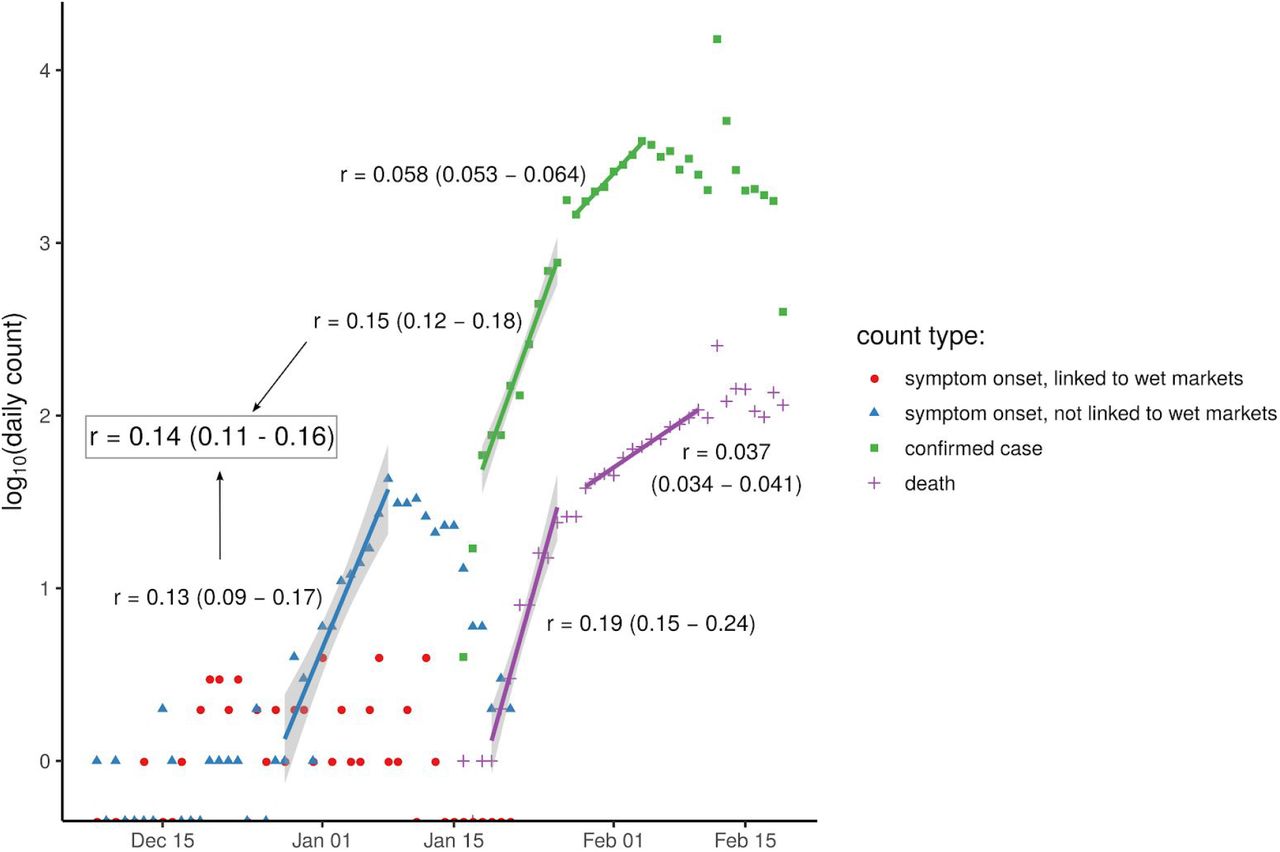
daily counts from two sources. Numbers of people later reporting symptoms beginning that day, from the first 425 cases analysed by (8), are shown for those reporting exposure to a wet market (red circles) and those reporting no exposure to any wet market (blue triangles). Also shown are numbers of people confirmed as cases each day (green squares) and number of deaths each day (purple plus signs) from China Centre for Disease Control data. Five visually identified periods of exponential growth have the best-fit linear model shown with a coloured line and 95% confidence intervals in grey shading. Two of these fits (blue and first green) were merged into a single best estimate of the epidemic exponential growth rate r (grey box). Counts of zero are shown on the x axis (log(0) being undefined).
Incubation period distribution
The incubation period is defined as the time between infection and onset of symptoms. It is estimated as the time between exposure and report of noticeable symptoms. We used the incubation period distribution calculated by (11). The distribution is lognormal with mean 5.5 days, median 5.2 days and standard deviation 2.1 days, and is included with our results in Figure 2.

our inferred generation time distributions, in black. Thicker lines denote higher support for the corresponding functional form, with the Weibull distribution being the best fit. For comparison we also include the serial interval distributions previously reported by (8) (in light blue) and (12) (in grey), and the incubation period distribution we used here from (11).
Generation time distribution
The generation time is defined for source-recipient transmission pairs as the time between the infection of the source and the infection of the recipient. Because time of infection is generally not known, the generation time is often approximated by the (clinical onset) serial interval, which is defined as the time between the onset of symptoms of the source and the onset of symptoms of the recipient. We did not take that approach here: we directly estimated the generation time distribution from 40 source-recipient pairs for whom direct transmission is suspected, and where time of onset of symptoms is known for both source and recipient. We combined dates of symptom onset with intervals of exposure for both source and recipient (when available) and the above distribution of incubation times, and inferred the distribution of generation times. The distribution is best described by a Weibull distribution with mean and median equal to 5.0 days and standard deviation of 1.9 days, shown in Figure 2. We also show the results of sensitivity analysis to different functional forms, and compare to two previously published serial interval distributions - those of (12) and (8). Our distribution is robust with respect to the choice of transmission events (Supplementary Figure 5). The distribution of serial intervals for these pairs is shown in Supplementary Figure 3.

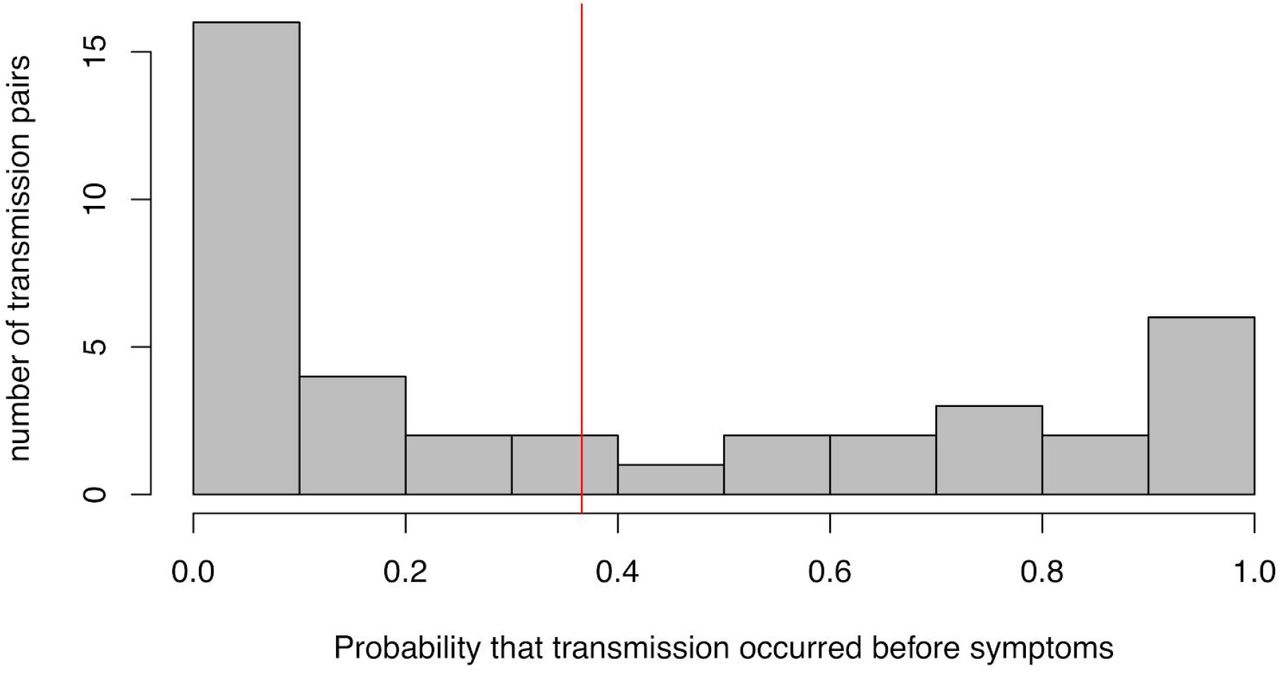
distribution of the posterior probability of pre-symptomatic transmission among all 40 transmission pairs studied here. The red line indicates the mean probability of transmission occurring before the onset of symptoms in the infector.
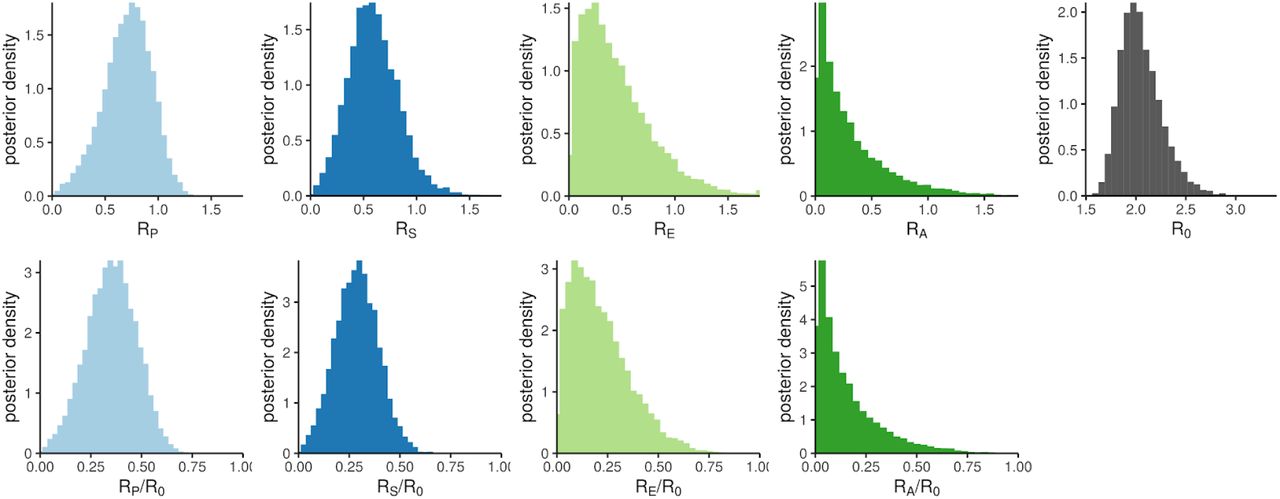
the probability density for output parameters of the infectiousness model, from sampling the uncertainty distributions of the input parameters. The top panels show absolute reproduction numbers: the four contributors to R0 (from pre-symptomatic, symptomatic, asymptomatic and environmental transmission respectively, with the bin at 1.8 containing overflow) and R0 itself. The bottom panels show the fractions of R0 that each contribution represents.
The proportion of transmissions from before symptoms develop
For each of the 40 transmission pairs we estimated the posterior probability that transmission was pre-symptomatic, i.e. occurred before the onset of symptoms in the infector. We used a Bayesian approach with an uninformative prior (transmission before or after symptoms equally likely). The 40 probabilities inferred are shown in Figure 3; the mean probability is 37% (95% CI: 27.5% - 45%), which can be interpreted as the fraction of pre-symptomatic transmission events out of pre-symptomatic plus symptomatic transmission events. This value does not depend significantly on the choice for the functional form of the distribution of generation times (Supplementary Figures 6-7), or on the choice of transmission events (Supplementary Figure 8).
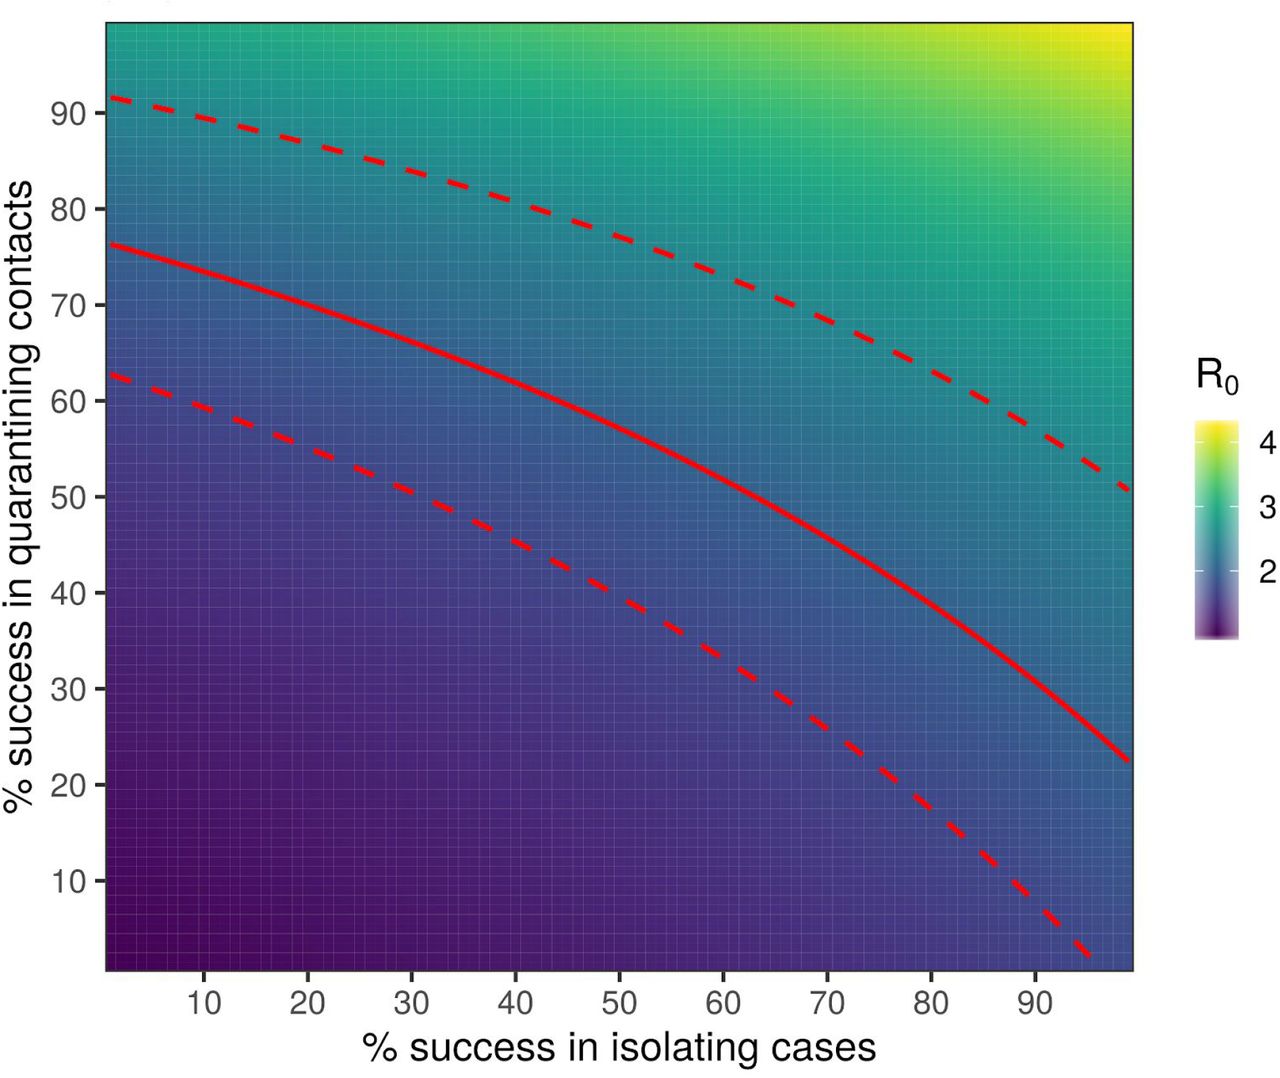
heat map plot showing the maximum possible R0 that could be contained (by reduction to less than 1) for a pathogen with the same generation time distribution that we have inferred for SARS-CoV-2, as a function of the success rate of instant isolation of symptomatic cases (x axis) and the success rate of instant contact tracing (y axis). Contours of constant R0 on this plot show the different combinations of the two success rates that would be able to control the epidemic for an R0 of that value. The solid red line is such a contour for our central estimate of R0 for SARS-CoV-2, with the associated CIs in dashed red lines; these therefore show our best estimate of the required efficacy of case isolation and contact tracing.s
A general deterministic mathematical model of infectiousness
We use a mathematical formalism (13) that describes how infectiousness varies as a function of time since infection, τ, for a representative cohort of infected individuals. This includes heterogeneity between individuals, and averages over those individuals who infect few others and those who infect many. This average defines the function β(τ). Infectiousness may change with τ due to both changing disease biology (notably viral shedding) and changing contact with others. The area under the β curve is the reproduction number R0.
We decompose β(τ) into four contributions that reflect our categorisation above, namely asymptomatic transmission, pre-symptomatic transmission, symptomatic transmission, and environmental transmission. The area under the curve of one of these contributions gives the mean total number of transmissions over one full infection, via that route - asymptomatic, pre-symptomatic, symptomatic or environmental - which we define to be RA, RP, RS and RE respectively. The sum of these is R0.
The mathematical form for β(τ) is:

βs(τ) is the infectiousness of an individual currently either symptomatic or pre-symptomatic, at age-of-infection τ. All of the parameters feeding into the infectiousness model are listed in Table 1. The infectiousness model result using central values of all parameters is shown in Figure 4.
Parameters of the infectiousness model

the average infectiousness (rate of infecting others), β, as a function of the amount of time one has been infected, τ. The contributions of four routes of transmission are shown in colours, stacked on top of one another, so that the total area of one colour is the average number of transmissions via that route over the whole course of infection. Values are rounded to one decimal place. The total area from all colours is the basic reproduction number R0. Stopping disease spread requires reduction of R0 to less than 1: blocking transmission, from whatever combination of colours and values of τ we can achieve, such that the total area is halved.
Uncertainty analysis for the mathematical model of infectiousness
By drawing input parameter sets from the uncertainties shown in Table 1, we quantified our uncertainty in R0 and its four contributions. The resulting values are shown in Table 2 and their underlying distributions are shown in Figure 5.
R0 and its components.
For comparison with our analysis of pre-symptomatic transmission just within the 40 transmission pairs, the estimate of RP/(RP+RS) obtained by this method is 0.55 (0.36 - 0.72).
We define θ as the fraction of all transmissions that do not come from direct contact with a symptomatic individual: 1 − RS /R0. This corresponds to the θ of (5) in the case where there is only pre-symptomatic or symptomatic transmission. From Table 2 this is 0.62 (0.50 - 0.92). The value of θ observed during an exponentially growing epidemic will be distorted when the timing of the different contributions to transmission occur at different stages of the infection, due to over-representation of recently infected individuals. This effect can be calculated through use of the renewal equation, as was recently done to calculate the distribution of time from onset of COVID-19 symptoms to recovery or death (15) (see Supplementary Information). We calculated the θ that would be observed with the early exponential growth seen in China as 0.68 (0.56 - 0.93). The correction due to the epidemic dynamics is small compared to parameter uncertainties.
We developed our mathematical model of infectiousness into a web application where users can test the effect of alternative parameter combinations: https://bdi-pathogens.shinyapps.io/covid-19-transmission-routes
Interventions
Finally, we determined the combined impact of two interventions: (i) isolation of symptomatic individuals, and (ii) tracing the contacts of symptomatic cases and quarantining them. These interventions aim to stop the spread of the virus by reducing the number of transmissions from symptomatic individuals and from their contacts, while minimising the impact on the larger population. In practice, both these interventions are successful or possible only for a fraction of cases. The success rate of these interventions determines the long-term evolution of the epidemic. If the success rates are high enough, the combination of isolation and contact tracing/quarantining could bring R0 below 1 and therefore effectively control the epidemic.
For classical contact tracing, results previously derived in (5) show that with any realistic implementation of contact tracing, epidemic control is not feasible. An algorithmic approach, embedded in a phone App or operating system, can make the contact tracing and notification instantaneous, and enables information to be spread to contacts whether recalled or not. This approach is mathematically solved analytically in Supplement Information for the case of algorithmic instantaneous contact tracing of first-degree (i.e. tracing and quarantining only contacts, not contacts of contacts).
The success rates of this isolation and instantaneous contact tracing in achieving herd protection from SARS-CoV-2 epidemic is shown in Figure 6 for different values of R0. The red line corresponds to a central estimate of R0=2; any successful intervention requires success rates above the red line. These values depend on the incubation period and generation time. We also estimated the growth rate of the epidemic as a function of the success rates of the interventions and of the value of R0 prior to the interventions (Supplementary Figures 9 - 15).
The calculation shown in Figure 6 used our inference of the generation time interval, which is limited so far by the early availability of data on known transmission pairs with known timings. However the position of the epidemic control threshold (red line) should prove relatively robust to future data on the generation time interval, assuming that the estimates on the growth rate of the epidemic, r, do not increase. For example, shifts to shorter generation times would mean earlier intervention is required in each individual’s infection, but for fixed r this would also imply a smaller value of R0 and therefore a smaller fractional reduction would be needed.
Inevitable delays in isolating individuals after they show symptoms reduce the effectiveness of the intervention, moving the boundary for epidemic control (the red line in Figure 6) out to larger values. The same is true of delays in quarantining contacts, however delays from confirming a case to finding their contacts are not inevitable. Specifically, this delay can be reduced to zero through the use of spatial information coupled to case detection, in the form of a simple app: see Discussion.
Discussion
In this study, we estimate key parameters of the epidemic and use an analytically solvable model of the exponential phase of SARS-CoV-2. Our results suggest that a large fraction of all transmissions occur before individuals develop symptoms. Isolating symptomatic cases and tracking their contacts through classical epidemiological methods is therefore likely to be too slow and resource-intensive to achieve epidemic control. We suggest that a simple algorithm for first degree instantaneous contact tracing in the form of a mobile phone app could dramatically reduce onwards transmission from contacts, to a level that is sufficient to reach herd protection and so stop the virus from spreading in a population.
Our estimate of R0 is lower than most previous published estimates, for example (16) (17) (8), which have assumed SARS-like generation times; emerging evidence for shorter generation times for COVID-19 results in a smaller R0. This means a smaller fraction of transmissions need to be blocked for herd protection, but there is a smaller window of time for each infected individual to prevent their onward transmission.
We provide estimates of key quantities intended to help inform intervention strategies. We provide two approaches suggesting that between a third and a half of transmissions occur from pre-symptomatic individuals. Our infectiousness model suggests that the total contribution to R0 from pre-symptomatics is 0.9 (0.2 - 1.1). For SARS, the corresponding estimate was almost zero (5), immediately telling us that different containment strategies will be needed for COVID-19. While preparing this manuscript, results supporting a large role for pre-symptomatic submission were shared: Tindale et al. found that serial intervals in Tianjin and Singapore were on average 2-3 days shorter than incubation periods (https://github.com/carolinecolijn/ClustersCOVID19/blob/master/COVID_19_Singapore_Tianjin_analysisSUPP-joined.pdf), consistent with our estimate of a shorter generation time.
Cleaning and decontamination are being deployed to varying levels in different settings, and improved estimates would help inform this as a priority. For SARS, there were seemingly almost no asymptomatic infections (18), whereas asymptomatic infection has been widely reported for COVID-19, e.g. (10). We argue that the reports from Singapore imply that even if asymptomatic infections are common, onward transmission from this state is probably uncommon, since forensic reconstruction of the transmission networks has closed down most missing links. There is an important caveat to this: the Singapore outbreak to date is small, and has not implicated children. There is widespread speculation that children could be frequent asymptomatic carriers and potential sources of SARS-CoV-2 (19), a finding that is being urgently explored.
Our model shows that the epidemic is highly unlikely to be contained by solely isolating symptomatic individuals. Published models (5) (20) (6) (7) suggest that in practice manual contact tracing can only improve on this to a limited extent.
We have developed a web interface to explore the uncertainty in our modelling assumptions https://bdi-pathogens.shinyapps.io/covid-19-transmission-routes. This will also serve as an ongoing resource as new data becomes available and as the epidemic evolves.
To control SARS-CoV-2 we need to reduce R0 below 1; we do not need to stop all transmissions. Figure 4, and its interactive web-interface, show the preventative potential of targeting different routes of transmission and different stages of the infection. Blocking transmission from individuals at early stages of their infection is generally more challenging. Contact tracing is made more effective by responding rapidly to an individual’s first signs of symptoms, by instantaneously tracking down contacts of confirmed cases, and by general preventative population measures such as enhanced hand and respiratory hygiene, decontamination, and social distancing.
Digital contact tracing and quarantining could play a critical role both in reducing these delays and increasing success rates. Further modelling is required to compare the number of people disrupted under different scenarios consistent with herd protection. We do not agree with the assessment that a pandemic is inevitable, and recommend urgent exploration of means to reverse the current phase of exponential spread.
Methods
Generation time distribution
The distribution of generation times was inferred by Maximum Composite Likelihood (see Supplementary Information) from serial intervals and exposure periods of 40 transmission pairs with known dates of onset of symptoms. Some of the 40 transmission pairs were taken from references (21), (22), (23), (8); some taken from a previous estimate of serial intervals (12); some we identified from other reports (see Supplementary Table). The best fit among tested two-parameter distributions (lognormal, gamma, Weibull) was selected using the Akaike Information Criterion.
Probability of pre-symptomatic infection
The probability that infection occurred before onset of symptoms for the infector was estimated for each transmission pair using a Bayesian approach based on the best fit for the generation time distribution (see Supplementary Information). This estimate assumes independence between generation time and incubation period, but takes into account the available information on period of exposure and onset of symptoms for each case.
Exponential growth rate
We identified the dates following consistent early exponential growth as December 28th - January 8th inclusive for Li et al.’s dates of symptom onset for cases not linked with any wet market, and January 18th - 26th inclusive for the Chinese CDC dates of case confirmation, as illustrated with the blue and earliest green line in Figure 1. We fit a single linear model to log(case counts) from both of these periods, constraining both sets of counts to have the same gradient (but different intercept, due to the delay between onset of symptoms and case confirmation).
Infectiousness model
Our model for infectiousness β(τ) was solved first by fitting the shape of the pre-symptomatic + symptomatic contributions to our inferred generation time interval: these functions are proportional to each other when the transmission pairs analysed for the generation time distribution represent pre-symptomatic and symptomatic exposure in the proportion representative of overall epidemic spread. We make that assumption here. This assumption would be violated by biased selection of transmission pairs for sampling. For example if the infector being in a later, symptomatic stage of infection makes identification of the pair more likely, then a data set of identified pairs will be undersampled for pre-symptomatic exposure and will overestimate the typical generation time. The next step in solving the model was calculating the relative scaling constant of the environmental contribution to β(τ) to give the required RE/R0, and finally the overall scaling constant of β(τ) is determined to reproduce the observed exponential growth rate (see Supplementary Information).
Infectiousness model uncertainty
We drew 10,000 input parameter sets from the uncertainties shown in Table 2. For the data-driven parameters, these uncertainties are likelihoods, which can be interpreted as posteriors if one’s prior is an improper uniform distribution; we fit lognormal distributions to the 95% CIs and central estimates in order to obtain the full distribution. For the other parameters, the uncertainty distributions are pure priors.
Impact of interventions
To calculate the impact of contact tracing and isolation, we followed the mathematical treatment of (5), explained in detail in the Supplementary Information. Specifically, we solved for the epidemic dynamics of the quantity Y(t, τ, τ’): the number of individuals at time t who were infected at a time t - τ by individuals who were in turn infected at time t - τ’, subject to case isolation and contact tracing interventions. Both interventions are assumed to be immediate upon individuals showing symptoms, but both have efficacies that can vary continuously between 0 and 1.
Data Availability
Data included in Supplementary.
Acknowledgments
We thank Will Probert, Lucie Abeler-Dörner, Andrei Akhmetzhanov, Alice Ledda, Ben Cowling and Gabriel Leung for helpful comments. This work was funded by the Li Ka Shing Foundation. The funder played no role in study conception or execution.
References


