
Abstract
The novel coronavirus disease 2019 (COVID-19) outbreak on the Diamond Princess ship has caused over 634 cases as of February 20, 2020. We model the transmission process on the ship with a stochastic model and estimate the basic reproduction number at 2.2 (95%CI: 2.1−2.4). Through estimating the dispersion parameter which quantifies the superspreading events, we find that stochastic bursts were unlikely to occur when the reproduction number is less than 1. The epidemic doubling time is at 4.6 days (95%CI: 3.0−9.3), and thus timely actions were crucial. The lesson learnt on the ship is generally applicable in other settings.
Backgrounds
The coronavirus disease 2019 (COVID-19), caused by the severe acute respiratory syndrome coronavirus 2 (SARS-CoV-2), emerged in Wuhan, China in the end of 2019, and spread to over 40 foreign countries in a short period of time [1-3]. The World Health Organization (WHO) declared the outbreak to be a public health emergency of international concern on January 30, 2020 [4]. To date, there are over 70000 COVID-19 confirmed cases in China, and over 2000 cases outside China. The COVID-19 outbreak on the Diamond Princess, a British cruise ship that contains 3711 tourists and crew members, caused 634 confirmed cases as of February 20, 2020 and became the largest outbreak outside China [5].
In this study, we model the COVID-19 outbreak on the Diamond Princess ship, estimate the key epidemiological parameters of this outbreak and explore the effects of several different control measures.
Methods
We consider the population on the Diamond Princess ship as a close cohort with N = 3711 individuals. Following [6], we simulate the transmission process stochastically. For a given COVID-19 case with symptom onset on the t-th day, the number of secondary cases follows a negative binomial (NB) distribution with a mean at Reff(t) and a dispersion parameter at k [7]. The Reff(t) is the effective reproduction number, and Reff(t) = R0[N – C(t)]/N, where C(t) is the cumulative number of cases at the t-th day and R0 is the basic reproduction number of COVID-19 to be estimated. The time delay between symptom onset dates of a primary case and any of its associated secondary cases is the serial interval (SI). Hence, for a given primary case with symptom onset on the t-th day, the symptom onset time of each associated secondary case is expected to be the summation of t and SI of COVID-19. It is conventional to assume the SI to follow a Gamma distribution with mean at 4.5 days and standard deviation (SD) at 3.1 days [8, 9].
We collect the confirmed cases time series released in the situation reports of COVID-19 infections in Japan [5]. We simulate the courses of the COVID-19 outbreaks stochastically starting from one infectious index case on January 20, 2020. We calculate the maximum likelihood estimates of R0 and k by fitting model to the number of confirmed cases with Poisson-distributed likelihood framework. The 95% confidence intervals (95%CI) of R0 and k are calculated by using the profile likelihood estimation framework with a cutoff threshold determined using a Chi-square quantile [10].
We repeat the fitting and estimation procedures above under an alternative scenario with mean SI at days and SD at 3.4 days, which was estimated in [2]. We evaluate the modelling performance with mean SI at 4.5 or 7.5 days by the Akaike information criterion (AIC). Under the later scenario with mean SI at 7.5 days, we find that the R0 is larger than 5 which is not in line with WHO estimates and hard to justify in a ‘quarantine’ setting. In particular, the later scenario yields a higher AIC by 10 units than the former scenario with mean SI at 4.5 days. Thus, we argue the former scenario is most likely the reality, and consider it as the main results.
Furthermore, we consider four ‘what-if’ scenarios and they were
scenario (0): the best-fit model, i.e., baseline scenario;
scenario (1): 1000 susceptibles were removed on February 11, 2020;
scenario (2): the R0 was reduced to 1.5; and
scenario (3): combining scenarios (1) and (2).
We simulate the model under four different scenarios and estimate the key epidemiological parameters. We estimate the cumulative number of cases on February 20, the outbreak final size, the epidemic doubling time and the peaking time to capture the patterns of outbreak.
Results
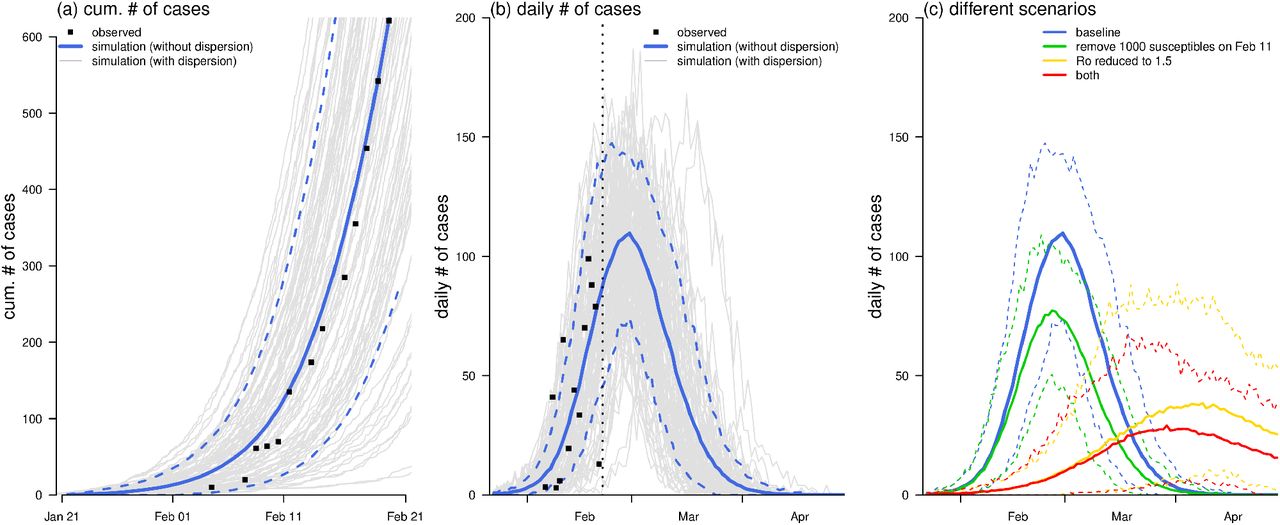
With a mean SI at 4.5 days, we estimate the R0 to be 2.2 (95%CI: 2.1−2.4), which is consistent with previous estimates [7, 8, 11]. The fitting results are shown in Fig 1(a) and (b), which match the observed data well. We estimate the dispersion term (k) to be 44 (95%CI: 6−88), which is significantly larger than 1 and consistent with [7]. The simulation results with or without dispersion term (k) were largely consistent, which suggests absent of superspreading events (note that low k implies high chance of superspreading events).
The observed (dots) and fitted (curves) number of COVID-19 cases on the Diamond Princess ship. Panel (a) shows the cumulative number of cases, and panel (b) shows the daily number of cases. In panels (a) and (b), the black dots are the observed number of cases time series, the blue curves are the simulation median (bold) and 95% CI (dashed), and the grey curves are 1000 simulation samples. In panel (b), the vertical black dashed line is February 20, 2020. Panel (c) shows the estimated epidemic curves under different scenarios. The bold curves are the simulation median, and the dashed curves are the 95% CIs. In panels (b) and (c), the blue curves show the baseline scenario, and they are the same.
Without control measures, we estimate that the COVID-19 outbreak is likely to cause 3066 cases (95%CI: 2046−3441) on the ship, and the epidemic curve is likely to peak around February 28, 2020 with a doubling time at 4.6 days (95%CI: 3.0−9.3), see Fig 1(b) and Table 1. Under scenario (1), timely reduction in the susceptible population could lower the final size and sustainably reduce the daily incidences. Under scenario (2), the lower the R0, decreasing from 2.2 to 1.5, the lower the final size and the later the peaking time will be. If the susceptible pools and R0 are reduced simultaneously, the COVID-19 outbreak on the ship will be likely mitigated and postponed largely, see Fig 1(d).
Summary of the key epidemiological estimates of the outbreak under different scenarios.
Discussion
The R0 of COVID-19 on the Diamond Princess ship is likely to be lower than that of the severe acute respiratory syndrome (SARS) which ranges from 2.2 to 3.6 [12]. The k quantifies the chance of the superspreading events and a large k (> 1 significantly) implies that the stochastic bursts on the ship was less likely to occur if the reproduction number is less than 1 [6, 7, 13]. On the other hand, our finding highlights the different characteristics between COVID-19 (less superspreading) and SARS (more superspreading), which should be taken into consideration into mitigation. As such, the self-protection actions including wearing facemasks, reducing outdoor activities or gathering and maintain hygiene and sterilized, were thus recommended.
The situation on the Diamond Princess cruise implies that the virus could spread rapidly, most likely with a short SI than previously estimated [2]. Note that a recent study on the 1099 patients found that the median of incubation period is only 3 days, thus a short effective SI is also possible [14]. With a shorter SI, a relatively lower R0 could also result in a rapid growth of the epidemic size [15], and with a shorter epidemic doubling time as we show in Table 1. Therefore, timely contact tracing and effectively quarantine were crucial to shutoff the transmission.
The simulation results under scenarios (1)-(3) indicate that the public health control measures could effectively mitigate the COVID-19 outbreak on the ship in terms of the final size, see Table 1. Decreasing the disease transmissibility in terms of R0 could postpone the peak, which may gain valuable time to prepare and allocate the resources in response to incoming patients. Relocating the population at risk (if possible) could sustainably decrease the daily incidences, and thus relieve the tensive demands in the healthcare, and improve in the treatment outcome.
We suggest maintaining the enhancement in both populational level public health control as well as the individual level self-protection actions in combating the COVID-19 outbreak. With detailed information on public intervention, the analytical framework in this study can be extended to a complex context and used for evaluating the effects of certain control measures.
From Japan official reports (https://www.mhlw.go.jp/stf/newpage_09542.html), we obtain the following:
English Translation
2/15/2020 Positive cases were confirmed in 285 of the 930 people tested (including 73 asymptomatic pathogen carriers).
2/20/2020 A total of 634 people (including 328 asymptomatic pathogen carriers) tested positive for a total of 3,063 people.
From the above official announcement of Japan, the cumulative ratio of asymptomatic cases out of all confirmations went up from 25.6% to 51.7% between Feb 15 and Feb 20, 2020. It is hard to believe that such a large amount of asymptomatic cases were infected before the quarantine start date (Feb 5, 2020) and missed in Feb 15 test. The number of tests are much larger than the number of positive results, and this implies high effort of testing and relatively reliable data. It is reasonable to argue that the quarantine is not so successful to prevent the emergence of asymptomatic cases, but successfully slowed down the occurrence of symptomatic cases, as suggested by studies based on cases onset date data. In the other words, quarantine measure likely changed the way how the virus transmitted, thus the level of symptoms of cases. Presumably, in these studies of onset date data only, asymptomatic confirmations are not counted as cases. In this study, we use laboratory confirmations with updated (shorter) serial interval of COVID-19. The lesson learnt here is certainly useful in future similar outbreaks of COVID-19.
Data Availability
We used publicly available data only.
Declarations
Ethics approval and consent to participate
The data were collected via public domain [5], and thus neither ethical approval nor individual consent was not applicable.
Availability of materials
All data used in this work were publicly available via [5].
Consent for publication
Not applicable.
Funding
DH was supported by General Research Fund (Grant Number 15205119) of the Research Grants Council (RGC) of Hong Kong, China and an Alibaba-Hong Kong Polytechnic University Collaborative Research project. WW was supported by National Natural Science Foundation of China (Grant Number 61672013) and Huaian Key Laboratory for Infectious Diseases Control and Prevention (Grant Number HAP201704), Huaian, Jiangsu, China.
Disclaimer
The funding agencies had no role in the design and conduct of the study; collection, management, analysis, and interpretation of the data; preparation, review, or approval of the manuscript; or decision to submit the manuscript for publication.
Conflict of Interests
DH was supported by an Alibaba-Hong Kong Polytechnic University Collaborative Research project. Other authors declare no conflict of interest.
Authors’ Contributions
SZ and DH conceived the study, carried out the analysis, and drafted the first manuscript. All authors discussed the results, critically read and revised the manuscript, and gave final approval for publication.
Acknowledgements
None.
Footnotes
Email address of all authors SZ: zhaoshi.cmsa{at}gmail.com
PC: cphcc{at}smu.edu.cn
DG: dzgao{at}shnu.edu.cn
ZZ: larry.zhuang{at}polyu.edu.hk
MKCC: marc{at}cuhk.edu.hk
YC: yonglicai{at}hytc.edu.cn
JR: jimran{at}connect.hku.hk
KW: wangkaimath{at}sina.com
YL: yijun.lou{at}polyu.edu.hk
WW: weimingwang2003{at}163.com
LY: l.yang{at}polyu.edu.hk
DH: daihai.he{at}polyu.edu.hk
MHW: maggiew{at}cuhk.edu.hk


