
Abstract
Background The ongoing COVID-19 epidemic that spread widely in China since December 2019 is now generating local transmission in multiple countries including Singapore as of February 27, 2020. This highlights the need to monitor in real time the transmission potential of COVID-19. In Singapore, four major COVID-19 case clusters have emerged thus far.
Methods Here we estimate the effective reproduction number, Rt, of COVID-19 in Singapore from the publicly available daily case series of imported and autochthonous cases by date of symptoms onset, after adjusting the local cases for reporting delays. We also derive the reproduction number from the distribution of cluster sizes using a branching process analysis.
Results The effective reproduction number peaked with a mean value ∼1.1 around February 2nd, 2020 and declined thereafter. As of February 27th, 2020, our most recent estimate of Rt is at 0.5 (95% CI: 0.2,0.7) while an estimate of the overall R based on cluster size distribution is at 0.7 (95% CI: 0.5, 0.9).
Conclusion The trajectory of the reproduction number in Singapore underscore the significant effects of containment efforts in Singapore while at the same time suggest the need to sustain social distancing and active case finding efforts to stomp out all active chains of transmission.
Background
The ongoing COVID-19 epidemic started with a cluster of pneumonia cases of unknown etiology in Wuhan, China back in December 2019 (1, 2). The initial cases have been linked to a wet market in the city of Wuhan, pointing to an animal source of the epidemic (3). Subsequently, rapid human- to-human transmission of the disease was confirmed in January 2020, and the etiological agent was identified as severe acute respiratory syndrome-related coronavirus 2 (SARS-CoV-2) due to its genetic similarity to the SARS-CoV discovered in 2003 (4, 5). The total global case tally has reached 83,379 infections including 2858 deaths and involving 51 countries as of February 27, 2020 (2). As the virus continues to spread in the human population, obtaining an accurate “real- time” picture of the epidemic’s trajectory is complicated by several factors including reporting delays and changes in the case definition (6, 7). Although the epidemic appears to be on a downward trend in China, local transmission continues in Singapore, Italy, South Korea and Iran (2). Therefore, detailed epidemiological data from these countries is needed to monitor transmission potential of SARS-CoV-2 in near real-time.
Outside of China, Singapore is one of the hardest hit countries with the COVID-19 epidemic (8), reporting its first symptomatic imported case (a 66 years old Chinese male) on January 23, 2020 (9). Up until February 27, 2020, Singapore has reported 96 laboratory confirmed cases, including 24 reported case importations from Wuhan China (8). Imported cases include six individuals who were evacuated from China between January 30 and February 9, 2020 (10, 11). On February 4, 2020, the Ministry of Health of Singapore reported its first local cluster of COVID-19, which was linked to the Yong Thai Hang shop (12). A total of 11 clusters with 1 or more COVID-19 local cases have been reported thus far. Table 1 summarizes the characteristics of the 5 largest clusters in Singapore.
Characteristics of the largest COVID-19 outbreak in Singapore as of February 27, 2020.
Although large-scale community transmission has not been reported in Singapore, the novel coronavirus can rapidly spread in confined and crowded places, as illustrated by a large cluster of COVID-19 cases linked to the Grace Assembly of God Church and the Life Church and Missions Singapore (13). In China, substantial hospital-based transmission of SARS-CoV-2 has been reported, with a total of 1700 cases involving among healthcare workers (14, 15). This pattern aligns well with past outbreaks of SARS and MERS (16), including substantial nosocomial transmission during the 2003 SARS outbreak in Singapore (17). Thus, the distributions of cluster sizes for SARS and MERS outbreaks are characterized by high heterogeneity (16). To minimize the risk of hospital-based transmission of SARS-CoV-2, the Ministry of Health of Singapore has restricted the movement of patients and staff across hospitals (18). Also, because multiple unlinked community cases of COVID-19 have been reported (19), various social distancing measures have been put in place including advising the public against large social gatherings in order to mitigate the risk of community transmission (20, 21). These social distancing measures reduce the risk of onward transmission not only within Singapore, but also beyond the borders of this highly connected nation (22).
The reproduction number is a key threshold quantity to assess the transmission potential of an emerging disease such as COVID-19 (23, 24). It quantifies the average number of secondary cases generated per case. If the reproduction number is below 1.0, infections occur in isolated clusters as self-limited chains of transmission, and persistence of the disease would require continued undetected importations. On the other hand, reproduction numbers above 1.0 indicate sustained community transmission (16, 24). Using epidemiological data and mathematical modeling tools, we are monitoring the effective reproduction number, Rt, of SARS-CoV-2 transmission in Singapore in real-time, and here we report the evolution of Rt by February 27, 2020. Specifically, we assess the effective reproduction number from the daily case series of imported and autochthonous cases by date of symptoms onset after adjusting for reporting delays, and we also derive an estimate of the reproduction number based on the characteristics of the clusters of COVID-19 in Singapore.
Methods
Data
We obtained the daily series of confirmed cases of COVID-19 in Singapore as of February 27, 2020. Individual-level case details including the dates of symptoms onset, the date of reporting, and whether the case is autochthonous (local transmission) or imported are publicly available from the Ministry of Health, Singapore (25). Clusters consisting of one or more cases according to the infection source were also assembled from case descriptions obtained from field investigations conducted by the Ministry of Health, Singapore (25). Single imported cases are analyzed as clusters of size 1 whereas unlinked cases were excluded from the cluster analysis.
Transmission clusters
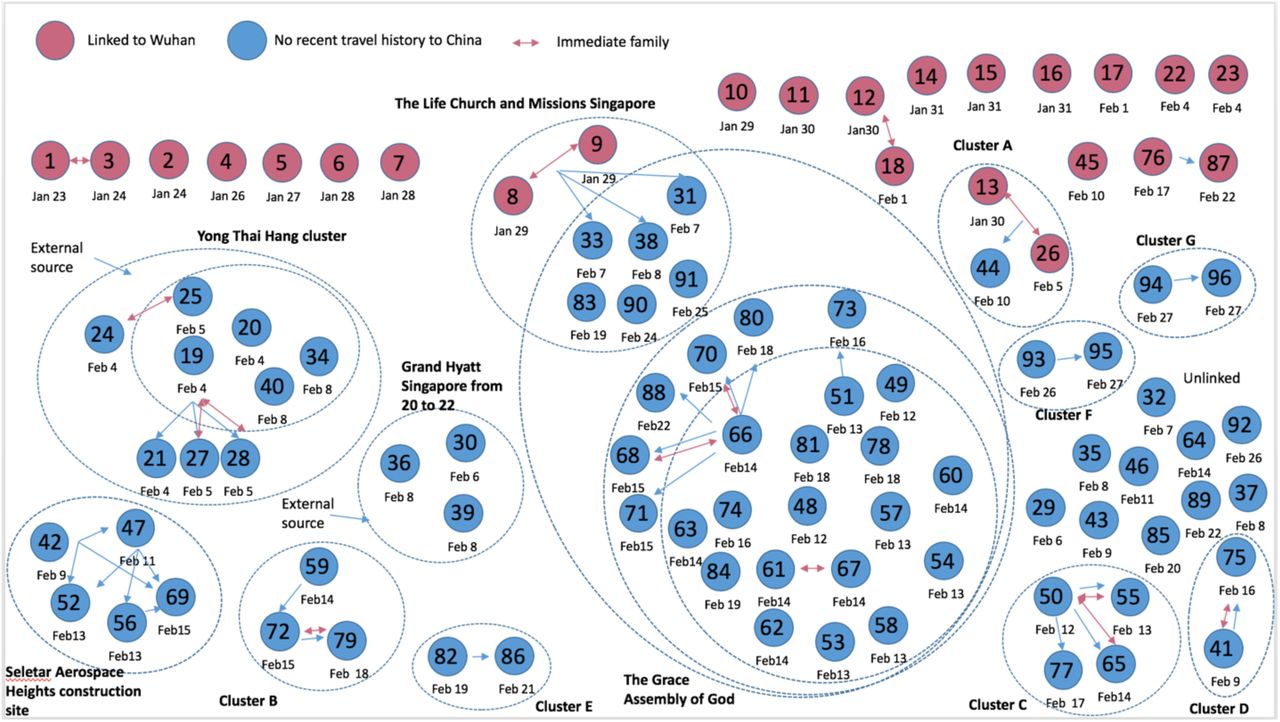
As of February 27 2020, eleven different clusters of COVID-19 cases with 1- 31 cases per cluster have been reported in Singapore. A schematic diagram and characteristics of the COVID-19 clusters in Singapore are given in Figure 1 and Table 1. The geographic location of the four largest clusters accounting for 51% of the total cases is shown in Figure 2 whereas the corresponding distribution of cluster sizes is shown in Figure 3. Recently, links between the Wuhan travelers and the two church clusters have been established in Singapore as described below.

Cluster network of the cases in Singapore for the COVID-19 global epidemic as of February 27, 2020. The pink circles represent the imported cases where as the blue circles represent cases with no travel history to China. The larger dotted circles represent the COVID-19 disease clusters. Each blue arrow represents the direction in which the disease was transmitted. Pink arrows represent immediate family. Dates below the circles are the dates of case reporting.

Map depicting the spatial distribution of the 4 largest COVID-19 clusters in Singapore; Grand Hayatt cluster, Yong Thai Hang cluster, Seletar Aerospace cluster and The Grace Assembly of God Church and Life Church and Missions cluster as of February 27, 2020.

Distribution of COVID-19 cluster sizes in Singapore as of February 27, 2020.
Yong Thai Hang cluster
This cluster with 9 cases was the first to be reported in Singapore. It has nine traceable links, including eight Chinese and one Indonesian national associated with the visit of Chinese tourists to the Yong Thai Hang health products store, a shop that primarily serves the Chinese population, on January 23, 2020. Four shop employees and the tour guide were first identified as a cluster on February 4, 2020 (12, 26, 27). The tour guide subsequently infected her husband, a newborn and the domestic helper (27). No further cases have been added to this cluster as of February 8, 2020.
Grand Hayatt hotel
This cluster with 3 local cases was the second cluster to receive international attention, as it originated from a business meeting held at the Grand Hayatt hotel attended by Singaporean locals and the Chinese visitors from Hubei (28). Four international cases associated with this cluster had left Singapore before the onset of symptoms. All Singaporean residents associated with this cluster have recovered as of February 19, 2020 (28). No additional cases have been added to this cluster as of February 8, 2020.
Seletar Aerospace Heights cluster
This cluster with 5 Bangladeshi work pass holders was identified on February 9, 2020. No further cases have been added to this cluster as of February 15, 2020.
The Life Church and Missions and The Grace Assembly of God cluster
This cluster is composed of 31 cases, including two imported cases who are related to each other and 29 local cases. The cluster started during The Life Church and Missions service event in Paya Lebar on January 19, 2020. This event was apparently seeded by two visitors from Wuhan China who infected a couple with SARS-CoV-2 at the church. The infected couple likely passed the infection to another case during a Lunar New Year’s celebration on January 25, 2020. This case had subsequently infected Grace Assembly of God church staff at the Tanglin branch, generating secondary cases by the time he was reported on February 14, 2020. Two branches of the Grace Assembly of God church at Tanglin and Bukit Batok have been included in the cluster (26, 29). This church has about 4800 people in attendance on average over the weekend. While the church has momentarily closed, field investigations have not led to conclusive evidence regarding super- spreading transmission (30). No further cases have been added to this cluster as of February 25, 2020.
Cluster A
The first case of this cluster was identified on January 30, 2020. The cluster comprise of 2 imported and one local case. The two imported cases are related to each other. No further cases have been added in this cluster as of February 10, 2020.
Cluster B
The first case of this cluster was identified on February 14, 2020. This cluster is composed of three cases (case 59 infected case 72 who in turn infected case 79). No further cases have been added in this cluster since February 18, 2020.
Cluster C
This first case of this cluster was identified on February 12, 2020. This cluster is composed of 4 cases, where case 50 infected the other three cases. No further cases have been added to this cluster since February 17, 2020.
Cluster D
The first case of this cluster was identified on February 9, 2020. The two cases in this cluster are related to each other; where case 41 infected case 75. No further cases have been added in this cluster since February 16, 2020.
Cluster E
The first case of this cluster was identified on February 19, 2020. Two cases have been identified in this cluster, where case 82 infected case 86. No further cases have been added in this cluster since February 21, 2020.
Cluster F
The first case of this cluster was identified on February 26, 2020. This cluster is composed of two cases, where case 93 infected case 95. No further cases have been added in this cluster since February 27, 2020.
Cluster G
This cluster is composed of two cases that were identified on February 27, 2020.
Adjusting for reporting delays
As an outbreak progresses in real time, epidemiological curves can be distorted by reporting delays arising from several factors that include: (i) delays in case detection during field investigations, (ii) delays in symptom onset after infection, (iii) delays in seeking medical care, (iv) delays in diagnostics and (v) delays in processing data in surveillance systems (31). However, it is possible to adjust epidemic curves by reporting delays using statistical methods (32). The reporting delay for a case is defined as the time lag in days between the date of onset and date of reporting. Here we adjusted the COVID-19 epidemic curve of local cases by reporting delays using a non- parametric method that employs survival analysis techniques (33-35). The 95% prediction limits are derived according to Lawless et al. (36). For this analysis, we exclude 7 imported cases and 5 local cases for which dates of symptoms onset are unavailable.
Effective reproduction number from case incidence
We assess the effective reproduction number over the course of the outbreak, Rt, which quantifies the temporal variation in the average number of secondary cases generated per case during the course of an outbreak after considering multiple factors including behavior changes, cultural factors, and the implementation of public health measures (16, 24, 37). Estimates of Rt>1 indicate sustained transmission; whereas, Rt <1 implies that the outbreak is slowing down and the incidence trend is declining. Hence, maintaining Rt <1 is required to bring an outbreak under control. Using the reporting delay adjusted incidence curve, we estimate the most recent estimate of Rt for COVID-19 in Singapore. We first characterize daily incidence of local cases using the generalized logistic growth model (GLM) after adjusting for imported cases. This model characterizes the growth profile via three parameters: the growth rate (r), the scaling of the growth parameter (p) and the final epidemic size (K). The GLM can reproduce a range of early growth dynamics, including constant growth (p=0), sub-exponential or polynomial growth (0<p<1), and exponential growth (p=1) (38). The generation interval is assumed to follow a gamma distribution with a mean of 4.41 days and a standard deviation of 3.17 days based on refs. (39, 40). We denote the local incidence at calendar time ti by Ii, the raw incidence of imported cases at calendar time ti by Ji, and the discretized probability distribution of the generation interval by ρi. Then, we can estimate the effective reproduction number by employing the renewal equation (41, 42)
In this equation the numerator represents the new cases Ii, and the denominator represents the total number of cases that contribute to the new cases Ii at time ti.Parameter 0≤ α ≤1 represents the relative contribution of imported cases to the secondary disease transmission. We perform a sensitivity analyses by setting α =0.15 and α =1.0(43). Next, in order to derive the uncertainty bounds around the curve of Rt,we estimate Rt for 300 simulated curves assuming a Poisson error structure (44).
Reproduction number (R) from the analysis of cluster sizes
In the branching process analysis, the number of transmissions caused by each new infection is modeled as a negative binomial distribution. This is parameterized by the effective reproduction number, R, and the dispersion parameter, k. The reproduction number provides the average number of secondary cases per index case, and the dispersion parameter varies inversely with the heterogeneity of the infectious disease. This parameterization allows variation in the both the strength and heterogeneity of disease transmission, where a lower dispersion parameter indicates higher transmission heterogeneity. Assuming each cluster of infection is initiated by a single infection, branching process theory provides an analytic representation of the size distribution of cluster sizes (45). This permits direct inference of the maximum likelihood estimate and confidence interval for R and k.
Results
Incidence data and reporting delays
The COVID-19 epidemic curve by the date of reporting and stratified for local and imported incidence case counts is shown in Figure 4. It is worth noting that the majority of the imported cases occurred at the beginning of the outbreak in Singapore. The cumulative curve shows an upward trajectory during February 11-27, 2020 with an average of ∼3 new cases reported per day (Figure 4) while no cases have been reported with symptoms onset dates after February 22, 2020. Out of 24 imported cases, only 4 cases have been linked to secondary cases. Meanwhile, a total of 72 autochthonous cases have been reported as of February 27, 2020 including 10 cases that are not connected to any known transmission chains.
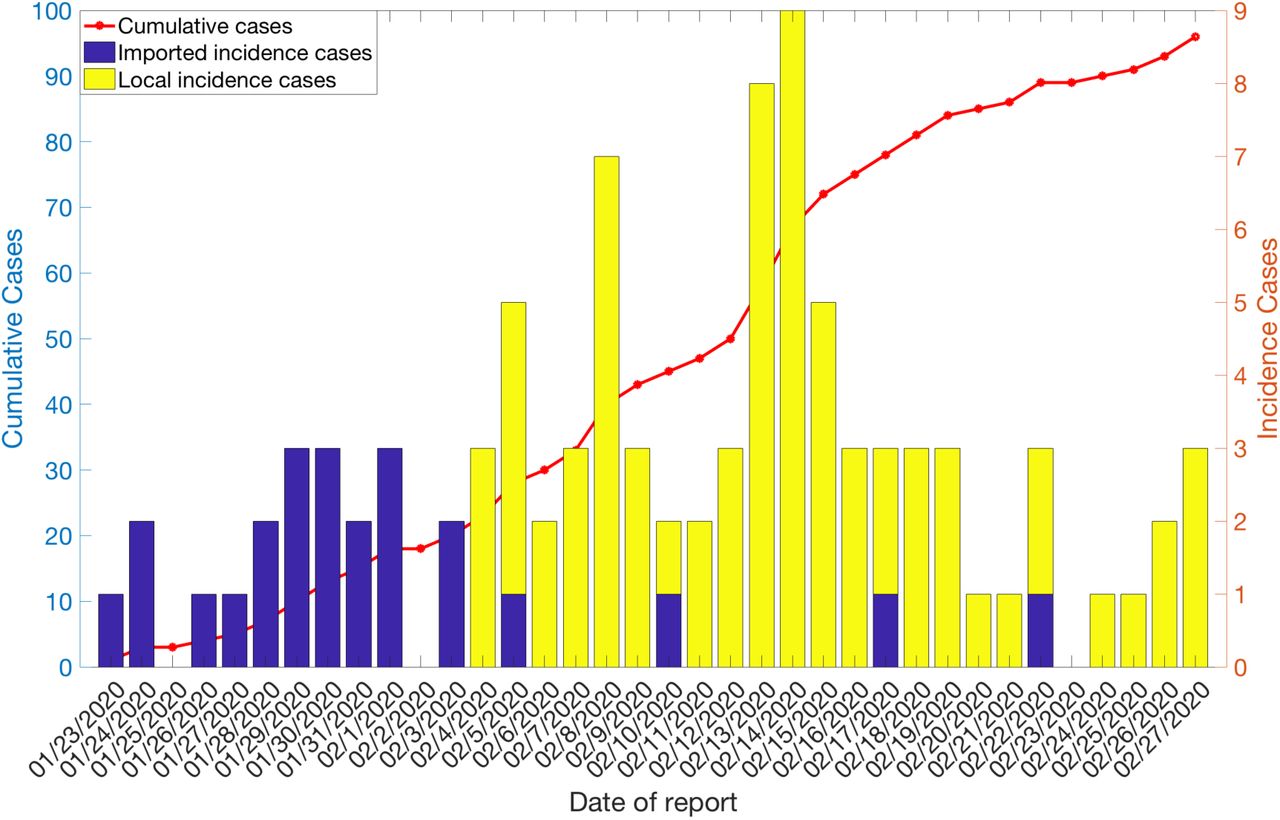
Unadjusted local and imported Incidence cases by date of reporting as of February 27, 2020. The solid line represents the cumulative cases count for the COVID-19 cases in Singapore by the date of reporting.
The reporting-delay adjusted epidemic curve of local cases by date of symptoms onset is shown in Figure 5, and the distribution for reporting delays is displayed in Figure 6. The gamma distribution provided a reasonable fit to the distribution of overall reporting delays and estimated a mean reporting delay at 7.7 days (95% CI: 6.6, 8.9) (Figure 6). We also found that imported cases tend to have shorter mean reporting delays compared to local cases (mean 3.4 vs. 9 days, Wilcoxon test, p<0.001), as imported cases tend to be identified more quickly. The distributions of reporting delays across for the larger clusters are displayed in Figure 7.

Reporting delay adjusted incidence for the COVID-19 outbreak in Singapore accounting for local cases as of February 27, 2020. Blue bars represent the raw incidence, red solid line represents the adjusted incidence, red dotted lines represent the 95% lower and upper bound of the adjusted incidence.

Distribution of reporting delays for all cases as of February 27, 2020 represented as a histogram. The red circle represents the mean of reporting delays and the horizontal line represents the 95% CI assuming reporting delays have a gamma distribution.

Reporting delay distribution with mean (blue circle) and 95% CI (vertical lines) for each big cluster in Singapore as of February 27, 2020.
Reproduction Numbers
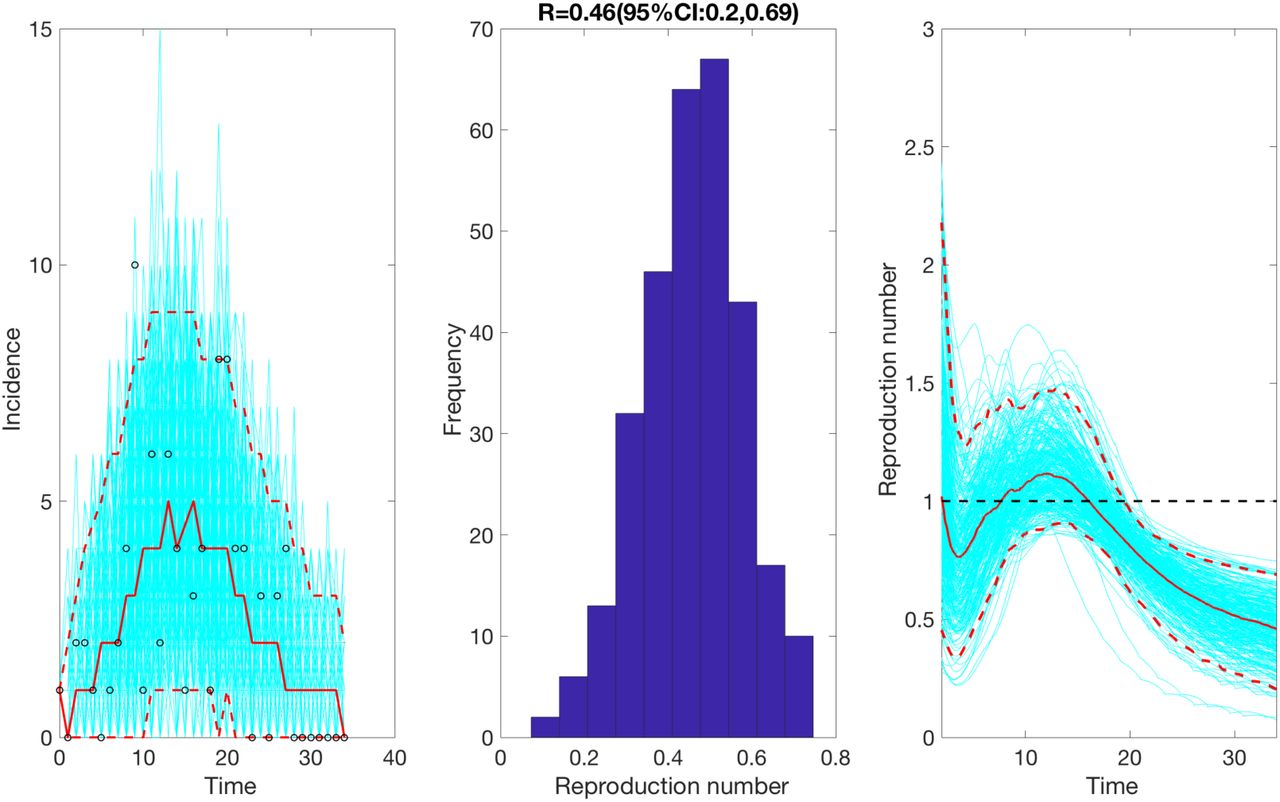
Using the delay-adjusted incidence curve of local cases, we estimated the intrinsic growth rate r at 0.6 (95% CI: 0.3,0.9), the scaling of growth parameter p at 0.7 (95% CI: 0.5,0.9), indicating early sub-exponential growth dynamics of COVID-19 and the final epidemic size at 92.7 (95%CI: 72.5, 113.4) (Figure 8). The effective reproduction number peaked with a mean value ∼1.1 around February 2nd, 2020 and declined thereafter. As of February 27th, 2020, our most recent estimate of Rt is at 0.5 (95% CI: 0.2,0.7). Our estimates were not sensitive to changes in parameter α. Our overall R estimate based on cluster size distribution is at 0.7 (95% CI: 0.5, 0.9).

The effective reproduction number reproduction number with 95% CI estimated by adjusting for the imported cases α=1.0by February 27, 2020. The effective reproduction number peaked with a mean value ∼1.1 around February 2nd, 2020 and declined thereafter. As of February 27th, 2020, our most recent estimate of Rt is at 0.5 (95% CI: 0.2,0.7).
Based on the entire distribution of cluster sizes, we jointly estimated the overall reproduction number R and the dispersion parameter k. Fitting the negative binomial distribution to the cluster data in the empirical distributions of the realizations during the early stages of the outbreak in Singapore, the reproduction number is estimated at 0.7 (95% CI: 0.5, 0.9) after adjusting for the independent and identically distributed observation probability of 50%. The dispersion parameter is estimated at 0.5 (95% CI: 0.1, Inf.) indicating higher transmission heterogeneity.
Discussion
Overall, current estimates of transmission potential in Singapore, based on two different data sources and different methods, suggest that temporary local transmission potential of SARS-CoV- 2 has occurred in Singapore while our most recent estimate of the effective reproduction number and the overall reproduction number derived from the distribution of cluster sizes are below the epidemic threshold of 1.0. Temporary sustained transmission at the beginning of the epidemic can be attributed to multiple case importations and initiation of local transmission in the region. However, as cases get identified, transmission potential starts to decline in early February 2020. While large-scale transmission has not been reported in Singapore, the fact that asymptomatic and subclinical cases are now well documented for COVID-19 (46) suggests that our estimates could be underestimated (47). On the other hand, it is not clear if asymptomatic or subclinical cases are as infectious as symptomatic cases. Indeed, we have reported that multiple local cases have yet to be traced to existing transmission chains. Additional data collected during the course of the outbreak will help obtain an improved picture of the transmission dynamics (8). These findings emphasize the need to strengthen public health interventions including active case contact tracing activities in countries with emerging transmission of SARS-CoV-2. It is worth noting that current data suggests that imported cases have contributed little to secondary cases in Singapore, with most of the imported cases dating back to the early phase of the epidemic. However, there are examples such as the Grant Hayatt Singapore cluster and the Yong Thai cluster that were linked to imported sources, and the original sources had left Singapore before these local clusters emerged (28, 48).
Our Rt estimates for Singapore are substantially lower than mean estimates reported for the COVID-19 epidemic in China, which range from: 2.2-7.1 (49-56). This indicates that containment efforts are having a significant impact in Singapore. However, some differences in the reproduction numbers reported for the epidemic in China may result from different methods, differences in data sources, and time periods used to estimate the reproduction number. Similarly, a recent study has shown an average reporting delay of 6.1 days in China (57) which agrees with our mean estimate for local cases in Singapore (7.7 days). Moreover, the scaling parameter for growth rate (p) indicates a sub-exponential growth pattern in Singapore, reflecting the effective isolation and control strategies in the region. This is consistent with a sub-exponential growth pattern for Chinese provinces excluding Hubei (p∼0.67), as estimated by a recent study (58); whereas, an exponential growth pattern was estimated for Hubei (p∼1.0) (58).
A previous study on the 2015 MERS outbreak in South Korea reported substantial potential for superspreading transmission despite a subcritical Rt (59). The lower estimate of the dispersion parameter in our study also indicate significant transmission heterogeneity in Singapore. Super- spreading events of MERS-CoV and SARS-CoV associated with nosocomial outbreaks are well documented and driven largely by substantial diagnostic delays (16, 35). Although the average delay from onset of symptoms to diagnosis for COVID-19 patients in Singapore is at 7.7 days and no super-spreading events has been observed yet, the dispersion parameter, k<1, indicates the probability of observing large clusters and the potential for super-spreading (59, 60). Therefore, public health measures enacted by public health authorities in Singapore that advise the public to avoid mass gatherings and confined places are crucial to prevent disease amplification events. However, the presence of asymptomatic cases in the community represent an ongoing threat (61, 62) although it is not currently known if subclinical cases are less infectious. This highlights the need for rapid testing suspected cases to quickly isolate those that test positive for the novel coronavirus. To achieve this goal, public health authorities in Singapore are reactivating 900 general practitioner (GP) clinics (63). Field investigations have identified cases linked to the “Grace Assembly of God” and the “Life Church and Missions” in Singapore, a large cluster seeded by the Wuhan visitors. Our overall estimate for R does not differ considerably if these two churches are analyzed as a single large cluster or as two smaller clusters. While new clusters emerge, some clusters including the Yong Thai Hang cluster and the Grand Hayatt cluster have stabilized (no recent additional cases in most clusters). The Grace Assembly of God” and the “Life Church and Missions” cluster continues to be consolidated (48, 64).
Beyond Singapore, COVID-19 clusters are being reported in an increasing number of countries including Germany, Iran, Italy, South Korea and on the Diamond Cruise ship in Japan (2, 65-68). Moreover, Singapore has also produced secondary chains of disease transmission beyond its borders (22). Although Singapore has been detecting and isolating cases with diligence, our findings underscore the need for continued and sustained containment efforts to prevent large- scale community transmission including nosocomial outbreaks. Overall, the current situation in Singapore highlights the need to investigate the unlinked and asymptomatic cases that could be a potential source of secondary cases and amplified transmission in confined settings. Although Singapore has a world-class health system including a highly efficient contact tracing mechanism in place (22), continued epidemiological investigations and active case finding efforts are needed to control the outbreak.
Our study is not exempt from limitations. First, the outbreak is still ongoing and we continue to monitor the transmission potential of COVID-19 in Singapore. Second, onset dates are missing in twelve cases, which were excluded from our analyses. Third, we cannot rule out that additional cases will be added to existing clusters, which may lead to underestimating the reproduction number based on the cluster size distribution. Finally, the cluster size analysis is modeled under the assumption that there is one primary case (i.e. all cases can be connected eventually to one person), rather than being multiple imported cases. As more data become available, more theoretical work could be extended to account for the uncertainty regarding the primary number of cases per cluster and the possibility of ongoing transmission in some clusters.
Conclusion
This is the first real-time study to estimate the evolving transmission potential of SARS-CoV-2 in Singapore. Our current findings point to temporary sustained transmission of SARS-CoV-2, with our most recent estimate of the effective reproduction number lying below the epidemic threshold of 1.0. These estimates highlight the significant effects of containment efforts in Singapore while at the same time suggest the need to maintain social distancing and active case finding efforts to stomp out all active or incoming chains of transmission.
Data Availability
All data are publicly available.
List of abbreviations
COVID-19 SARS-CoV-2
Ethics approval and consent to participate
Not applicable
Consent for publication
Not applicable
Conflict of Interest
The authors declare no conflicts of interest.
Funding
G.C. is supported by NSF grants 1610429 and 1633381.
Data declaration
All data are publicly available.
Author Contributions
A.T, S.B., P.Y. and G.C. analyzed the data. A.T., Y. L, P.Y and S.M. retrieved and managed data; A.T and G.C wrote the first draft of the manuscript. All authors contributed to writing and revising subsequent versions of the manuscript. All authors read and approved the final manuscript.
References


