
Abstract
Potential transmissibility of asymptomatic 2019 Novel Coronavirus infection and a substantial asymptomatic ratio have been reported in clinical studies. Employing a statistical modeling analysis, we derived a delay-adjusted asymptomatic ratio of the positive 2019-nCoV infections onboard the Princess Cruises ship along with the timeline of infections. We estimated the percentage of cases that are asymptomatic to be 34.6% (95% CrI: 29.4%–39.8%), with most of the infections occurring before the start of the 2-week quarantine.
Background
Since COVID-19 emerged in the city of Wuhan, China in December 2019, thousands of people have succumbed to the novel coronavirus especially in the Province of Hubei while dozens of imported and secondary cases have been reported in over 25 countries as of February 19, 2020 [1].
The transmissibility and epidemiological characteristics of COVID-19 continue to be investigated as the virus continues its march through the human population [2–3]. While reliable estimates of the reproduction number and the death risk associated with COVID-19 are vital in guiding public health policy, another key epidemiological parameter for choosing an effective control measures is the asymptomatic ratio, which quantifies the proportion of asymptomatic infections among all the infections. Indeed, the asymptomatic ratio is a useful quantity to gauge the true burden of the disease and better understand estimates of transmission potential. Such ratio varies widely across infectious diseases, from 8% for measles and 32% for norovirus up to 90-95% for polio [4–6]. Most importantly, it is well established that asymptomatic individuals are frequently capable of spreading the virus [7–8]. COVID-19 is not the exception to this pattern, with accumulating evidence indicating that a substantial fraction of the infected individuals with the novel coronavirus are asymptomatic [9–11]. As an epidemic progresses over time, suspected cases are examined and tested for the infection using polymerase chain reaction (PCR) or rapid diagnostic test (RDT). Then, time-stamped counts of the test results stratified according to the presence or absence of symptoms at the time of testing are often reported to the public in near real-time. Nevertheless, it is important to note that the estimation of the asymptomatic ratio needs to be handled carefully since real-time outbreak data are influenced by the phenomenon of right censoring, due to the time lag between the time of examination and sample collection and the development of illness.
In this paper, we conduct a statistical modeling analysis to estimate the asymptomatic ratio among infected individuals who have tested positive for 2019-nCoV infections onboard the Princess Cruises Ship along with their time of infections, accounting for the delay in onset of symptoms and right-censoring.
Epidemiological description and data
In Yokohama, Japan, an outbreak of COVID-19 is unfolding on board the Princess Cruise Ship, which has been under quarantine orders since February 5, 2020, after a former passenger of the cruise ship tested positive for the virus after disembarking in Hong Kong. As of February 20, 2020, two days after the scheduled two-week quarantine came to an end, a total of 621 people including one quarantine officer, one nurse and one administrative officer have tested positive for COVID-19 out of the 3,711 passengers and crew members on board. Laboratory tests by PCR have been conducted, prioritizing symptomatic or high risk groups.
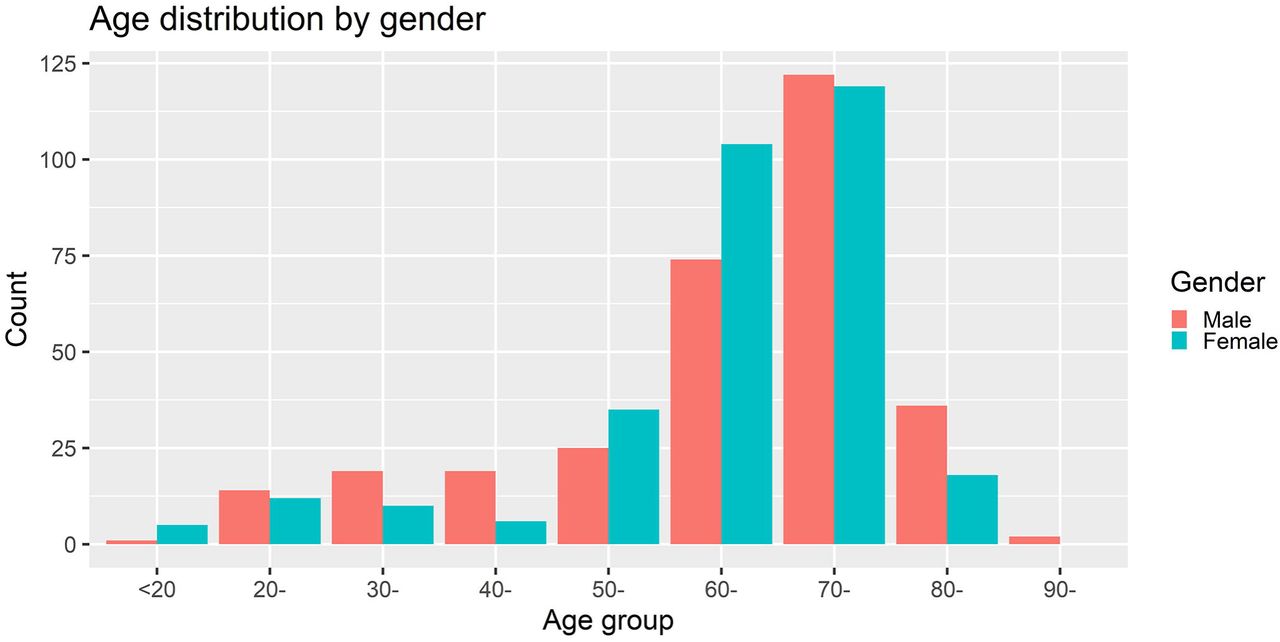
Daily time series of laboratory test results for COVID-19 (both positive and negative), including information of presence or absence of symptoms from February 5, 2020 to February 19, 2020 were extracted from secondary sources [12]. A total of 621 people have tested positive among 3011 tests as of February 19, 2020. Out of 621 cases, a total of 309 cases are female and six were aged 0-19 years, 140 were aged 20-59 years and 475 were 60 years and older (Figure 1). The nationality of the cases includes Japan (270), United States (88), Canada (50), Australia (48), Philippines (46), Hong Kong (30) and China (28).

Out of the 621 confirmed cases, a total of 299 and 322 cases have been reported to be symptomatic and asymptomatic, respectively. The proportion of asymptomatic appears to be 16.1 % (35/218) before February 13, 25.6 % (73/285) on February 15, 31.2 % (111/355) on February 16, 39.9% (181/454) on February 17, 45.4 % (246/542) on February 18 and 51.9% (322/621) on February 19 (Table 1). Soon after identification of the first infections, both symptomatic and asymptomatic cases were transported to designated medical facilities specialized in infectious diseases in Japan. However, these patients are treated as external (imported) cases, and a detailed description of the progression of their symptoms has not been made public.
The asymptomatic ratio was defined as the proportion of asymptomatically infected individuals among the total number of infected individuals.
Statistical modelling
The observations where treated as survival data with right-censoring. The probability of being asymptomatic along with the infection time of each individual where estimated in a Bayesian framework using Hamiltonian Monte Carlo (HMC). A detailed description of the model used and the computation is provided in a Technical Appendix.
Findings from the real-time outbreak analysis
Posterior median estimates of true asymptomatic proportion among the reported asymptomatic cases is at 0.32 (95% CrI: 0.27–0.37), with the estimated total number of true asymptomatic cases at 103.5 (95%CrI: 88.0-80.6) and the estimated asymptomatic ratio at 34.6% (95% CrI: 29.4%–39.8%).
We conducted sensitivity analyses to examine how varying the mean incubation period between 5.5 and 9.5 days affects our estimates of the true asymptomatic proportion. Estimates of true asymptomatic proportion among the reported asymptomatic cases are somewhat sensitive to changes in the mean incubation period, ranging from 0.25 (95%CrI: 0.20–0.31) to 0.38 (95%CrI: 0.33–0.42), while the estimated total number of true asymptomatic cases range from 81.8 (95%CrI: 64.7–99.0) to 121.3 (95%CrI: 107.3–135.4) and the estimated asymptomatic ratio ranges from 27.4% (95%CrI: 21.6%–33.1%) to 40.6% (95%CrI: 35.9%–45.3%).
Heat maps were used to display the density distribution of infection timing by individuals (Figure S1) where the vertical line corresponds to the date of February 20, 2020. Among the symptomatic cases, the infection timing appears to have occurred just before or around the start of the quarantine period, while the infection timing for asymptomatic cases appears to have occurred well before the start of the quarantine period.
Discussion
We have conducted statistical modeling analyses together with publicly available data to elucidate the asymptomatic ratio, along with the time of infection among the COVID-19 infected cases onboard the Princess Cruises ship.
Our estimated asymptomatic ratio is at 34.6% (95% CrI: 29.4%–39.8%), consistent with recently derived estimates from data of Japanese citizens evacuated from Wuhan [13]. Considering the similarity in viral load and the high possibility of potent transmission potential, the high ratio of asymptomatic infections has significant public health implications [14]. For instance, the isolation period for contacts with confirmed cases need to be set for a sufficient duration to ensure that the infection has resolved even if symptoms are not apparent.
Most of the infections appear to have occurred before or around the start of the 2-week quarantine that started on February 5, 2020, which further highlights the potent transmissibility of the SARS-CoV-2 virus, especially in confined settings. To further mitigate transmission of COVID-19 and bring the epidemic under control in areas with active transmission, it may be necessary to minimize the number of gatherings in confined settings.
Our study is not free from limitations. First, laboratory tests by PCR were conducted focusing on symptomatic cases especially at the early phase of the quarantine, if asymptomatic cases where missed as a result of this, it would mean we have underestimated the asymptomatic proportion. Second, it is worth noting that the data of passengers and crews employed in our analysis is not a random sample from the population. Considering that most of the passengers are 60 years and older, the nature of this age distribution may lead to underestimation if older individuals tend to experience more symptoms. An age standardized asymptomatic ratio would be more appropriate in that case. Third, the presence of symptoms in cases with COVID-19 may correlate with other factors unrelated to age such as comorbidities (e.g. cardiovascular disease, diabetes, immunosuppression). Therefore, more detailed data documenting the baseline health of the individuals including the presence of underlying diseases would be useful to remove the bias in this estimate of the asymptomatic ratio.
In summary, we have estimated the proportion of asymptomatic cases among individuals who have tested positive for novel COVID-19 adjusting for the delay in symptom onset and right-censoring of the observations along with the times of infection of confirmed cases onboard the Princess Cruises Ship.
Data Availability
The present study relies on published data and access information to essential components of the data are available from the corresponding author.
Funding statement
KM acknowledges support from the Japan Society for the Promotion of Science (JSPS) KAKENHI Grant Number 18K17368 and from the Leading Initiative for Excellent Young Researchers from the Ministry of Education, Culture, Sport, Science & Technology of Japan. KK acknowledges support from the JSPS KAKENHI Grant Number 18K19336 and 19H05330. AZ acknowledges supports from the Oxford Martin School Programme on Pandemic Genomics. GC acknowledges support from NSF grant 1414374 as part of the joint NSF-NIH-USDA Ecology and Evolution of Infectious Diseases program
Additional files
Additional file 1: Supplementary document
Additional file 2: Figure S1. Heat maps of the density distribution of infection timing by individuals
A) Symptomatic cases (N= 299), B) Asymptomatic cases (N= 322). Vertical axis represents each individuals from 1 to N. Cases embarked after positive results. Day 1 corresponds to January 20, 2020, when symptomatic index case embarked. Vertical lines corresponds to February 5, 2020 when quarantine started.


